ZigZag Dashboard for MT4
- Indicadores
- Taras Slobodyanik
- Versión: 4.70
- Actualizado: 14 marzo 2024
- Activaciones: 10
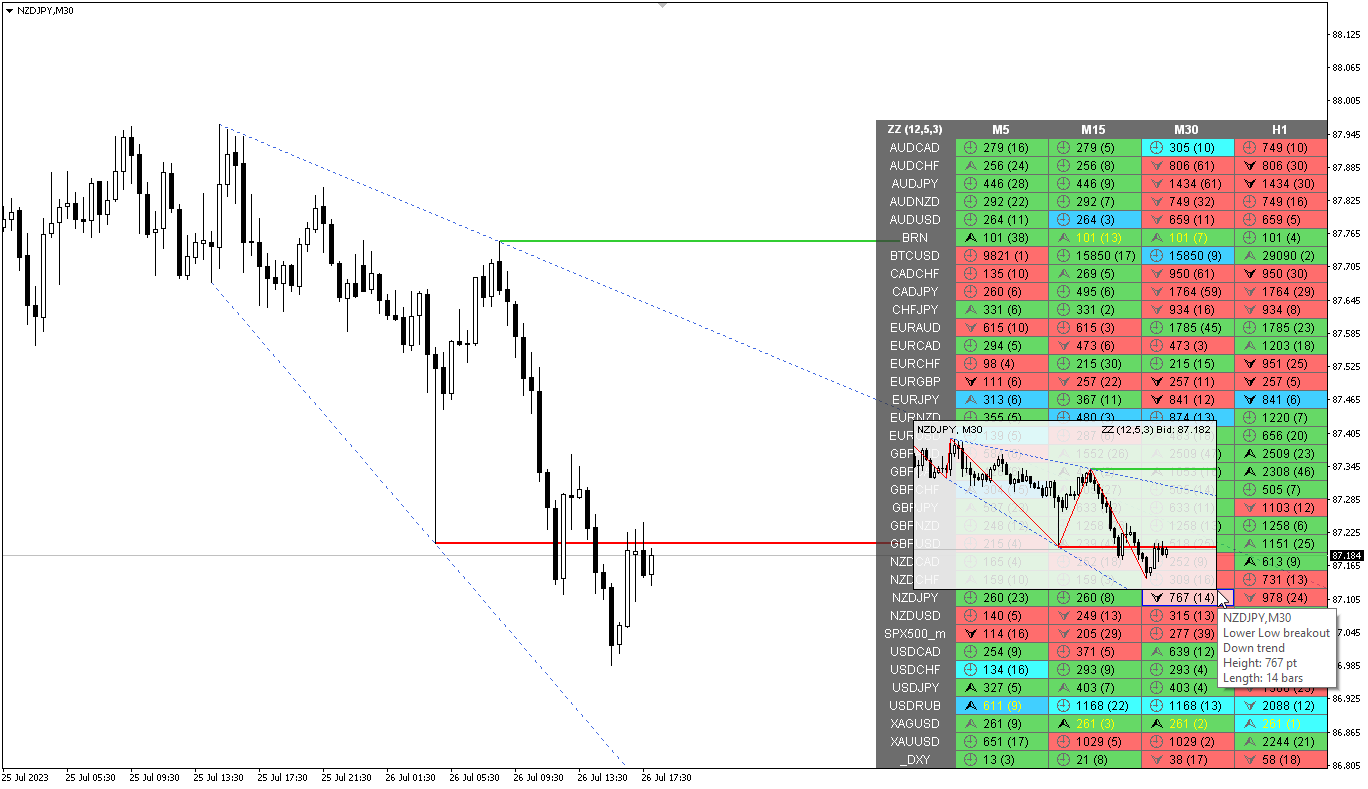
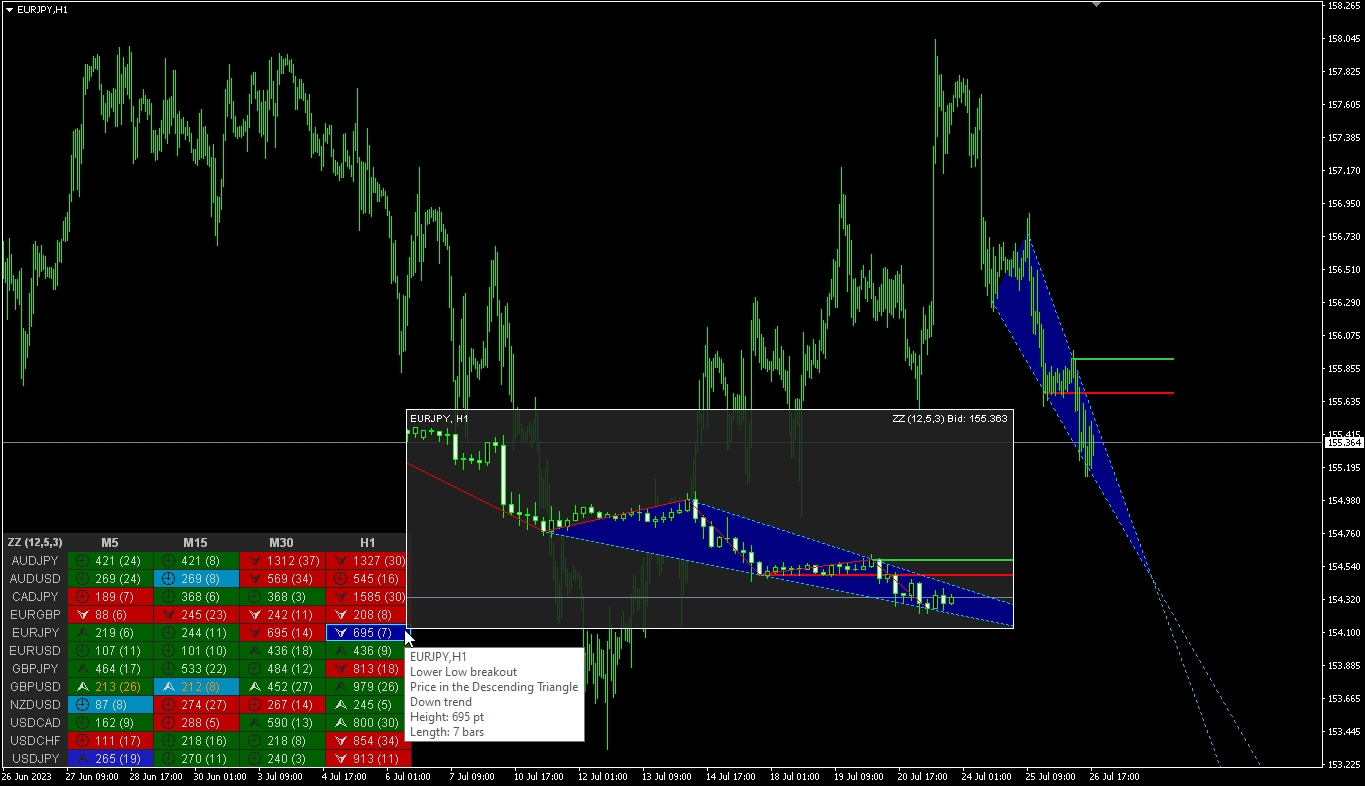
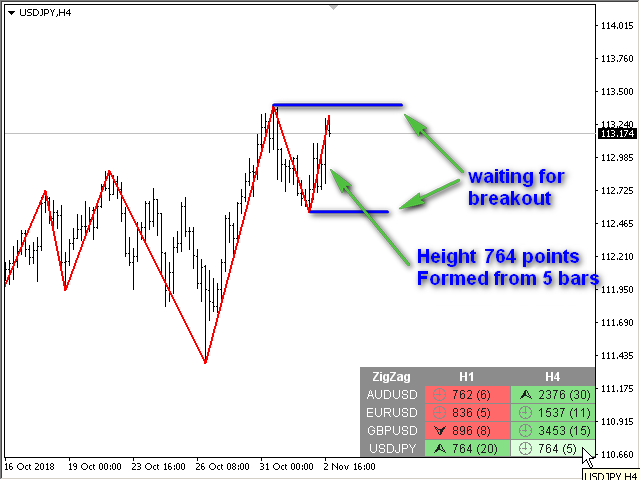
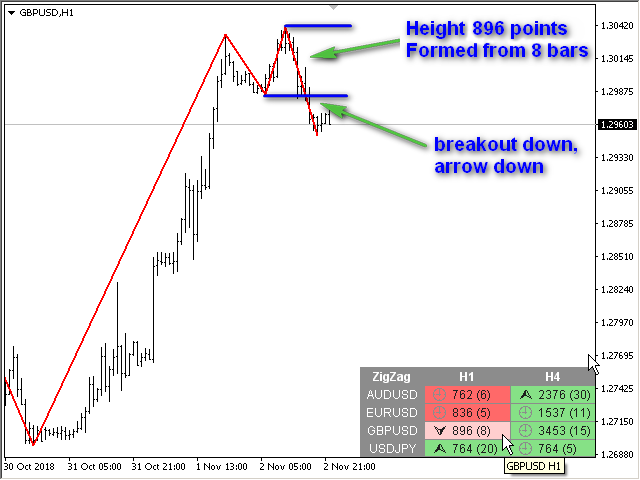
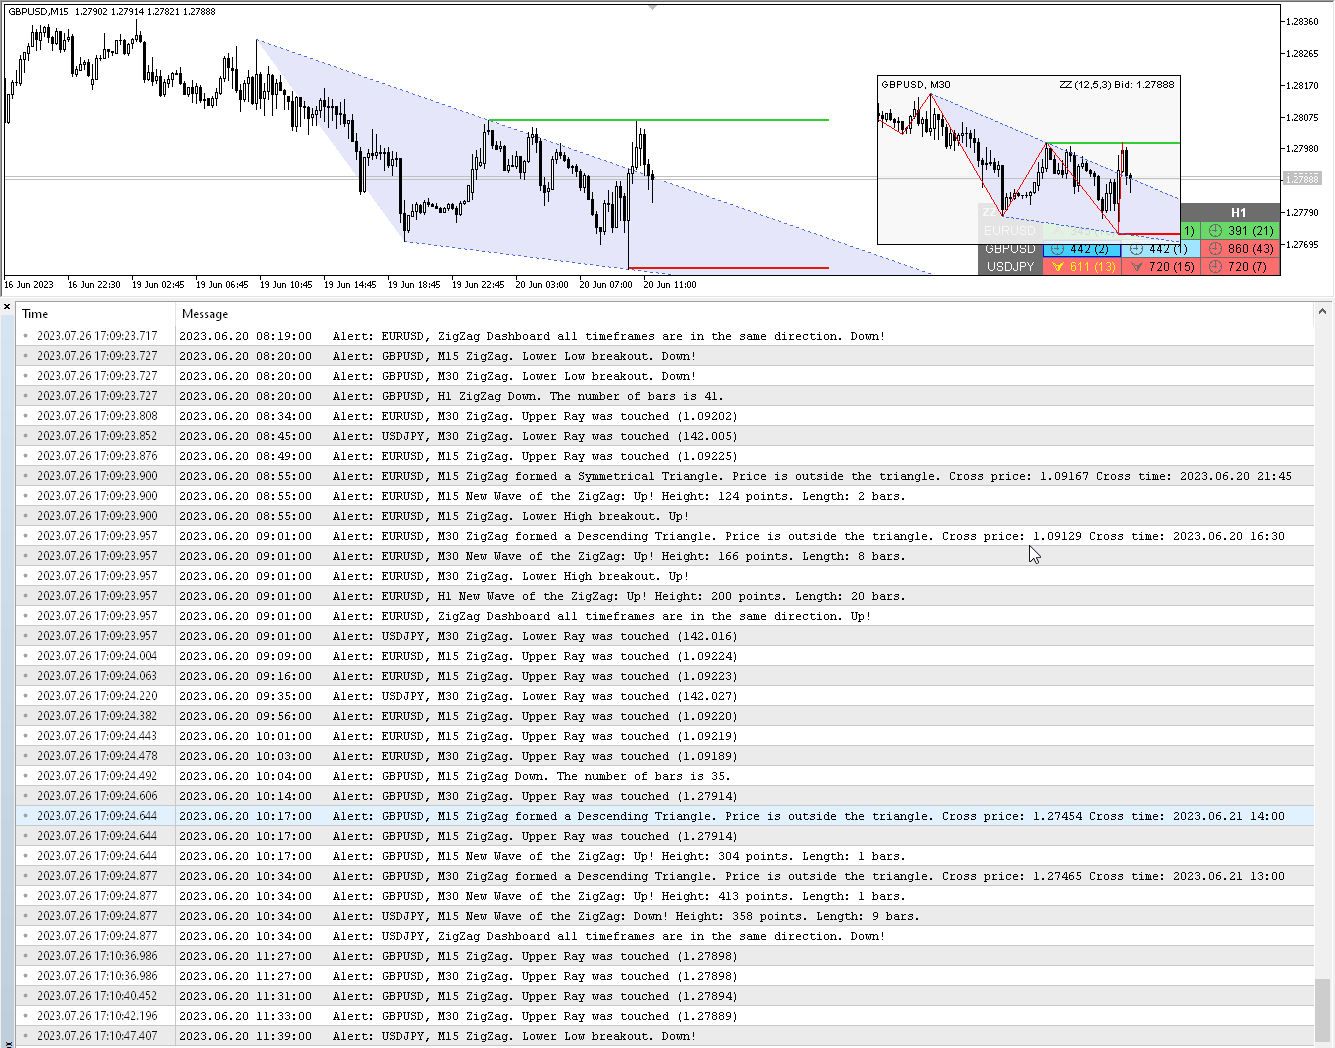
Modificación multidivisa y multitemporal del indicador ZigZag. Muestra la dirección actual del mercado, la altura del último movimiento, el número de barras de este movimiento y la ruptura del punto anterior del ZigZag (línea horizontal). Este es el escáner MTF.
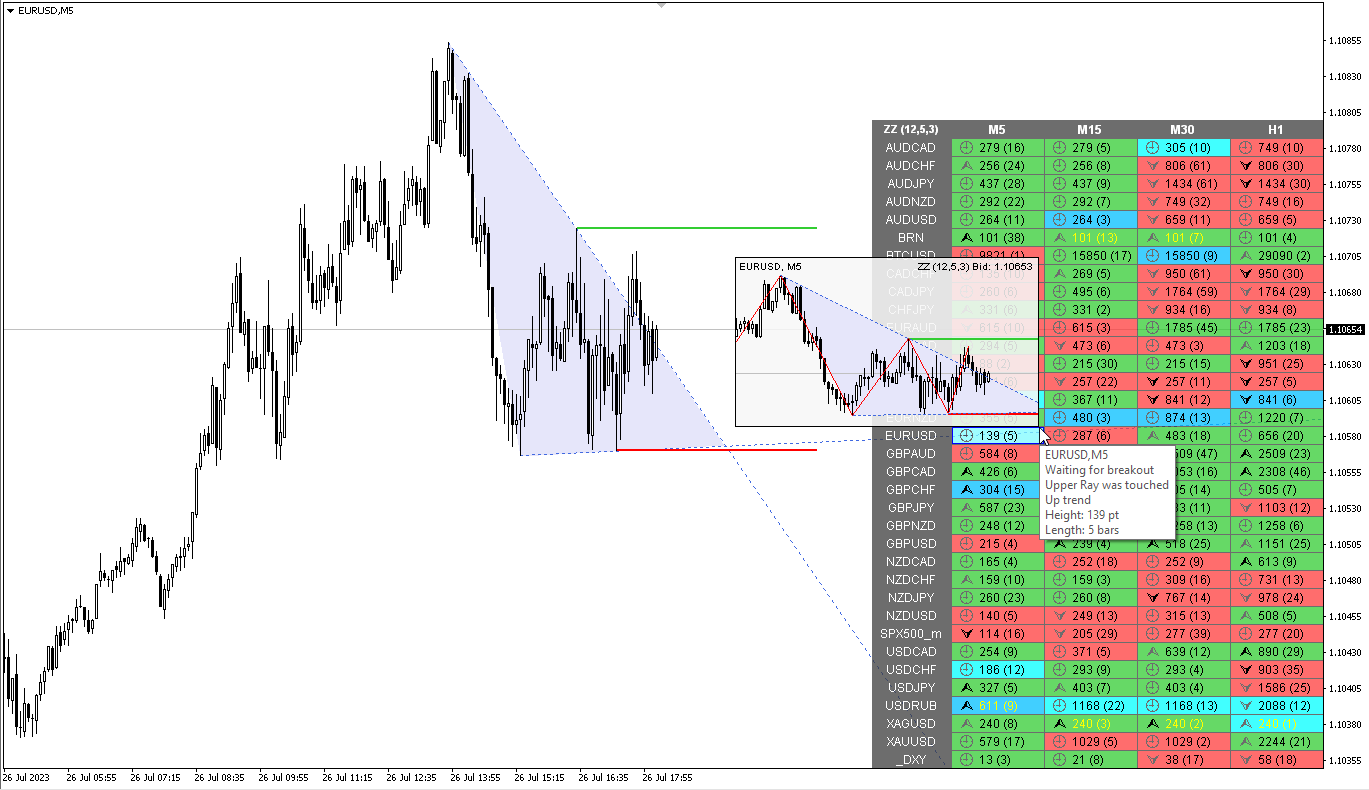
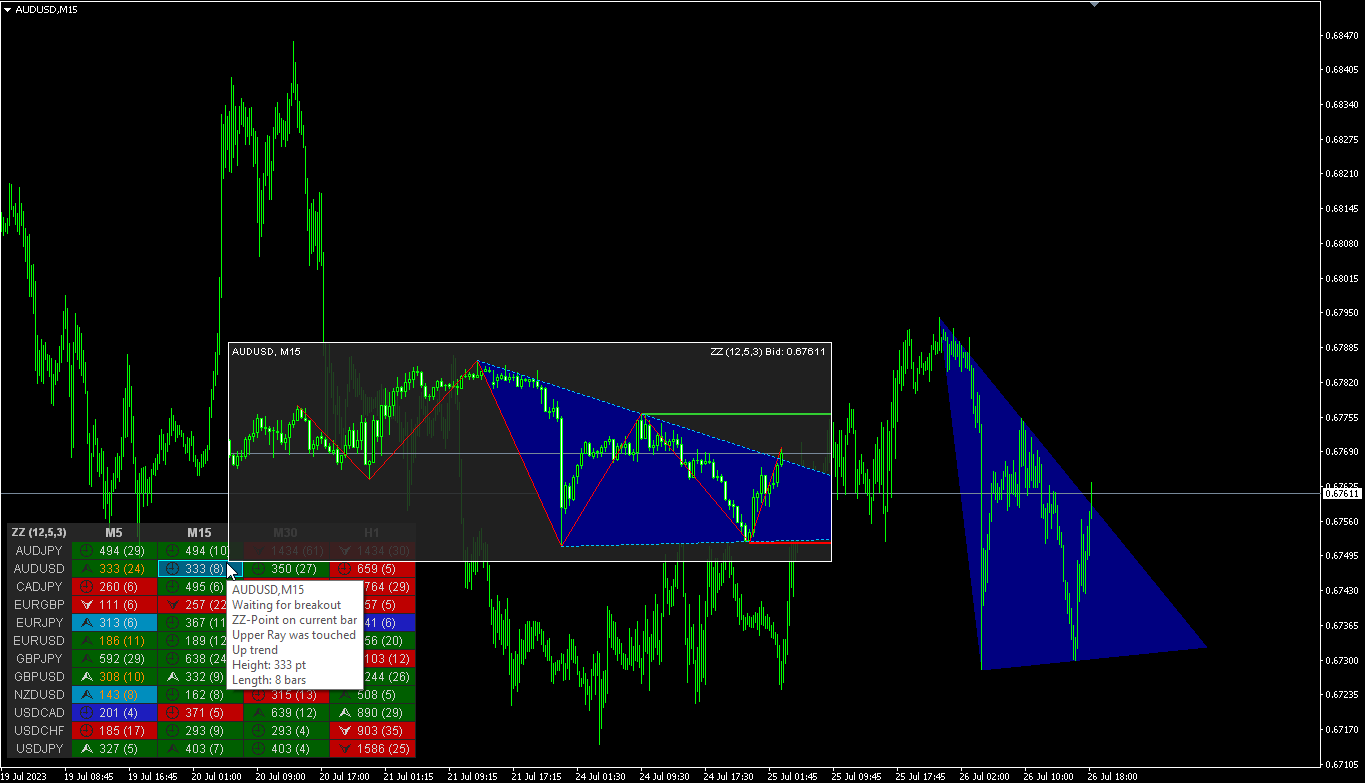
Puede especificar las monedas y plazos que desee en los parámetros. Además, el panel puede enviar notificaciones cuando el ZigZag cambia de dirección o cuando se produce un avance en el punto anterior. Al hacer clic en una celda con un punto, se abrirá este símbolo y punto.
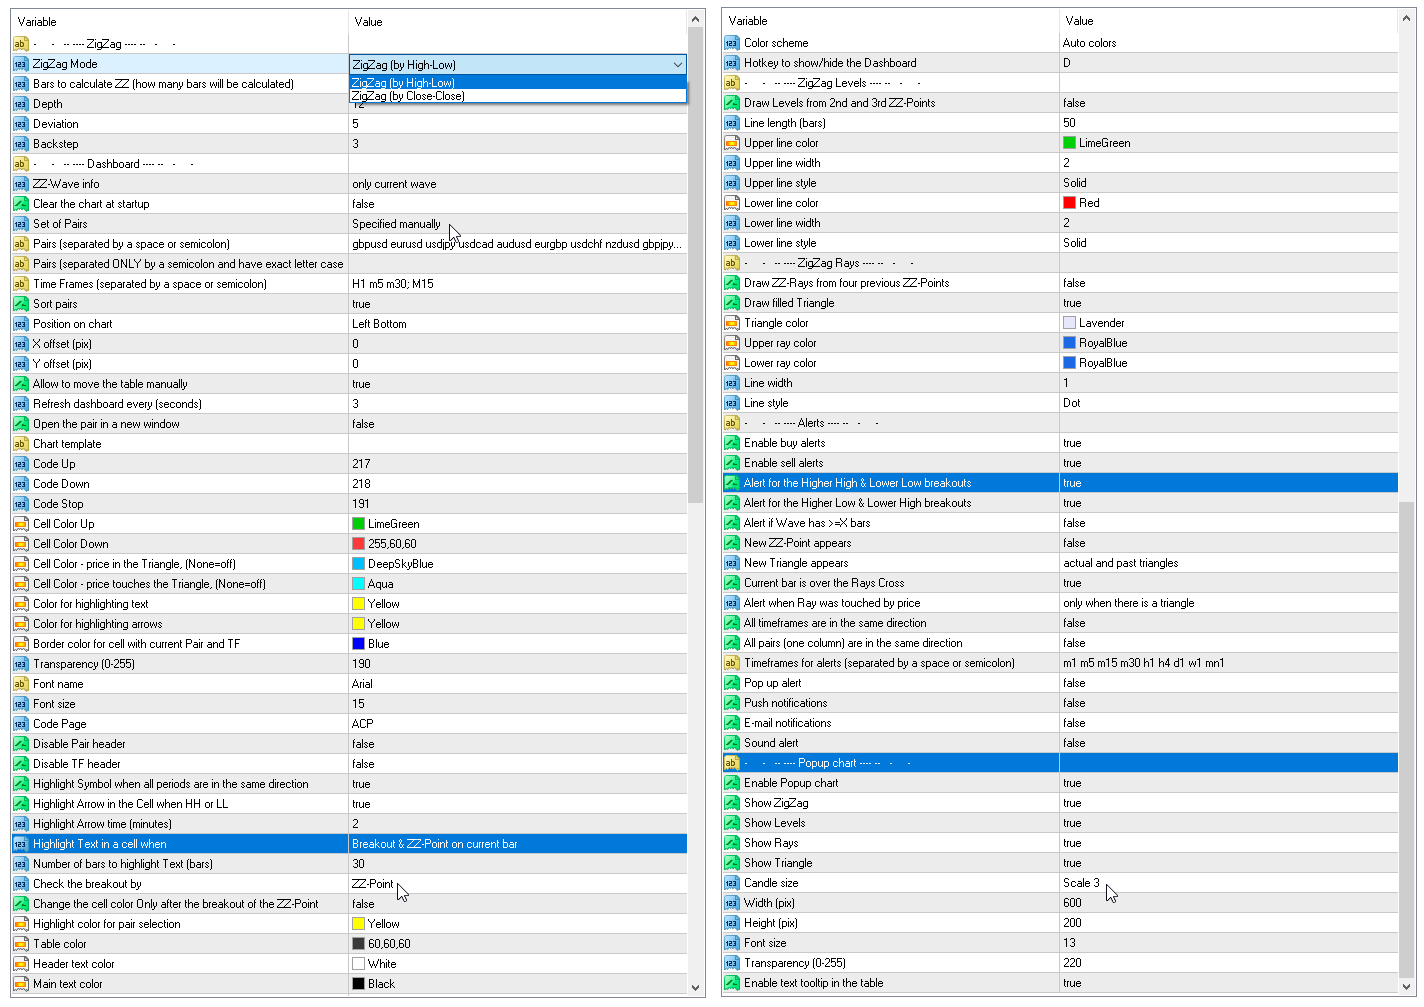
Parámetros
Depth — el número mínimo de velas para las cuales Zigzag no dibujará el segundo máximo (o mínimo), si la última tiene una Desviación menor (o mayor) que la anterior;
Deviation — el número mínimo de puntos entre los máximos y mínimos de dos velas adyacentes para que el Zigzag forme un máximo o mínimo local;
Backstep — el número mínimo de velas entre los máximos y mínimos locales;
Bars to calculate ZZ — el número de barras en el historial para encontrar puntos ZigZag;
ZZ-wave info — qué información sobre la onda se muestra en la tabla: solo la onda actual o la actual + la anterior;
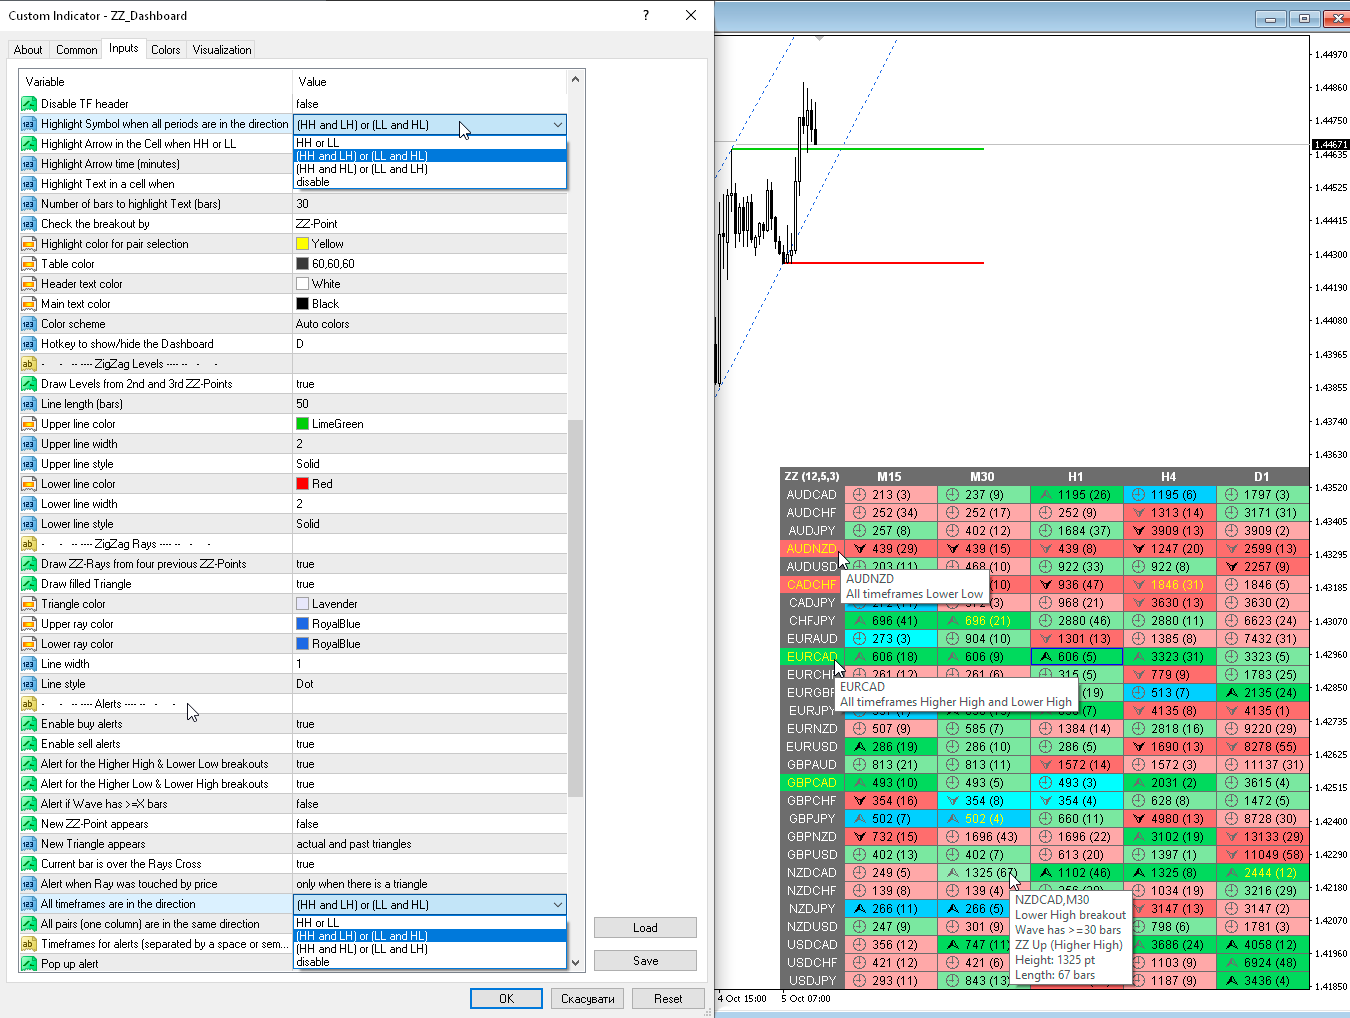
Highlight the symbol when all periods are in the same direction — Resalte el símbolo cuando todos los períodos estén en la misma dirección;
Symbol Highlight time (minutes, 0-all the time) — Tiempo de resaltado del símbolo (minutos, 0-todo el tiempo);
Highlight cells mode — Modo resaltar celdas
— Wave has >=X bars — resalte las celdas en las que el número de barras es mayor o igual a X;— Breakout & ZZ-pt on current bar — resalta las celdas cuando el punto ZigZag anterior está roto (el punto ZZ está en la barra actual);— ZZ-pt on current bar — resalta las celdas cuando aparece un punto ZZ en la barra actual. La ola nueva o cambiada;— Price touched ZZ-Ray — resalta las celdas cuando el precio toca el rayo ZigZag;— disable - deshabilita el resaltado de celdas;
Number of bars to highlight cells (bars) — cuántas barras debe haber en la onda ZigZag para resaltar la celda;
Clear the chart at startup — borre el gráfico al inicio.
Set of Pairs — conjunto de símbolos
— Market Watch — pares de "Market Watch". No utilice demasiados símbolos, esto puede hacer que el indicador se ralentice;— Specified manually — pares especificados manualmente, en los parámetros "Pares";— Current pair — par actual;
Pairs (separated by a space or semicolon) — lista de símbolos separados por espacios o punto y coma. Los nombres de las monedas deben escribirse exactamente igual que los del bróker, manteniendo las mayúsculas y minúsculas y el prefijo/sufijo.
Time Frames (separated by a space or semicolon) — lista de períodos de tiempo separados por espacios o punto y coma (marcos de tiempo múltiples).
Sort pairs — ordenar la lista de pares.
Position on chart — esquina para mostrar el panel en el gráfico.
X offset (pix) — desplaza el panel a lo largo del eje X;
Y offset (pix) — desplaza el panel a lo largo del eje Y;
Refresh dashboard every (seconds) — período de actualización para todos los pares y períodos de tiempo.
Open the pair in a new window — abra un símbolo en una nueva ventana del gráfico haciendo clic.
Chart template — el nombre de la plantilla del gráfico, si el gráfico se abre en una ventana nueva.
Color Up — color de la celda si el indicador aumenta.
Color Down — color de la celda si el indicador disminuye.
Color Highlight — color de resaltado del texto.
Transparency (0-255) — transparencia del panel.
Font name — Nombre de la fuente.
Font size — Tamaño de fuente.
Alertas
Timeframes for alerts (separated by a space or semicolon) — lista de períodos durante los cuales se enviará la alerta (separados por un espacio o punto y coma).
Alert if wave has >= X bars — alerta si la onda ZigZag tiene una cantidad de barras mayor o igual a X.
Alert for the Higher High & Lower Low breakouts — alerta si se rompe el HH o LL anterior.
Alert for the Higher Low & Lower High breakouts — alerta si se rompe el HL o LH anterior.
New ZZ-Point appears — alerta si aparece un nuevo punto ZigZag.
New Triangle appears — Aparece un nuevo triángulo.
Current bar is over the Rays Cross — La barra actual está sobre Rays Cross.
Alert when Ray was touched by price — Alerta cuando Ray se vio afectado por el precio.
All timeframes are in the same direction — Todos los plazos van en la misma dirección.
All pairs (one column) are in the same direction — Todos los pares (una columna) están en la misma dirección.
All timeframes are in the same direction — Todos los plazos están en la misma dirección: alerta cuando todos los plazos están en la misma dirección.
All pairs (one column) are in the same direction — Todos los pares (una columna) están en la misma dirección.
Pop up alert — Alerta emergente.
Push notifications — Notificaciones push.
E-mail notifications — Notificaciónes de Correo Electrónico.
Sound alert — Alerta sonora.


Найкращий розробник, з найкращими продуктами в маркеті