Delta EMA for MT4
- Indicadores
- Versión: 1.4
- Actualizado: 18 noviembre 2018
- Activaciones: 5

Ventajas
- Indica la fuerza del impulso
- Muestra los cambios de tendencia
- Proporciona señales de compra y venta
Características
- Alertas sonoras
- Alertas por correo electrónico
- Imprime datos en el terminal
- Parámetros ajustables
- Actualizaciones en tiempo real
- Accesible por EA externo
Variables de entrada
Periodos EMA: El número de barras de la media móvil exponencial delta. Este número determina el alfa o factor de suavizado de la media móvil.
Alerta sonora: Cuando está ajustado a verdadero, el indicador emite una alerta sonora cuando una barra de transición supera el valor de la variable de entrada "Umbral de señal", convirtiéndose en una barra de señal. La alerta suena la primera vez que la barra actual supera el valor del umbral, y suena cuando el cierre de una barra supera el valor del umbral.
Alerta por correo electrónico: Cuando se establece en un valor superior a cero, el indicador envía un correo electrónico, a la dirección especificada por el usuario en los ajustes de Metatrader (Herramientas\Opciones\Correo electrónico), cuando una barra de transición supera el valor de la variable de entrada "Umbral de señal". Establezca este valor en 2 para enviar una alerta por correo electrónico la primera vez que la barra actual supere el valor del umbral y cuando cierre por encima de dicho valor. Establezca este valor en 1 para enviar una alerta por correo electrónico sólo cuando una barra cierre por encima del valor umbral. Establezca este valor en 0 para desactivar las alertas por correo electrónico.
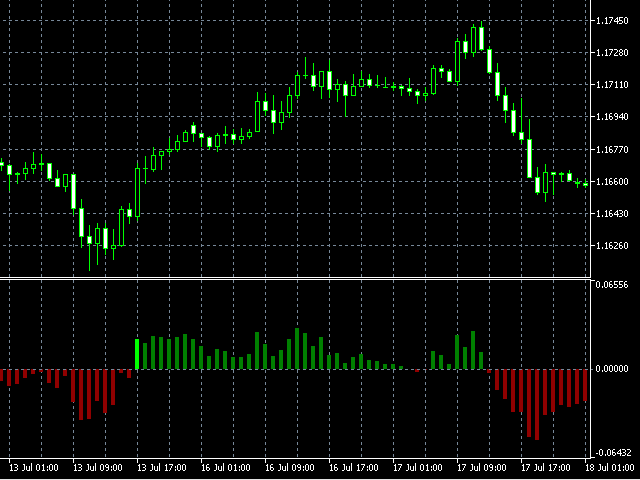
Los valores por defecto de "Periodos EMA" y "Umbral de señal" funcionan bien en el gráfico H1. Los valores más pequeños de "Umbral de señal" funcionan mejor en plazos más cortos, donde los cambios de una barra a la siguiente son menores, y los valores más grandes funcionan mejor en plazos más largos. Los valores óptimos se pueden encontrar utilizando la salida de Delta EMA como entrada a un Asesor Experto y ejecutando el EA en Probador de Estrategias. La EMA de delta para la barra actual aún no completada se actualiza en cada tick entrante y se muestra en la esquina superior izquierda de la ventana del indicador. Este valor, o el valor al cierre de cualquier barra anterior, puede ser accedido por un Asesor Experto externo llamando a la función iCustom(). El enlace a iCustom( ) proporciona un ejemplo de cómo hacerlo. El número del búfer del indicador al que se accede es 0 y debe pasarse a iCustom() como parámetro "mode". Ese buffer utiliza el orden de indexación inverso, por lo que el índice para el valor de la EMA de delta para la barra actual es 0, el índice para el valor al cierre de la barra precedente es 1, el índice para la barra anterior a esa es 2, y así sucesivamente. Ese índice debe pasarse a iCustom() como parámetro "shift".
El usuario no ha dejado ningún comentario para su valoración