• Información general
  • Comentarios (13)
  • Discusión (28)
  • Novedades

Visual Book on Chart

4.38

Visual Book on Chart is an indicator designed specially for stocks and futures market. To check if you can use the tool with your Broker open the MT5 Depth Of Market on your terminal and check if there are price and volume data available. Learn more about the MT5 Depth Of Market in the oficial page.

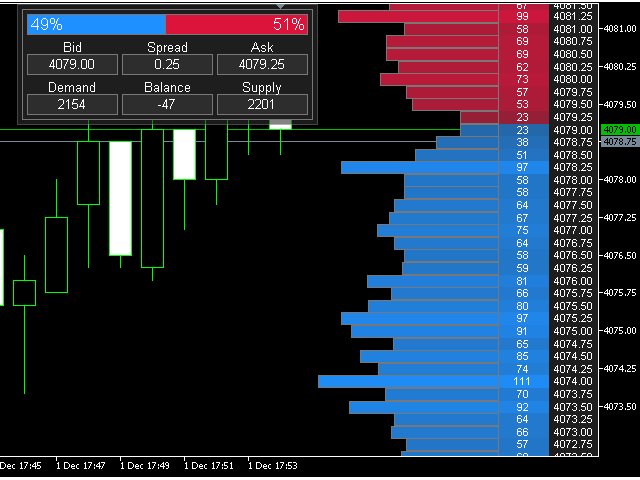
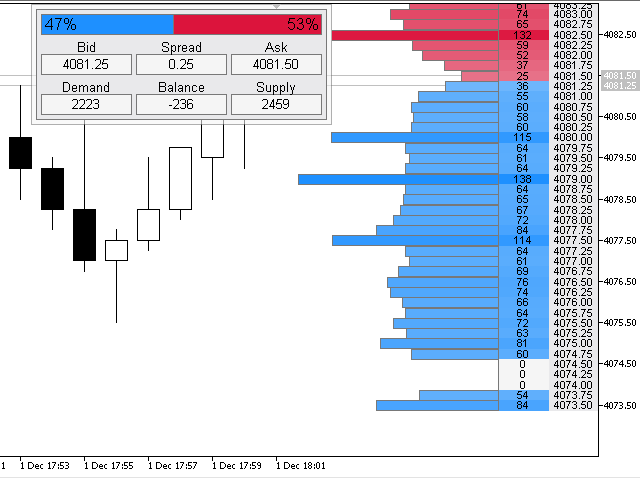
The indicator shows the depth of market data on the chart window and use gradient  based on the market data to colorize the histogram bars.

The indicator is formed by two components:

  1. The panel, which shows the supply, demand and balance of them, as well some market info;
  2. The histogram, which shows the book data in a custom way;

Option of the indicator:

  • Change the colors of the histogram
  • Select the symbol, being able to visualize the data of another symbol;
  • Display the volume as text in the histogram;
  • Align to left or right;
  • Show/Hide the panel;
  • Show/Hide the histogram;
  • Show/Hide the columns of the histogram;


    Comentarios 13
    anticancer
    84
    anticancer 2024.06.14 16:36 
     

    good, thanks

    galagreencapital
    25
    galagreencapital 2024.05.26 01:27 
     

    This indicator is pretty useful! Excellent

    Seth Tetteh
    1364
    Seth Tetteh 2024.04.25 11:39 
     

    great

    Productos recomendados
    Free automatic Fibonacci is an indicator that automatically plots a Fibonacci retracement based on the number of bars you select on the BarsToScan setting in the indicator. The Fibonacci is automatically updated in real time as new highest and lowest values appears amongst the selected bars. You can select which level values to be displayed in the indicator settings. You can also select the color of the levels thus enabling the trader to be able to attach the indicator several times with differe
    FREE
    Follow The Line MT5
    Oliver Gideon Amofa Appiah
    4.5 (28)
    This indicator obeys the popular maxim that: "THE TREND IS YOUR FRIEND" It paints a GREEN line for BUY and also paints a RED line for SELL. (you can change the colors). It gives alarms and alerts of all kinds. IT DOES NOT REPAINT and can be used for all currency pairs and timeframes. Yes, as easy and simple as that. Even a newbie can use it to make great and reliable trades. NB: For best results, get my other premium indicators for more powerful and reliable signals. Get them here: https://www.m
    FREE
    Tabajara V5
    Flavio Javier Jarabeck
    4.84 (32)
    Metatrader 5 version of the famous Andre Machado's Tabajara indicator. If you don't know Andre Machado's Technical Analysis work you don't need this indicator... For those who need it and for those several friend traders who asked this porting from other platforms, here it is... FEATURES 8-period Moving Average 20-period Moving Average 50-period Moving Average 200-period Moving Average Colored candles according to the inflexion of the 20-period MA SETTINGS You can change the Period of all M
    FREE
    Super Trend eu
    Emin Ulucanli
    4.75 (4)
    SUPERTREND; Es un indicador de seguimiento de tendencias basado en el SuperTrend ATR creado por Olivier Seban. Se puede utilizar para detectar cambios en la dirección de la tendencia y localizar paradas. Cuando el precio cae por debajo de la curva del indicador, se vuelve rojo e indica una tendencia bajista. Por el contrario, cuando el precio se mueve por encima de la curva, el indicador se vuelve verde, lo que indica una tendencia alcista. Al igual que otros indicadores, funciona bien en SuperT
    FREE
    Value Chart Candlesticks
    Flavio Javier Jarabeck
    4.75 (8)
    The idea of a Value Chart indicator was presented in the very good book I read back in 2020 , " Dynamic Trading Indicators: Winning with Value Charts and Price Action Profile ", from the authors Mark Helweg and David Stendahl. The idea is simple and the result is pure genius: Present candlestick Price analysis in a detrended way! HOW TO READ THIS INDICATOR Look for Overbought and Oversold levels. Of course, you will need to test the settings a lot to find the "correct" one for your approach.
    FREE
    LT Donchian Channel
    Thiago Duarte
    4.75 (4)
    Donchian Channel is an indicator created by Richard Donchian. It is formed by taking the highest high and the lowest low of the last specified period in candles. The area between high and low is the channel for the chosen period. Its configuration is simple. It is possible to have the average between the upper and lower lines, plus you have alerts when price hits one side. If you have any questions or find any bugs, please contact me. Enjoy!
    FREE
    Mitimom
    Danil Poletavkin
    The indicator is based on Robert Miner's methodology described in his book "High probability trading strategies" and displays signals along with momentum of 2 timeframes. A Stochastic oscillator is used as a momentum indicator. The settings speak for themselves period_1 is the current timeframe, 'current' period_2 is indicated - the senior timeframe is 4 or 5 times larger than the current one. For example, if the current one is 5 minutes, then the older one will be 20 minutes The rest of the
    FREE
    Coral Indi
    Dinh Duong Luong
    Coral trend is   a trend-following indicator that is widely popular among FOREX traders . It is usually used as a confluence with other indicators. It uses combinations of moving averages with complex smoothing formulas! It has two configurable parameters: Coefficient   - smoothing ratio (*) Applied price Calculation: Coral = (-0.064) * B6 + 0.672 * B5 - 2.352 * B4 + 2.744 * B3
    FREE
    What is this indicator? This indicator is the MACD (Moving Average Convergence/Divergence) supporting Virtual Trading mode of  Knots Compositor . When the mode is turned on, the indicator will be recalculated based on the displayed candlesticks. When the mode is turned off, the indicator will be recalculated based on the original chart candlesticks. Types of the applied price - Close - Open - High - Low - Median Price (HL/2) - Typical Price (HLC/3) - Weighted Price (HLCC/4) KC-Indicators
    FREE
    Cybertrade Keltner Channels
    Emanuel Andriato
    4.75 (4)
    Cybertrade Keltner Channels - MT5 Created by Chester Keltner, this is a volatility indicator used by technical analysis. It is possible to follow the trend of financial asset prices and generate support and resistance patterns. In addition, envelopes are a way of tracking volatility in order to identify opportunities to buy and sell these assets. It works on periods longer than the period visible on the chart. All values ​​are available in the form of buffers to simplify possible automations.
    FREE
    Supports And Resistances Lines
    Francisco Gomes Da Silva
    4.74 (34)
    Indicador de zonas de soporte y resistencia MT5 este indicador sabe cómo identificar techos y suelos automáticamente. Este indicador de soporte y resistencia crea líneas de soporte y líneas de resistencia basadas en máximos y mínimos. cómo hacer líneas de soporte y resistencia. este es un indicador para hacer líneas automáticas de soporte y resistencia. cómo encontrar el nivel de soporte con indicador. este indicador encuentra máximos y mínimos automáticamente. El indicador crea automáticamente
    FREE
    Are you tired of drawing trendlines every time you're analyzing charts? Or perhaps you would like more consistency in your technical analysis. Then this is for you. This indicator will draw trend lines automatically when dropped on a chart. How it works Works similar to standard deviation channel found on mt4 and mt5. It has 2 parameters: 1. Starting Bar 2. Number of bars for calculation The   starting bar   is the bar which drawing of the trend lines will begin, while the   number of bars for c
    FREE
    Forex Indicator Arrows
    NGUYEN NGHIEM DUY
    1 (1)
    Forex Indicator Arrows is an arrow Indicator used as an assistant tool for your trading strategy. The indicator analyzes the standard deviation of bar close for a given period and generates a buy or sell signals if the deviation increases. It good to combo with Martingale EA to follow Trend and Sellect Buy Only/Sell Only for EA work Semi-Automatic. You can use this  Indicator with any EAs in my Products.
    FREE
    Pivot Point Fibo RSJ es un indicador que rastrea las líneas de soporte y resistencia del día utilizando las tasas de Fibonacci. Este espectacular indicador crea hasta 7 niveles de soporte y resistencia a través del Pivot Point utilizando las tasas de Fibonacci. Es fantástico cómo los precios respetan cada nivel de este soporte y resistencia, donde es posible percibir posibles puntos de entrada / salida de una operación. Características Hasta 7 niveles de soporte y 7 niveles de resistencia
    FREE
    Rainbow MT5
    Jamal El Alama
    4 (1)
    Description : Rainbow MT5 is a technical indicator based on Moving Average with period 34 and very easy to use. When price crosses above MA and MA changes color to green, then this is a signal to buy. When price crosses below MA and MA changes color to red, then this is a signal to sell. The Expert advisor ( Rainbow EA MT5 ) based on Rainbow MT5 indicator is now available here . MT4 version is available here .
    FREE
    Price Retest MT5
    Suvashish Halder
    4.5 (2)
    Introducing our exciting new Price Retest indicator! Get instant alerts when the price retests, giving you a powerful edge in your trading strategy. Remember to do your own analysis before making any moves in the market. MT4 Version -  https://www.mql5.com/en/market/product/118031 Here’s a detailed explanation of how the Price Retest indicator works, its components, and how you can incorporate it into your trading strategy: The Price Retest indicator is designed to notify traders when the price
    FREE
    Note from Developer: This is the lite version of the Double TMA with Bands Indicator. I will be uploading a paid version that comes with alerts and on screen signal arrows built in. I will also be selling an EA based on this trading system once all backtesting and optimization have been completed. Unlock your trading potential with the Double TMA Indicator with Reversal Detection! Designed for swing and reversal trading, this versatile tool integrates two Triangular Moving Averages
    FREE
    MIDAS Super VWAP
    Flavio Javier Jarabeck
    4.44 (9)
    Imagine VWAP, MVWAP and MIDAS in one place... Well, you found it! Now you can track the movement of Big Players in various ways, as they in general pursue the benchmarks related to this measuring, gauging if they had good execution or poor execution on their orders. Traders and analysts use the VWAP to eliminate the noise that occurs throughout the day, so they can measure what prices buyers and sellers are really trading. VWAP gives traders insight into how a stock trades for that day and deter
    FREE
    El Capturador de Tendencias: La Estrategia del Capturador de Tendencias con Indicador de Alerta es una herramienta versátil de análisis técnico que ayuda a los traders a identificar las tendencias del mercado y los posibles puntos de entrada y salida. Presenta una Estrategia dinámica del Capturador de Tendencias, adaptándose a las condiciones del mercado para una clara representación visual de la dirección de la tendencia. Los traders pueden personalizar los parámetros para que se ajusten a s
    FREE
    La esencia del sistema consiste en la identificación del momento de formación de la vela compuesta "de vuelta" con características determinadas (tamaño de la vela en puntos, estructura de sombras).En el análisis de las velas japonesas el análogo de estas velas de vuelta son "Martillo" (Hammer) y "Hombre colgado" (Hanging Man), pero en este sistema el cuerpo de la vela no tiene que ser obligatoriamente pequeño, y la vela resultante se construye de varias velas. Parámetros de entrada del sistema:
    FREE
    Emperor
    Aleksandr Valutsa
    If necessary, please translate using an automatic translator. The description is offered only in the original language.. Робот конструктор может быть использован как с готовыми торговыми стратегиями, так и с целью создания своих стратегий. Мониторинг Все наши сигналы имя или описания которых содержат название советника "Emperor":  https://www.mql5.com/ru/users/robotstroi/seller Начинающий трейдер Пошаговые действия для быстрого старта: Настроить терминал с добавлением необходимых URL адресов
    MACD Intraday Trend es un indicador desarrollado a través de una adaptación del MACD original creado por Gerald Appel en la década de 1960. A lo largo de años de negociación, se observó que al cambiar los parámetros del MACD con proporciones de Fibonacci logramos una mejor presentación de la continuidad de los movimientos de la tendencia, haciendo que sea posible detectar de manera más eficiente el inicio y el final de una tendencia de precios. Debido a su eficiencia en la detección de tend
    FREE
    Money Flow Index EA Friendly
    Flavio Javier Jarabeck
    3.5 (2)
    The traditional Money Flow Index indicator, this time, EA friendly . There are 3 buffers exposed that can be used by EAs to automatically analyze the Overbought and Oversold conditions of the quote. Just use the traditional iCustom() function to get these signals. This Money Flow Index calculation is based on the traditional Metaquote's MFI indicator. SETTINGS MFI Period Volume type to analyze (Real Volume or Ticks) Starting Overbought region Starting Oversold region USING WITH EAs Buffer
    FREE
    Bar Color Trend
    Germano Chagas
    4.5 (6)
    Combining the best of Price Action , Directional Movement , and Divergence/Convergence analysis, Candle Color Trend is a easy and reliable way to identify trend direction. The indicator automatically paints the candles according to the assumption that an uptrend is defined by prices that form a series of higher highs and higher lows. In contrast, a downtrend is defined by prices that form a series of lower highs and lower lows. Additionally, ADX Wilder indicator is used to measure trend weakness
    FREE
    Spike Catch Pro
    Amani Fungo
    4 (6)
    Spike Catch Pro 22:03 release updates Advanced engine for searching trade entries in all Boom and Crash pairs (300,500 and 1000) Programmed strategies improvements Mx_Spikes (to combine Mxd,Mxc and Mxe), Tx_Spikes,   RegularSpikes,   Litho_System,   Dx_System,   Md_System,   MaCross,   Omx_Entry(OP),  Atx1_Spikes(OP),   Oxc_Retracement (AT),M_PullBack(AT) we have added an arrow on strategy identification, this will help also in the visual manual backtesting of the included strategies and see h
    FREE
    Donchian Pro
    Paulo Henrique Faquineli Garcia
    5 (2)
    The Donchian Channel Channels are among the most popular tools of technical analysis, as they visually convey to the analyst the limits within which most price movement tends to occur. Channel users know that valuable information can be obtained at any time, whether prices are in the central region of a band or close to one of the border lines. One of the best known techniques to explore these concepts is Bollinger Bands. However, John Bollinger was not the only one to research the applicatio
    FREE
    RSI with alerts BDA
    Laron Demetris Burrows
    4.93 (14)
    Este algoritmo predice cambios a corto plazo en el precio con una precisión del 86%*. Cuando hay un movimiento grande determinado por el ATR, durante una condición de sobrecompra o sobreventa, el indicador lo alertará. Predice si el precio será más alto o más bajo que la vela de señal. Perfecto para el comercio de reversión de media, opciones binarias o contratos de futuros en marcos de tiempo más grandes. El indicador se probó en 5 años de datos y tiene una precisión del 90% para predecir reve
    FREE
    This indicator is a zero-lag indicator and displays  strength of trend change . True Trend  Oscillator Pro works best in combination with True Trend Moving Average Pro that displays exact trend as is. Oscillator value is exact price change in given direction of the trend. True Trend Moving Average Pro: https://www.mql5.com/en/market/product/103586 If you set PERIOD input parameter to 1 this indicator becomes a sharpshooter for binary options. Developers can use True Trend Oscillator in E
    FREE
    Show Pips for MT5
    Roman Podpora
    4.63 (19)
    Este indicador de información será útil para quienes quieran estar siempre al tanto de la situación actual de la cuenta. -   Indicadores más útiles El indicador muestra datos como ganancias en puntos, porcentaje y moneda, así como el diferencial del par actual y el tiempo hasta que la barra se cierra en el período de tiempo actual. Hay varias opciones para colocar la línea de información en el gráfico: A la derecha del precio (corre detrás del precio); Como comentario (en la esquina superior
    FREE
    Best SAR MT5
    Ashkan Hazegh Nikrou
    5 (1)
    Descripción :  nos complace presentar nuestro nuevo indicador gratuito basado en uno de los indicadores profesionales y populares en el mercado de divisas (PSAR). Este indicador es una nueva modificación del indicador Parabolic SAR original. En el indicador pro SAR puede ver el cruce entre puntos y el gráfico de precios. el cruce no es una señal, pero habla sobre el final del potencial de movimiento, puede comenzar a comprar con un nuevo punto azul y colocar un límite de pérdidas un atr antes
    FREE
    Los compradores de este producto también adquieren
    TPSproTREND PrO MT5
    Roman Podpora
    4.89 (9)
    TPSpro TREND PRO  - is a trend indicator that automatically analyzes the market and provides information about the trend and each of its changes, as well as giving signals for entering trades without redrawing! The indicator uses each candle, analyzing them separately. referring to different impulses - up or down impulse. Exact entry points into transactions for currencies, crypto, metals, stocks, indices!  Version MT4               DETAILED DESCRIPTION               R ecommended to use with an
    Atomic Analyst MT5
    Issam Kassas
    4.56 (18)
    En primer lugar, vale la pena enfatizar que este Indicador de Trading no repinta, no redibuja y no se retrasa, lo que lo hace ideal tanto para el trading manual como para el automatizado. Manual del usuario: configuraciones, entradas y estrategia. El Analista Atómico es un Indicador de Acción del Precio PA que utiliza la fuerza y el impulso del precio para encontrar una mejor ventaja en el mercado. Equipado con filtros avanzados que ayudan a eliminar ruidos y señales falsas, y aumentan el poten
    TPSpro RFI Levels MT5
    Roman Podpora
    4.7 (10)
    反转第一脉冲水平 (RFI)     指示     俄羅斯     -        ESP   Recomendamos utilizar con   el indicador -   TPSpro 趋势专业版 -   MT5版本 Un elemento clave importante en el comercio son las zonas o niveles a partir de los cuales se toman decisiones para comprar o vender un instrumento comercial. A pesar de los intentos de los grandes actores de ocultar su presencia en el mercado, inevitablemente dejan rastros. Nuestra tarea era aprender a encontrar estos rastros e interpretarlos correctamente. Funciones principales:
    Atbot
    Zaha Feiz
    4.97 (34)
    AtBot: Cómo funciona y cómo usarlo ### Cómo funciona El indicador "AtBot" para la plataforma MT5 genera señales de compra y venta utilizando una combinación de herramientas de análisis técnico. Integra la Media Móvil Simple (SMA), la Media Móvil Exponencial (EMA) y el índice de Rango Verdadero Promedio (ATR) para identificar oportunidades de trading. Además, puede utilizar velas Heikin Ashi para mejorar la precisión de las señales. Deja una reseña después de la compra y recibe un regalo especia
    Gold Stuff mt5
    Vasiliy Strukov
    4.92 (163)
    Gold Stuff mt5: un indicador de tendencia diseñado específicamente para el oro, también se puede usar en cualquier instrumento financiero. El indicador no se vuelve a dibujar ni se retrasa. El marco de tiempo recomendado es H1. IMPORTANTE! Póngase en contacto conmigo inmediatamente después de la compra para obtener instrucciones y bonificación!   Puede obtener una copia gratuita de nuestro indicador Strong Support y Trend Scanner, por favor envíe un mensaje privado. ¡a mí! PARÁMETROS Draw
    Primero que todo, vale la pena enfatizar que este Sistema de Trading es un Indicador No Repintado, No Redibujado y No Retrasado, lo que lo hace ideal tanto para el trading manual como para el automatizado. Curso en línea, manual y descarga de ajustes preestablecidos. El "Sistema de Trading Inteligente MT5" es una solución completa de trading diseñada para traders nuevos y experimentados. Combina más de 10 indicadores premium y presenta más de 7 estrategias de trading robustas, lo que lo convie
    Quantum Trend Sniper
    Bogdan Ion Puscasu
    4.79 (48)
    Introduciendo       Indicador Quantum Trend Sniper   , el innovador indicador MQL5 que está transformando la forma en que identificas y negocias los cambios de tendencia. Desarrollado por un equipo de comerciantes experimentados con experiencia comercial de más de 13 años,       Indicador de francotirador de tendencia cuántica       está diseñado para impulsar su viaje comercial a nuevas alturas con su forma innovadora de identificar cambios de tendencia con una precisión extremadamente alta.
    Trend Screener Pro MT5
    STE S.S.COMPANY
    4.87 (62)
    Desbloquee el poder del comercio de tendencias con el indicador Trend Screener: ¡su solución definitiva para el comercio de tendencias impulsada por lógica difusa y un sistema multidivisa!Mejore su comercio de tendencias con Trend Screener, el revolucionario indicador de tendencias impulsado por lógica difusa. Es un poderoso indicador de seguimiento de tendencias que combina más de 13 herramientas y funciones premium y 3 estrategias comerciales, lo que lo convierte en una opción versátil para co
    FX Power MT5 NG
    Daniel Stein
    5 (5)
    Obtenga su actualización diaria del mercado con detalles y capturas de pantalla a través de nuestro Morning Briefing aquí en mql5 y en Telegram ! FX Power MT5 NG es la nueva generación de nuestro popular medidor de fuerza de divisas, FX Power. ¿Y qué ofrece este medidor de fuerza de nueva generación? Todo lo que le encantaba del FX Power original PLUS Análisis de fuerza de ORO/XAU Resultados de cálculo aún más precisos Períodos de análisis configurables individualmente Límite de cálculo persona
    Este es un genial indicador para MT5 que ofrece señales precisas para entrar en una transacción sin redibujar. Se puede aplicar a cualquier activo financiero: fórex, criptomonedas, metales, acciones, índices. Nos dará valoraciones bastante precisas y nos dirá cuándo es mejor abrir y cerra una transacción. Eche un vistazo  al vídeo  (6:22), ¡contiene un ejemplo de procesamiento de una sola señal que ha amortizado el indicador! La mayoría de los tráders mejoran sus resultados comerciales durante l
    FX Volume MT5
    Daniel Stein
    4.93 (14)
    Obtenga su actualización diaria del mercado con detalles y capturas de pantalla a través de nuestro Morning Briefing aquí en mql5 y en Telegram ! FX Volume es el PRIMER y ÚNICO indicador de volumen que proporciona una visión REAL del sentimiento del mercado desde el punto de vista de un bróker. Proporciona una visión impresionante de cómo los participantes institucionales del mercado, como los brokers, están posicionados en el mercado Forex, mucho más rápido que los informes COT. Ver esta info
    IX Power MT5
    Daniel Stein
    4.17 (6)
    IX Power   lleva por fin la insuperable precisión de FX Power a los símbolos que no son de Forex. Determina con exactitud la intensidad de las tendencias a corto, medio y largo plazo de tus índices, acciones, materias primas, ETF e incluso criptodivisas favoritas. Puede   analizar todo lo   que su terminal le ofrece. Pruébalo y experimenta cómo   tu timing mejora significativamente   a la hora de operar. Características principales de IX Power Resultados de cálculo 100% precisos y sin rep
    Black Dragon indicator mt5
    Ramil Minniakhmetov
    4.81 (53)
    El indicador de detección de tendencias complementará cualquier estrategia y también se puede utilizar como una herramienta independiente. Ventajas Fácil de usar, no sobrecarga el gráfico con información innecesaria; Puede usarse como filtro para cualquier estrategia; Tiene niveles integrados de soporte y resistencia dinámicos, que se pueden usar tanto para obtener ganancias como para establecer límites de pérdidas; El indicador no cambia de color después de que se cierra la vela;  Funciona
    ATrend
    Zaha Feiz
    4.75 (4)
    ATREND: Cómo Funciona y Cómo Usarlo #### Cómo Funciona El indicador "ATREND" para la plataforma MT5 está diseñado para proporcionar a los traders señales de compra y venta robustas mediante una combinación de metodologías de análisis técnico. Este indicador utiliza principalmente el Rango Verdadero Promedio (ATR) para medir la volatilidad, junto con algoritmos de detección de tendencias para identificar posibles movimientos del mercado. Deja un mensaje después de la compra y recibe un regalo es
    Advanced Supply Demand MT5
    Bernhard Schweigert
    4.5 (14)
    ¡Actualmente con 33% de descuento! ¡La mejor solución para cualquier tráder principiante o experto! Este indicador es una herramienta comercial única, de alta calidad y asequible, porque incorpora una serie de características patentadas y una nueva fórmula. Con esta actualización, podrá mostrar zonas de doble marco temporal. No solo podrá mostrar un marco temporal más alto, sino también mostrar ambos, el marco temporal del gráfico MÁS el marco temporal más alto: MOSTRANDO ZONAS ANIDADAS. A todos
    ** All Symbols x All Timeframes scan just by pressing scanner button ** *** Contact me  to send you instruction and add you in "123 scanner group" for sharing or seeing experiences with other users. After 17 years of experience in the markets and programming, Winner indicator is ready. I would like to share with you! Introduction The 123 Pattern Scanner indicator with a special enhanced algorithm is a very repetitive common pattern finder with a high success rate . Interestingly, this Winner in
    Auto Order Block with break of structure based on ICT and Smart Money Concepts (SMC) Futures Break of Structure ( BoS )             Order block ( OB )            Higher time frame Order block / Point of Interest ( POI )    shown on current chart           Fair value Gap ( FVG ) / Imbalance   -  MTF      ( Multi Time Frame )    HH/LL/HL/LH  -  MTF      ( Multi Time Frame )  Choch  MTF      ( Multi Time Frame )  Volume Imbalance     ,  MTF          vIMB Gap’s Power of 3 Equal High
    ICT, SMC, SMART MONEY CONCEPTS, SMART MONEY, Smart Money Concept, Support and Resistance, Trend Analysis, Price Action, Market Structure, Order Blocks, BOS/CHoCH,   Breaker Blocks ,  Momentum Shift,   Supply&Demand Zone/Order Blocks , Strong Imbalance,   HH/LL/HL/LH,    Fair Value Gap, FVG,  Premium  &   Discount   Zones, Fibonacci Retracement, OTE, Buy Side Liquidity, Sell Side Liquidity, BSL/SSL Taken, Equal Highs & Lows, MTF Dashboard, Multiple Time Frame, BigBar, HTF OB, HTF Market Structure
    FxaccurateLS
    Shiv Raj Kumawat
    WHY IS OUR FXACCCURATE LS MT5 THE PROFITABLE ? PROTECT YOUR CAPITAL WITH RISK MANAGEMENT Gives entry, stop and target levels from time to time. It finds Trading opportunities by analyzing what the price is doing during established trends. POWERFUL INDICATOR FOR A RELIABLE STRATEGIES We have made these indicators with a lot of years of hard work. It is made at a very advanced level. Established trends provide dozens of trading opportunities, but most trend indicators completely ignore them!
    Matrix Arrow Indicator MT5
    Juvenille Emperor Limited
    5 (12)
    Matrix Arrow Indicator MT5   es una tendencia única 10 en 1 que sigue un indicador   100% sin repintado   de marcos temporales múltiples que se puede usar en todos los símbolos/instrumentos:   divisas ,   materias primas ,   criptomonedas ,   índices ,   acciones .  Matrix Arrow Indicator MT5  determinará la tendencia actual en sus primeras etapas, recopilando información y datos de hasta 10 indicadores estándar, que son: Índice de movimiento direccional promedio (ADX) Índice de canales de prod
    Ahora $ 147 (aumentando a $ 499 después de algunas actualizaciones) - Cuentas ilimitadas (PC o Mac) Manual de usuario de RelicusRoad + Videos de capacitación + Acceso al grupo privado de Discord + Estado VIP UNA NUEVA MANERA DE VER EL MERCADO RelicusRoad es el indicador comercial más poderoso del mundo para divisas, futuros, criptomonedas, acciones e índices, y brinda a los comerciantes toda la información y las herramientas que necesitan para mantenerse rentables. Brindamos análisis téc
    Was: $249  Now: $99   Market Profile defines a number of day types that can help the trader to determine market behaviour. A key feature is the Value Area, representing the range of price action where 70% of trading took place. Understanding the Value Area can give traders valuable insight into market direction and establish the higher odds trade. It is an excellent addition to any system you may be using. Inspired by Jim Dalton’s book “Mind Over Markets”, this indicator is designed to suit the
    Este tablero muestra los últimos   patrones armónicos   disponibles para los símbolos seleccionados, por lo que ahorrará tiempo y será más eficiente /   versión MT4 . Indicador gratuito:   Basic Harmonic Pattern Columnas del indicador Symbol:   aparecerán los símbolos seleccionados Trend :   alcista o bajista Pattern :   tipo de patrón (gartley, mariposa, murciélago, cangrejo, tiburón, cifrado o ABCD) Entry :   precio de entrada SL:   precio de stop loss TP1:   1er precio de toma de benefici
    AW Trend Predictor MT5
    AW Trading Software Limited
    4.75 (51)
    La combinación de niveles de tendencia y ruptura en un sistema. Un algoritmo de indicador avanzado filtra el ruido del mercado, determina la tendencia, los puntos de entrada y los posibles niveles de salida. Las señales indicadoras se registran en un módulo estadístico, que le permite seleccionar las herramientas más adecuadas, mostrando la efectividad del historial de señales. El indicador calcula las marcas Take Profit y Stop Loss. Manual e instrucciones ->   AQUÍ   / Versión MT4 ->   AQUÍ Có
    Conviértase en un Breaker Trader y obtenga beneficios de los cambios en la estructura del mercado a medida que se invierte el precio. El indicador de ruptura de bloque de órdenes identifica cuándo una tendencia o movimiento de precio se acerca al agotamiento y está listo para revertirse. Le alerta sobre cambios en la estructura del mercado que generalmente ocurren cuando una reversión o un retroceso importante están a punto de suceder. El indicador utiliza un cálculo patentado que identific
    Ante todo, vale la pena enfatizar que esta Herramienta de Trading es un Indicador No Repintado, No Redibujado y No Retrasado, lo que la hace ideal para el trading profesional. Curso en línea, manual del usuario y demostración. El Indicador de Conceptos de Acción del Precio Inteligente es una herramienta muy potente tanto para traders nuevos como experimentados. Combina más de 20 indicadores útiles en uno solo, combinando ideas avanzadas de trading como el Análisis del Trader del Círculo Inte
    TPA True Price Action indicator reveals the true price action of the market makers through 100% non-repainting signals strictly at the close of a candle! TPA shows entries and re-entries, every time the bulls are definitely stronger than the bears and vice versa. Not to confuse with red/green candles. The shift of power gets confirmed at the earliest stage and is ONE exit strategy of several. There are available now two free parts of the TPA User Guide for our customers. The first "The Basics"
    Difícil de encontrar y escasa en frecuencia, las divergencias son uno de los escenarios comerciales más confiables. Este indicador busca y escanea las divergencias regulares y ocultas automáticamente usando su oscilador favorito. [ Guía de instalación | Guía de actualización | Solución de problemas | FAQ | Todos los productos ] Fácil de comerciar Encuentra divergencias regulares y ocultas Admite muchos osciladores bien conocidos Implementa señales comerciales basadas en rupturas Muestra n
    Easy By Sell is a market indicator for opening and closing positions. It becomes easy to track market entries with alerts. It indicates trend reversal points when a price reaches extreme values ​​and the most favorable time to enter the market. it is as effective as a Fibonacci to find a level but it uses different tools such as an algorithm based on ATR indicators and Stochastic Oscillator. You can modify these two parameters as you wish to adapt the settings to the desired period. My othe
    Volume Order Blocks MT5
    Suvashish Halder
    5 (6)
    Introducing the Volume Order Blocks indicator, a game-changing tool designed for traders who demand precision and clarity in their market analysis. This advanced indicator not only identifies order blocks but also integrates crucial volumetric data, allowing you to gauge the strength of these blocks with unparalleled accuracy. MT4 version -  https://www.mql5.com/en/market/product/121237/ Key Features of the Volume Order Blocks: Bullish & Bearish Order Blocks: Easily visualize and differentiat
    Otros productos de este autor
    Market Structure Patterns
    Samuel Manoel De Souza
    4.67 (18)
    Market Structure Patterns   is an indicator based on   smart money concepts   that displays   SMC/ICT   elements that can take your trading decisions to the next level. Take advantage of the   alerts ,   push notifications   and   email messages   to keep informed from when an element is formed on the chart, the price crosses a level and/or enters in a box/zone. Developers can access the values of the elements of the indicator using the   global variables  what allows the automation of trading
    Market Structure Patterns MT4
    Samuel Manoel De Souza
    5 (17)
    Market Structure Patterns   is an indicator based on   smart money concepts   that displays   SMC/ICT   elements that can take your trading decisions to the next level. Take advantage of the   alerts ,   push notifications   and   email messages   to keep informed from when an element is formed on the chart, the price crosses a level and/or enters in a box/zone. Developers can access the values of the elements of the indicator using the   global variables  what allows the automation of trading
    VWAP Tools
    Samuel Manoel De Souza
    VWAP Tools features Daily VWAP , Weekly VWAP , Monthly VWAP , Anchored VWAP , VWAP by session and Drawing Panel to add, remove and change properties of multiple anchored VWAPs in a single indicator. With the panel of VWAP Tools you can: Draw VWAPs with a specific time interval or extend the VWAPs to the current bar time Change the properties of each VWAP individually Select a VWAP by clicking over it Delesect a VWAP by clicking anywhere on the chart Use any VWAP already drawn on the chart to dra
    FREE
    Tabajara Rules II The Best for MT5
    Samuel Manoel De Souza
    4.86 (7)
    Tabajara Rules for MT5 , baseado em Setup Tabajara do professor André Machado, indica a direção do mercado com base em médias móveis quando tem velas na mesma direção da média móvel. O indicador contém a regra de coloração aplicada aos candles e a média móvel. O indicador permite a alteração dos parâmetros: período e método de suavização da média móvel. O indicador permite a alteração das cores dos candles ( contornos e preenchimento) e da média móvel. O modelo do professor André Machado c
    FREE
    Bollinger Clouds
    Samuel Manoel De Souza
    The Indicator indicator draws 2 clouds based on Bollinger Bands indicator values. The upper cloud is formed by the upper lines values and the lower cloud by the lowers lines values. The indicator allows to change the Bollinger Bands parameters and the clouds colors the period of the base line and the deviations of each Bollinger Bands instance. The indicator holds 5 buffer index as follow: [0] - Outer values of the upper cloud [1]  - Inner values of the upper cloud [2]  - Base/Center line values
    FREE
    Donchian Clouds
    Samuel Manoel De Souza
    The Indicator indicator draws 2 clouds based on Donchian Channels indicator values. The upper cloud is formed by the upper lines values and the lower cloud by the lowers lines values. The indicator allows to change the Channels parameters and the clouds colors the period of the base line and the multiplier of each Donchian Channels instance. The indicator holds 5 buffer index as follow: [0] - Outer values of the upper cloud [1]  - Inner values of the upper cloud [2]  - Base/Center line values [3
    FREE
    Envelopes Clouds
    Samuel Manoel De Souza
    The Indicator indicator draws 2 clouds based on Envelopes indicator values. The upper cloud is formed by the upper lines values and the lower cloud by the lowers lines values. The indicator allows to change the Envelopes parameters and the clouds colors the period of the base line and the deviations of each Envelopes instance. The indicator holds 5 buffer index as follow: [0] - Outer values of the upper cloud [1]  - Inner values of the upper cloud [2]  - Base/Center line values [3]  - Inner valu
    FREE
    Keltner Clouds
    Samuel Manoel De Souza
    The Indicator indicator draws 2 clouds based on Keltner indicator values. The upper cloud is formed by the upper lines values and the lower cloud by the lowers lines values. The indicator allows to change the Keltner parameters and the clouds colors the period of the base line and the deviations of each Keltner instance. The indicator holds 5 buffer index as follow: [0] - Outer values of the upper cloud [1]  - Inner values of the upper cloud [2]  - Base/Center line values [3]  - Inner values of
    FREE
    Filtro:
    Paul Cole
    43
    Paul Cole 2024.07.10 11:59 
     

    It did not work

    anticancer
    84
    anticancer 2024.06.14 16:36 
     

    good, thanks

    leandro fruhauf
    205
    leandro fruhauf 2024.05.26 16:53 
     

    El usuario no ha dejado ningún comentario para su valoración

    galagreencapital
    25
    galagreencapital 2024.05.26 01:27 
     

    This indicator is pretty useful! Excellent

    Seth Tetteh
    1364
    Seth Tetteh 2024.04.25 11:39 
     

    great

    Gloria Sarpong
    779
    Gloria Sarpong 2024.04.08 02:50 
     

    nice indicator

    traderspeed
    318
    traderspeed 2024.03.05 14:10 
     

    Excelente indicador, obrigado pela sua generosidade de deixa-lo gratuito, por isso quero sugerir uma inovação, fazer com que o indicador analise os 10 preços que estão mais próximos do preço negociado naquele instante, os 5 de compra e os 5 de venda e os que term um maior valome narcalos com uma cor mais escura que sua cor original, porque fazer isto, pq sugundo meus estudos, estes 5 primeiros preços de cada lado indluencia de maneira muito intensa a direção do movimento. Quero deixar aqui minha admiração pelo seu trabalho.

    gnanos123
    645
    gnanos123 2024.02.10 13:34 
     

    OK Indicator

    marcelo spindola
    26
    marcelo spindola 2023.06.09 14:33 
     

    gsotaria de um suporte instalei o visual book aparece o painel onde fica a barra mostarndo a porcetagem porem o hsitograma no grafico não está aparecendo

    Samuel Manoel De Souza
    27012
    Respuesta del desarrollador Samuel Manoel De Souza 2023.06.09 14:40
    Olá. O recurso trabalha com dados de profundidade de mercado. Para isso a corretora precisa fornecer esse dados, tanto do preço quanto do volume das ordens. Você pode verificar isso abrindo o DOM do MT5.
    https://www.metatrader5.com/en/terminal/help/trading/depth_of_market
    epadilha
    609
    epadilha 2022.07.25 16:11 
     

    El usuario no ha dejado ningún comentario para su valoración

    Samuel Manoel De Souza
    27012
    Respuesta del desarrollador Samuel Manoel De Souza 2022.07.25 17:24
    Obrigado, pelo comentário.
    Sergio Henrique
    81
    Sergio Henrique 2019.11.28 20:04 
     

    El usuario no ha dejado ningún comentario para su valoración

    Paulo Moraes
    261
    Paulo Moraes 2019.08.30 00:56 
     

    Excellent tool and great programmer.

    Julio Cesar Schlickmann
    214
    Julio Cesar Schlickmann 2018.10.15 22:46 
     

    Bom indicador...

    Porem está alterando as cores dos Candles...

    Respuesta al comentario
    Versión 2.41 2022.12.08
    Removed some comments on the chart.
    Versión 2.40 2022.12.01
    Histogram texts updates: Now is possible to change the font size and the scale adjusts itself to avoid overlapping.
    Updates to number of levels on the book to avoid scale distortions in S&P 500.
    Changes on the parameters.
    Removed the text with the name of the program from the panel.
    Versión 2.3 2020.08.13
    Correção de erro de execução.
    Versión 2.2 2019.09.02
    *Bull and Bear color options
    Versión 2.1 2019.08.28
    *Running in the background;
    Versión 2.0 2019.08.26
    *Performance improvement for high volatility
    *New customization options:
    -Compact Panel;
    -Histogram on Left or Right;
    -Histogram as window, with custom window height;
    -Custom color grading factor;
    -Show or hide volume on histogram;
    -Show or hide price on histogram;
    Versión 1.90 2019.01.08
    * Reduction of the overlay area allowing interaction with other objects.
    Versión 1.80 2018.12.27
    *Options to execution time optimization.
    Versión 1.70 2018.10.31
    *Correção de erro.
    Versión 1.60 2018.10.29
    * Error correction (changing the color of the candles)
    * Option to show / hide the histogram and / or panel;
    * Option to draw the indicator in the background;
    * Implementation of rendered control;
    * Implementation of transparent control;
    * Alteration of the panel design;
    * Alteration of the histogram design;
    * Protection against destroying objects;
    Versión 1.50 2018.10.17
    *Recompilação do código;
    Versión 1.40 2018.09.08
    *Update Color Scheme.
    Versión 1.30 2018.09.07
    * Correction of grouping of controls;
    * Implementation of black / white color scheme;
    Versión 1.20 2018.09.06
    * Implementation of panel showing market pressure;
    * Implementation of color gradient in the histogram highlighting larger volumes;
    Versión 1.10 2018.09.02
    Removed unnecessary parameter entries.