• Información general
  • Comentarios (1)
  • Discusión (2)
  • Novedades

RedYGreem

2

  •  InpRSIshort=13; // RSI short
  •  InpRSIPeriod=34; // RSI long
  •  PeriodRs=0; //Price 0C 4HL/2 5HLC/3 
  •  mafast=13;//mafast
  •  maslow=65;//MAslow


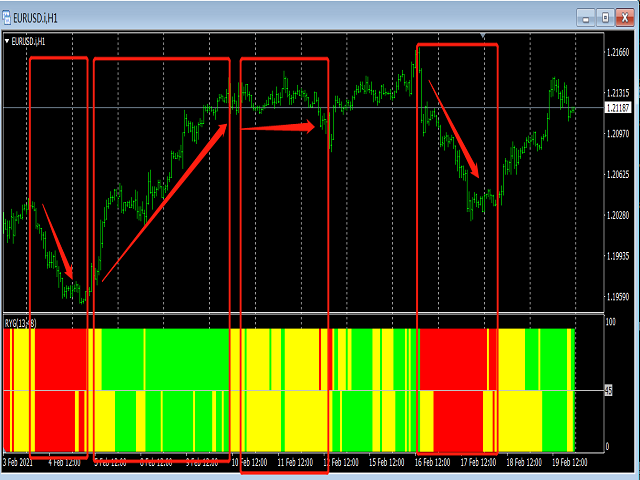
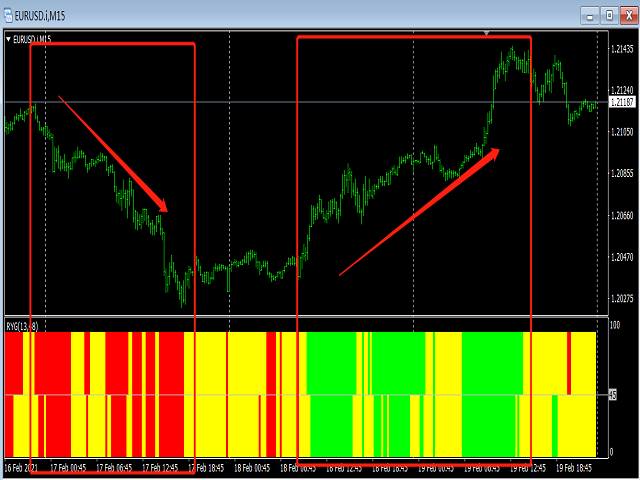
Double line RSI sub graph index.The parameters are adjustable.The RSI lines with two different cycles can be used to observe the trend strength effectively.Meanwhile, a short period cross long period color column image is displayed below.When the cycle (Jin Cha) is on the short cycle, the color of the column map changes from the light green to the purple red. When the short period is long period (dead fork), the color of the column map changes from the purple red to the light green. The short periodic line shows the purple red when it is above the long periodic line. The short periodic line shows the light green at the bottom of the long period line.It means that the current gap is strong.At the same time, the column diagram of MACD was integrated and displayed in the lowest position in color column diagram.When the color of the column is yellow from green, it means DIF rising to indicate that the trend is back to the bottom; when the color of the column map is red from yellow, the trend is stronger for the 0 axis on the MACD DIF.When the color of the column is yellow from red to DIF, the trend slows down; when the color of the column is changed from yellow to green, the 0 axis is worn down for DIF, and the trend is turned from multi head to empty head.If the color changes frequently in recent columns, it shows that the market is in the concussion zone.The parameters are adjustable.


Productos recomendados
Traditional MACD MT4
Daniel Lewis
4.59 (56)
El indicador MACD en MetaTrader 4/5 se diferencia de los semejantes indicadores en otros programas. Eso se debe al hecho de que en la versión MetaTrader 4/5 la línea MACD se muestra en forma del histograma, mientras que habitualmente se muestra en forma de la línea. Además, en la versión MetaTrader 4/5 la línea de señal se construye con el uso de SMA, mientras que por definición tiene que construirse usando EMA. En la versión MetaTrader 4/5 también se diferencia el histograma (la diferencia entr
FREE
OrderBlock TS Roman
Vladislav Vlastovskii
3.8 (5)
Индикатор строит блоки заказов (БЗ) по торговой системе (ТС) Романа. Поиск блоков осуществляется одновременно на двух таймфремах: текущем и старшем (определяемым в настройках). Для оптимизации и игнорирования устаревших блоков в настройках задается ограничение количества дней в пределах которых осуществляется поиск блоков. Блоки строятся по правилам ТС состоящем из трех шагов: какую свечу вынесли (что?); какой свечой вынесли (чем?); правило отрисовки (как?).
FREE
TrendPlus
Sivakumar Subbaiya
4.08 (12)
Trend Plus   Trendplus  Indicator   Time Frame: Suitable for any time frame.  Purpose: Trend Prediction. Blue and red candle indicate the buy and sell call respectively. Buy: When the blue candle is formed buy call is initiated. close the buy trades when the next red candle will formed.   Sell: When the Red candle is formed Sell call is initiated. close the Sell trades when the next blue candle will formed.   Happy trade!!
FREE
Donchian channels are a tool in technical analysis used to determine the relative volatility of a market and the potential for price breakouts. Can help identify potential breakouts and reversals in price, which are the moments when traders are called on to make strategic decisions. These strategies can help you capitalize on price trends while having pre-defined entry and exit points to secure gains or limit losses. Using the Donchian channel can thus be part of a disciplined approach to manag
FREE
Volume Oscilator is a popular indicator available in trading view which is very popular among traders Definition The Volume Oscillator is an indicator made up of two Moving Averages (MA) surrounding volume, one being fast and the other slow. The slow volume MA value is then subtracted from the value of the fastlow Moving Average. The Volume Oscillator measures volume by analyzing the relationship between the two Moving Averages mentioned. When combined with other indicators it provides a very st
FREE
Tipu Heikin Ashi Panel
Kaleem Haider
4.56 (18)
Tipu Heikin-Ashi Panel is the modified version of the original Heiken Ashi indicator published by MetaQuotes here . A professional version of this indicator is available here . Features An easy to use Panel that shows the Heiken Ashi trend of selected timeframe. Customizable Buy/Sell alerts, push alerts, email alerts, or visual on-screen alerts. Customizable Panel. The panel can be moved to any place on the chart or minimized to allow more space. Heikin means "the average", and Ashi means "foo
FREE
FREE FOR A LIMITED TIME ONLY!!! The Ultimate Indicator For Trading Trend This indicator clearly shows you the strength of the market in one direction or the other, which means that you can trade knowing you are either with or against the market. When used in conjunction with the +3R principles you are sure to have some serious results. The +3R Principles Routine - This is when you trade and how often  Rules - This is the rule you follow  Risk:Reward - This is the percentage amount of your accoun
FREE
Free automatic Fibonacci is an indicator that automatically plots a Fibonacci retracement based on the number of bars you select on the BarsToScan setting in the indicator. The Fibonacci is automatically updated in real time as new highest and lowest values appears amongst the selected bars. You can select which level values to be displayed in the indicator settings. You can also select the color of the levels thus enabling the trader to be able to attach the indicator several times with differe
FREE
Wave Reversal Indicator - determines the direction of trend waves and price reversals. The indicator shows wave movements and trend directions. It gives recommendations where to follow the trader, helps to follow the trading strategy. It is an addition to an intraday or medium-term strategy. Almost all parameters are selected for each time frame and are changed automatically, the only parameter for manual adjustment is the wavelength. Works on various trading instruments and timeframes, rec
FREE
Are you tired of drawing trendlines every time you're analyzing charts? Or perhaps you would like more consistency in your technical analysis. Then this is for you. This indicator will draw trend lines automatically when dropped on a chart. How it works Works similar to standard deviation channel found on mt4 and mt5. It has 2 parameters: 1. Starting Bar 2. Number of bars for calculation The   starting bar   is the bar which drawing of the trend lines will begin, while the   number of bars for c
FREE
The Cossover MA Histogram indicator is a simple tool showing the trend based on crossover of moving averages. Simply specify two mobving averages and addicional parameters like MA method and Applied price. When fast MA is above slow MA the histogram is green, indicating an uptrend. When MA fast is below MA slow the histogram is red, indicating an downtrend.
FREE
HMA Trend
Pavel Zamoshnikov
4.6 (67)
A trend indicator based on the Hull Moving Average (HMA) with two periods. The Hull Moving Average is an improved variant of the moving average, which shows the moment of trend reversal quite accurately. It is often used as a signal filter. Combination of two types of Hull Moving Averages makes a better use of these advantages: HMA with a slow period identifies the trend, while HMA with a fast period determines the short-term movements and signals in the trend direction. Features The movement
FREE
GS spread
Aleksander Gladkov
The indicator calculates the current spread for each tick using the formula Spread=(ASK-BID)/Point. Schedule of changes in the boundaries spread over the timeframe displayed in a separate window from the date of accession of the indicator. Two lines corresponding to the minimum and maximum spread values are displayed. The indicator window is self-adjusted according to the minimum and maximum values from the moment of launch. The minimum and maximum values for the entire period of the indicator o
FREE
Follow The Line
Oliver Gideon Amofa Appiah
4.07 (14)
FOLLOW THE LINE GET THE FULL VERSION HERE: https://www.mql5.com/en/market/product/36024 This indicator obeys the popular maxim that: "THE TREND IS YOUR FRIEND" It paints a GREEN line for BUY and also paints a RED line for SELL.  It gives alarms and alerts of all kinds. IT DOES NOT REPAINT and can be used for all currency pairs and timeframes. Yes, as easy and simple as that. Even a newbie can use it to make great and reliable trades. NB: For best results, get my other premium indicators for more
FREE
FFx Momentum
Eric Venturi-Bloxs
4 (1)
The purpose of this new version of the MT4 standard indicator provided in your platform is to display in a sub-window multiple timeframes of the same indicator. See the example shown in the picture below. But the display isn’t like a simple MTF indicator. This is the real display of the indicator on its timeframe. Here's the options available in the FFx indicator: Select the timeframes to be displayed (M1 to Monthly) Define the width (number of bars) for each timeframe box Alert pop up/sound/ema
FREE
Email Drawdown Alert
Roman Starostin
5 (12)
Free informative Indicator-helper. It'll be usefull for traders who trade many symbols or using grid systems (Averaging or Martingale). Indicator counts drawdown as percent and currency separate. It has a number of settings: Count deposite drawdown according equity value and send e-mail or notifications to user if DD more than set; Sending e-mail when max open orders reached; Shows price and remaining pips amount before MarginCall on current chart and Account generally; Display summary trade lot
FREE
MTF Stochastic and RSI
Georgiy Gazaryan
5 (2)
A simple but effective helper that will allow you to track both global and local market trends. The indicator combines the work of two oscillators: Stochastic and RSI. Both indicators can be set to any timeframe. Advantages of Use Multitimeframe - you can adjust both indicators to the desired timeframes. To obtain the entry points, you can use the Elder's triple screen system. Highly customizable - you can configure not only the parameters of the indicators, but also their appearance (color an
FREE
With this system you can spot high-probability trades in direction of strong trends. You can profit from stop hunt moves initiated by the smart money! Important Information How you can maximize the potential of the scanner, please read here: www.mql5.com/en/blogs/post/718109 Please read also the blog about the usage of the indicator: Professional Trading With Strong Momentum This FREE Version of the indicator works only on EURUSD and GBPUSD. The full version of the indicator can be found here:
FREE
FFx ParabolicSAR
Eric Venturi-Bloxs
4.67 (3)
The purpose of this new version of the MT4 standard indicator provided in your platform is to display in a sub-window multiple timeframes of the same indicator. See the example shown in the picture below. But the display isn’t like a simple MTF indicator. This is the real display of the indicator on its timeframe. Here's the options available in the FFx indicator: Select the timeframes to be displayed (M1 to Monthly) Define the width (number of bars) for each timeframe box Alert pop up/sound/ema
FREE
TIbors Timer
Tibor Hartmut Sturm
Indikator zur klaren Anzeige im Metatrader Dieser Indikator wurde von mir Entwickelt damit die Anzeige der relevanten Parameter klar und deutlich im Chart auf einen Blick zu sehen ist.  Er dient zur Information und ist ohne Gewähr.  Folgende Parameter werden angezeigt: -   Der  Aktuelle Kurs - Das Aktuelle Handelspaar - Die Restzeit zur nächsten Kerzenbildung / Zum Abschluss der Aktuellen Kerze - Die Kontonummer des Handelskontos - Die Frei Verfügbare Margin - Die Margin auf 1 Lot - Der Akt
FREE
This indicator alerts you when/before new 1 or 5 minute bar candle formed. In other words,this indicator alerts you every 1/5 minutes. This indicator is especially useful for traders who trade when new bars formed. *This indicator don't work propery in strategy tester.Use this in live trading to check functionality. There is more powerful Pro version .In Pro version,you can choose more timeframe and so on. Input Parameters Alert_Or_Sound =Sound ----- Choose alert or sound or both to not
FREE
MegaTrends
Sivakumar Subbaiya
1 (1)
Megatrends  Indicator   Time Frame: Suitable for any time frame.  Purpose: Trend Prediction. Blue and red color indicate the buy and sell call respectively. Buy: When the blue line is originating it is opened buy call. Sell: When the Red line is origination it is opened sell call Happy trade!! this indicator is suitable for all time frame, but our recommended time frame to use 1hour and 4 hours, suitable for any chart.
FREE
FFx Fractals
Eric Venturi-Bloxs
4.5 (2)
The purpose of this new version of the MT4 standard indicator provided in your platform is to display in a sub-window multiple timeframes of the same indicator. See the example shown in the picture below. But the display isn’t like a simple MTF indicator. This is the real display of the indicator on its timeframe. Here's the options available in the FFx indicator: Select the timeframes to be displayed (M1 to Monthly) Define the width (number of bars) for each timeframe box Alert pop up/sound/ema
FREE
RSI With Alert Relative strength index (RSI) indicator is a popular technical indicator in the family of oscillators. RSI oscillates between 0 and 100 and traders use it to spot overbought and oversold states in the market. Typically, a value above 70 means that the instrument is overbought and due to a retracement. A value below 30 means that the trading instrument is oversold. RSI indicator strategies This indicator allows you to get notifications when some conditions trigger. You c
FREE
FFx MACD
Eric Venturi-Bloxs
4.2 (5)
El objetivo de esta nueva versión del indicador MT4 estándar, incluido en el suministro de la plataforma, es mostrar en una subventana varios marcos temporales de un mismo indicador. Ver el ejemplo mostrado en la figura de más abajo. Sin embargo, el indicador no se representa como un indicador MTF simple. Es la representación real del indicador en su marco temporal. Ajustes disponibles en el indicador FFx: Elección del marco temporal a mostrar (desde M1 hasta MN) Ajuste de la anchura (cantidad d
FREE
Trend arrow Indicator
NGUYEN NGHIEM DUY
3.33 (9)
Trend arrow Indicator is an arrow Indicator used as an assistant tool for your trading strategy. The indicator analyzes the standard deviation of bar close for a given period and generates a buy or sell signals if the deviation increases. It good to combo with Martingale EA to follow Trend and Sellect Buy Only/Sell Only for EA work Semi-Automatic. You can use this  Indicator with any EAs in my Products.
FREE
El indicador identifica cuando ocurre una divergencia entre el precio y un indicador u oscilador. Identifica divergencias alcistas y bajistas ocultas o regulares (clásicas). Combinado con sus propias reglas y técnicas, este indicador le permitirá crear (o mejorar) su propio sistema poderoso. Características Puede detectar divergencias para los siguientes indicadores / osciladores: MACD, OsMA (Media móvil del oscilador), Estocástico, RSI, CCI, RVI, Awesome (AO), ADX, ATR, OBV, MFI, Momentum y  
FREE
Wise Men Indicator demo
Bohdan Kasyanenko
3 (2)
The indicator displays signals according to the strategy of Bill Williams on the chart. Demo version of the indicator has the same features as the paid, except that it can work only on a demo account . Signal "First Wise Man" is formed when there is a divergent bar with angulation.  Bullish divergent bar - with lower minimum and closing price in the upper half. Bearish divergent bar - higher maximum and the closing price at the bottom half. Angulation is formed when all three lines of Alligat
FREE
Color Macd Tf
Syarif Nur Arief
MACD is well known indicator that still can be use for prediction where price will go next few minutes, hours or even weekly  With colored bar of Macd, your eyes can easily catch when color is changed based what market price movement to find any early trend on market. here is the parameter of the indicator: TF_MACD , default is 1 Hour , this mean you can see clearly MACD of 1 Hour TimeFrame on Lower TimeFrame. InpPrice , default is Price Close , this is original MACD parameter from Metaquotes st
FREE
FFx Bollinger Bands
Eric Venturi-Bloxs
4.75 (4)
El objetivo de esta nueva versión del indicador MT4 estándar, incluido en el suministro de la plataforma, es mostrar en una subventana varios marcos temporales de un mismo indicador. Ver el ejemplo mostrado en la figura de más abajo. Sin embargo, el indicador no se representa como un indicador MTF simple. Es la representación real del indicador en su marco temporal. Ajustes disponibles en el indicador FFx: Elección del marco temporal a mostrar (desde M1 hasta MN) Ajuste de la anchura (cantidad d
FREE
Los compradores de este producto también adquieren
Gann Made Easy
Oleg Rodin
4.85 (81)
Gann Made Easy es un sistema de comercio de Forex profesional y fácil de usar que se basa en los mejores principios de comercio utilizando la teoría del Sr. W. D. Gann. El indicador proporciona señales precisas de COMPRA y VENTA, incluidos los niveles de Stop Loss y Take Profit. Puede comerciar incluso sobre la marcha utilizando notificaciones PUSH. ¡Por favor, póngase en contacto conmigo después de la compra! ¡Compartiré mis consejos comerciales con usted y excelentes indicadores de bonificació
TPSpro RFI Levels
Roman Podpora
4.82 (22)
反转第一脉冲水平 (RFI)     指示     俄羅斯     -        ESP   Recomendamos utilizar con   el indicador -   TPSpro 趋势专业版 -   MT5版本 Un elemento clave importante en el comercio son las zonas o niveles a partir de los cuales se toman decisiones para comprar o vender un instrumento comercial. A pesar de los intentos de los grandes actores de ocultar su presencia en el mercado, inevitablemente dejan rastros. Nuestra tarea era aprender a encontrar estos rastros e interpretarlos correctamente. Funciones principales:
Atomic Analyst
Issam Kassas
5 (2)
En primer lugar, vale la pena enfatizar que este Indicador de Trading no repinta, no redibuja y no se retrasa, lo que lo hace ideal tanto para el trading manual como para el automatizado. Manual del usuario: configuraciones, entradas y estrategia. El Analista Atómico es un Indicador de Acción del Precio PA que utiliza la fuerza y el impulso del precio para encontrar una mejor ventaja en el mercado. Equipado con filtros avanzados que ayudan a eliminar ruidos y señales falsas, y aumentan el poten
Gold Stuff
Vasiliy Strukov
4.89 (238)
Gold Stuff: un indicador de tendencia diseñado específicamente para el oro, también se puede usar en cualquier instrumento financiero. El indicador no se vuelve a dibujar ni se retrasa. El marco de tiempo recomendado es H1. Este indicador está escrito por EA Gold Stuff Advisor, puede encontrarlo en mi perfil.  Puede obtener una copia gratuita de nuestro indicador Strong Support y Trend Scanner, por favor envíe un mensaje privado. ¡a mí! IMPORTANTE! Póngase en contacto conmigo inmediatamente d
Trend Punch
Mohamed Hassan
4.95 (19)
This indicator is unstoppable when combined with our other indicator called  Support & Resistance . After purchase, send us a message and you will get it   for  FREE as a BONUS! Introducing Trend Punch , the revolutionary forex trend indicator that will transform the way you trade! Trend Punch is uniquely designed to provide precise buy and sell arrows during strong market trends, making your trading decisions clearer and more confident. Whether you're trading major currency pairs or exotic sym
Scalper Inside PRO
Alexey Minkov
4.73 (56)
An exclusive indicator that utilizes an innovative algorithm to swiftly and accurately determine the market trend. The indicator automatically calculates opening, closing, and profit levels, providing detailed trading statistics. With these features, you can choose the most appropriate trading instrument for the current market conditions. Additionally, you can easily integrate your own arrow indicators into Scalper Inside Pro to quickly evaluate their statistics and profitability. Scalper Inside
TPSproTREND PrO
Roman Podpora
4.79 (19)
TPSpro TREND PRO   es un indicador de tendencia que analiza automáticamente el mercado y proporciona información sobre la tendencia y cada uno de sus cambios, además de dar señales para ingresar operaciones sin volver a dibujar. El indicador utiliza cada vela, analizándolas por separado. refiriéndose a diferentes impulsos: impulso hacia arriba o hacia abajo. ¡Puntos de entrada exactos a transacciones de divisas, criptomonedas, metales, acciones e índices! Versión MT5                   DESCRIPCI
FX Power MT4 NG
Daniel Stein
5 (12)
Obtenga su actualización diaria del mercado con detalles y capturas de pantalla a través de nuestro Morning Briefing aquí en mql5 y en Telegram ! FX Power MT4 NG es la nueva generación de nuestro popular medidor de fuerza de divisas, FX Power. ¿Y qué ofrece este medidor de fuerza de nueva generación? Todo lo que le encantaba del FX Power original PLUS Análisis de fuerza de ORO/XAU Resultados de cálculo aún más precisos Períodos de análisis configurables individualmente Límite de cálculo persona
¡Actualmente 20% OFF ! ¡La mejor solución para cualquier novato o trader experto! Este software funciona con 28 pares de divisas. Se basa en 2 de nuestros principales indicadores (Advanced Currency Strength 28 y Advanced Currency Impulse). Proporciona una gran visión general de todo el mercado de divisas. Muestra los valores de Advanced Currency Strength, la velocidad de movimiento de las divisas y las señales para 28 pares de divisas en todos los (9) marcos temporales. Imagine cómo mejorar
El indicador Chart Patterns All-in-One ayuda a los traders a visualizar varios patrones de gráficos comúnmente utilizados en el análisis técnico. Este indicador apoya la identificación de posibles comportamientos del mercado, pero no garantiza rentabilidad. Se recomienda probar el indicador en modo demo antes de comprar. Oferta actual : Descuento del 50% en el indicador "Chart Patterns All in One". Patrones incluidos : Patrón 1-2-3 : Detecta reversiones del mercado utilizando tres puntos clave (
Trend Screener
STE S.S.COMPANY
4.8 (87)
Indicador de tendencia, solución única e innovadora para el comercio y filtrado de tendencias con todas las funciones de tendencias importantes integradas en una sola herramienta. Es un indicador 100% sin repintar de marcos temporales y monedas múltiples que se puede usar en todos los símbolos/instrumentos: divisas, materias primas, criptomonedas, índices y acciones. OFERTA POR TIEMPO LIMITADO: El indicador de detección de soporte y resistencia está disponible por solo 50$ y de por vida. (Precio
FX Volume
Daniel Stein
4.58 (33)
Obtenga su actualización diaria del mercado con detalles y capturas de pantalla a través de nuestro Morning Briefing aquí en mql5 y en Telegram ! FX Volume es el PRIMER y ÚNICO indicador de volumen que proporciona una visión REAL del sentimiento del mercado desde el punto de vista de un bróker. Proporciona una visión impresionante de cómo los participantes institucionales del mercado, como los brokers, están posicionados en el mercado Forex, mucho más rápido que los informes COT. Ver esta info
- Real price is 80$ - 40% Discount ( It is 49$ now ) Contact me for instruction, add group and any questions! Related EA Product: Bitcoin Expert Introduction The breakout and retest strategy is traded support and resistance levels. it involves price breaking through a previous level.  The break and retest strategy is designed to help traders do two main things, the first is to avoid false breakouts. Many false breakouts start with a candlestick that breaks out of a level but ends with an immedi
ACTUALMENTE 31% DE DESCUENTO Este indicador es una herramienta de transacción única, de alta calidad y asequible porque hemos incorporado una serie de características propias y una fórmula secreta. Con solo un gráfico, da Alertas para los 28 pares de divisas. ¡Imagina cómo mejorarás porque puedes identificar el punto de activación exacto de una nueva tendencia u oportunidad de crecimiento! Basado en nuevos algoritmos subyacentes , hace que sea aún más fácil identificar y confirmar operaciones po
Enigmera
Ivan Stefanov
5 (3)
ENIGMERA: El núcleo del mercado https://www.enigmera.com Introducción Este indicador y sistema de negociación es un enfoque extraordinario de los mercados financieros. ENIGMERA utiliza los ciclos fractales para calcular con precisión los niveles de soporte y resistencia. Muestra la auténtica fase de acumulación y proporciona dirección y objetivos.  Un sistema que funciona tanto si estamos en una tendencia como en una corrección.  ¿Cómo funciona? ENIGMERA consta de tres líneas: la línea de s
Trend Cutter
Oleg Rodin
5 (2)
Trend Cutter es un indicador de tendencia que se puede utilizar con cualquier período de tiempo, incluidos los períodos de tiempo más bajos como M1 y M5. El indicador es ideal para los operadores que prefieren el comercio intradiario y también será útil para aquellos que prefieren el comercio a largo plazo. Puede utilizar este indicador como base para su sistema comercial o como una solución comercial independiente. El indicador proporciona todo tipo de alertas, incluidas notificaciones PUSH. El
El sistema PRO Renko es un sistema de trading de alta precisión especialmente diseñado para operar gráficos RENKO. Se trata de un sistema universal que se puede aplicar a diversos instrumentos de negociación. El sistema neutraliza eficazmente el llamado ruido de mercado, lo que le brinda acceso a señales de reversión precisas. El indicador es muy fácil de usar y solo tiene un parámetro responsable de la generación de señales. Puede adaptar fácilmente la herramienta a cualquier instrumento com
ACTUALMENTE 26% DE DESCUENTO ¡La mejor solución para cualquier operador novato o experto! Este indicador es una herramienta única, de alta calidad y asequible porque hemos incorporado una serie de características propias y una nueva fórmula. ¡Con sólo UN gráfico puede leer la Fuerza de la Divisa para 28 pares de Divisas! Imagínese cómo mejorará su operativa porque podrá señalar el punto exacto de activación de una nueva tendencia o de una oportunidad de scalping. Manual del usuario: haga
Conviértase en un Breaker Trader y obtenga beneficios de los cambios en la estructura del mercado a medida que se invierte el precio. El indicador de ruptura de bloque de órdenes identifica cuándo una tendencia o movimiento de precio se acerca al agotamiento y está listo para revertirse. Le alerta sobre cambios en la estructura del mercado que generalmente ocurren cuando una reversión o un retroceso importante están a punto de suceder. El indicador utiliza un cálculo patentado que identific
TakePropips Donchian Trend Pro
Eric John Pajarillaga Aldana
4.44 (16)
¡TakePropips Donchian Trend Pro   (MT4) es una herramienta poderosa y efectiva que detecta automáticamente la dirección de la tendencia utilizando el Canal Donchian y le proporciona señales comerciales de entrada y salida! Este indicador multifunción incluye un escáner de tendencias, señales comerciales, panel estadístico, filtro, sesiones comerciales y panel de historial de alertas. ¡Está diseñado para proporcionarle señales comerciales y ahorrarle horas analizando los gráficos! Puede descargar
Dibuja automáticamente los niveles de soporte y resistencia MÁS los gaps de las velas de propulsión en su gráfico, para que pueda ver hacia dónde es probable que el precio se dirija a continuación y/o potencialmente retroceda. Este indicador está diseñado para ser utilizado como parte de la metodología de negociación de posiciones que se enseña en mi sitio web (The Market Structure Trader) y muestra información clave para la orientación y entradas potenciales. Hay 2 características PRINCIPA
Currency Strength Wizard es un indicador muy poderoso que le proporciona una solución todo en uno para operar con éxito. El indicador calcula el poder de este o aquel par de divisas utilizando los datos de todas las monedas en múltiples marcos de tiempo. Estos datos se representan en forma de índice de moneda fácil de usar y líneas eléctricas de moneda que puede usar para ver el poder de esta o aquella moneda. Todo lo que necesita es adjuntar el indicador al gráfico que desea operar y el indicad
IX Power MT4
Daniel Stein
5 (5)
IX Power lleva por fin la insuperable precisión de FX Power a los símbolos que no son de Forex. Determina con exactitud la intensidad de las tendencias a corto, medio y largo plazo de tus índices, acciones, materias primas, ETF e incluso criptodivisas favoritas. Puede analizar todo lo que su terminal le ofrece. Pruébalo y experimenta cómo tu timing mejora significativamente a la hora de operar. Características principales de IX Power Resultados de cálculo 100% precisos y sin repintado -
El indicador de reversión de ADR le muestra de un vistazo dónde se cotiza actualmente el precio en relación con su rango diario promedio normal. Recibirá alertas instantáneas a través de una ventana emergente, correo electrónico o push cuando el precio exceda su rango promedio y los niveles por encima de su elección para que pueda saltar rápidamente a retrocesos y reversiones. El indicador dibuja líneas horizontales en el gráfico en los extremos del rango promedio diario y también extensiones p
Trend Pulse
Mohamed Hassan
5 (4)
Please contact me after purchase to immediately get your PDF strategy + documentation for Trend Pulse !  Introducing Trend Pulse , a unique and robust indicator capable of detecting bullish, bearish, and even ranging trends! Trend Pulse uses a special algorithm to filter out market noise with real precision. If the current symbol is moving sideways, Trend Pulse will send you a ranging signal, letting you know that it's not a good time to enter a trade. This excellent system makes Trend Pulse
El panel de alertas RSI / TDI le permite monitorear los RSI a la vez (seleccionables por usted) en cada par principal que opere. Puedes usarlo de dos maneras: 1. Seleccione varios marcos de tiempo y el guión le mostrará cuándo hay varios marcos de tiempo que se extienden más allá de las condiciones comerciales normales. Un gran indicador de que el precio ha subido con fuerza recientemente, ya que ha alcanzado un nivel de sobrecompra o sobreventa en múltiples marcos de tiempo, por lo que p
Stratos Pali Indicator   is a revolutionary tool designed to enhance your trading strategy by accurately identifying market trends. This sophisticated indicator uses a unique algorithm to generate a complete histogram, which records when the trend is Long or Short. When a trend reversal occurs, an arrow appears, indicating the new direction of the trend. Important Information Revealed Leave a review and contact me via mql5 message to receive My Top 5 set files for Stratos Pali at no cost! D
Gold Channel is a volatility-based indicator, developed with a specific timing algorithm for the XAUUSD pair, which consists of finding possible corrections in the market. This indicator shows two outer lines, an inner line (retracement line) and an arrow sign, where the theory of the channel is to help identify overbought and oversold conditions in the market. The market price will generally fall between the boundaries of the channel. If prices touch or move outside the channel it is a tra
M1 Arrow
Oleg Rodin
4.73 (15)
Una estrategia intradía basada en dos principios fundamentales del mercado. El algoritmo se basa en el análisis de volúmenes y ondas de precios utilizando filtros adicionales. El algoritmo inteligente del indicador da una señal solo cuando dos factores de mercado se combinan en uno. El indicador calcula ondas de cierto rango en el gráfico M1 utilizando los datos del marco de tiempo más alto. Y para confirmar la onda, el indicador utiliza el análisis por volumen. Este indicador es un sistema come
Bomb Bank Signal
Igor Pereira Calil
5 (1)
Señal de Bomb Bank: su indicador de confianza en MetaTrader 4 Bomb Bank Signal es un poderoso indicador para MetaTrader 4, diseñado para identificar las tendencias más relevantes en el mercado financiero. Si buscas una herramienta que anticipe los movimientos con precisión, el Bomb Bank es el aliado que necesitas. Cómo funciona: Este indicador combina tres métodos distintos (análisis de volumen, cierre de velas y tendencia simétrica) para detectar y señalar oportunidades de compra y venta
Otros productos de este autor
红黄绿简明指示趋势与震荡指标升级版。 使用红黄绿三色来标示上升趋势 、震荡、下跌趋势。 红色表示空头趋势(下跌)。 绿色表示多头趋势(上涨)。 黄色表示震荡区域。 从黄色转变为红色时,行情可能从震荡转变为下跌趋势。一段连续的红色,说明下跌趋势很强。 从黄色转变为绿色时,行情可能从震荡转变为上升趋势。一段连续的绿色,说明上升趋势很强。 指标的上半部分区域和下半部分区域若同步为红色,表明下跌趋势已经形成共振,接下来大概率走出一段空头趋势。 同时,红绿黄分为上下两部分: 若上下部分同时为绿色,表明上涨趋势已经形成共振,接下来大概率走出一段多头趋势。 若上下部分同时为红色,表明下跌趋势已经形成共振,接下来大概率走出一段空头趋势。 若上下同时为黄色,表明当前行情为震荡。 升级版2.0: 新增两条快慢线。 当慢线(Blue/Red线)为蓝色时,视为多头行情。当慢线为红色时,视为空头行情。 当快线(DarkGray线)从下方向上穿过慢线时,作为参考做多信号,激进交易者可进场做多。反之亦然。 参数可调。 //+------------------------------------------
FREE
基于股票软件黄金线指标改编。可根据需要调整参数值。具体使用规则请参考相关股票软件说明。 ////////////////////////////////////////////////////////////////////////////////////////// //股票公式源码如下: VAR1:=(HIGH+LOW+OPEN+CLOSE)/4; 黄金线:EMA(3*VAR1-2*SMA(VAR1,2,1),13); ////////////////////////////////////////////////////////////////////////////////////////// 声明  1 指标计算均基于价格变化而来, 不保证使用此指标的盈利性,作者不对使用此指标的任何损益负责。 2 本指标免费使用。
FREE
基于MT4的画线交易 辅助 EA。通过在图表上绘制趋势线和/或水平线实现开平仓等多种功能。 EA提供2种功能定义模式: 1.颜色标示模式。 2.文字说明模式。 颜色标示模式下, 默认颜色相应功能如下:                     Blue(蓝色):开仓BUY.                     Red(红色):开仓SELL.                     Yellow(黄色):平仓当前品种所有BUY订单。                     White(白色):平仓当前品种所有SELL订单。                     Lime: 平仓当前品种所有盈利的BUY订单。                     Aqua: 平仓当前品种所有盈利的SELL订单。         你可以在EA参数页修改设置你习惯并喜欢的颜色来实现相关功能. 文字说明模式:参数页输入预定义字符,在图表上添加 线条时,在该线的描述中输入与参数页相匹配的字符即实现相应功能。默认文字详见参数页。 图表中画线的数量不受限制,你可以在图表中不同位置添加多
Filtro:
80053930
464
80053930 2021.02.25 12:05 
 

middel

Respuesta al comentario
Versión 1.20 2021.10.05
升级:优化上涨、下跌信号。以及其它一些已知的问题。
Versión 1.10 2021.08.14
新增通知及预警功能,买卖方向建议标识,优化界面显示更清爽。