Trend Semaphore Indicator
- Indicadores
- Rodrigo Silva
- Versión: 2.0
- Actualizado: 22 abril 2020
- Activaciones: 5
TSI - Trend Semaphore Indicator
- Work tool developed to display the force of movement.
- This tool was developed for Trend Following strategies.
- Recommended for all types of traders.
- Can be used in any instrument and market.
- Can be used in any period of time.
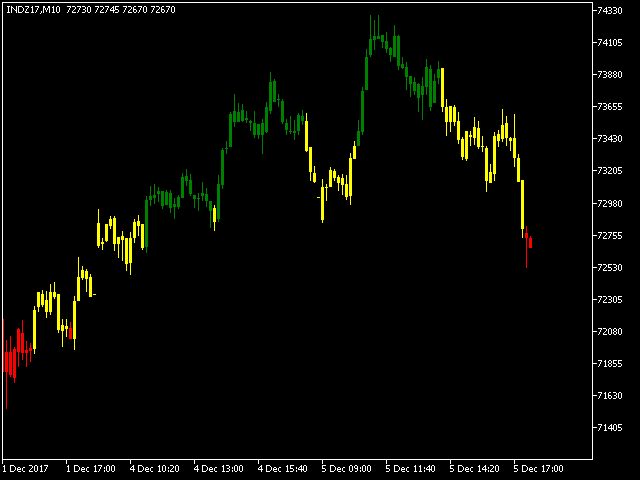
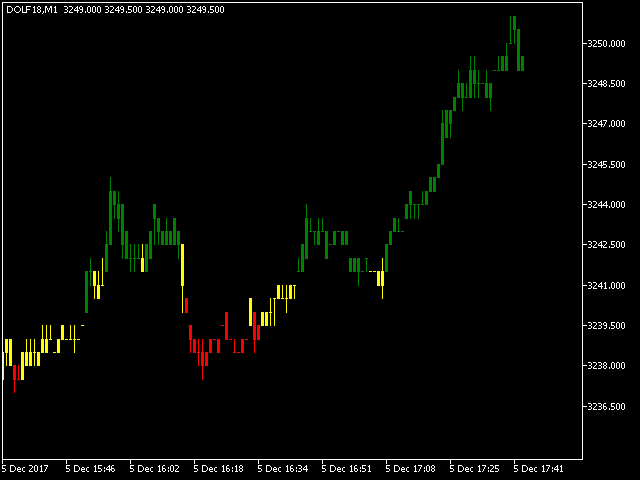
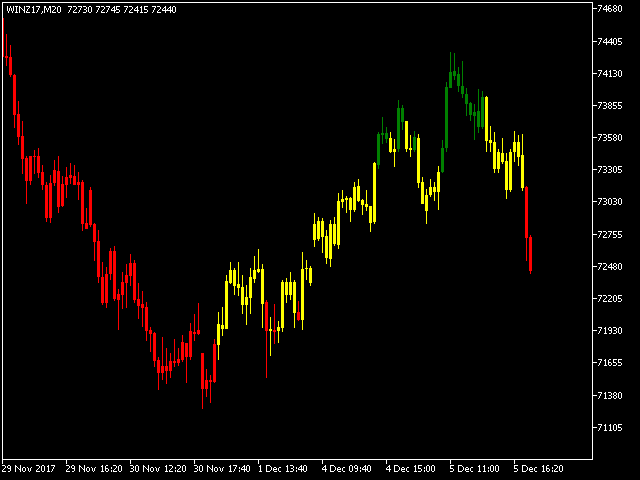
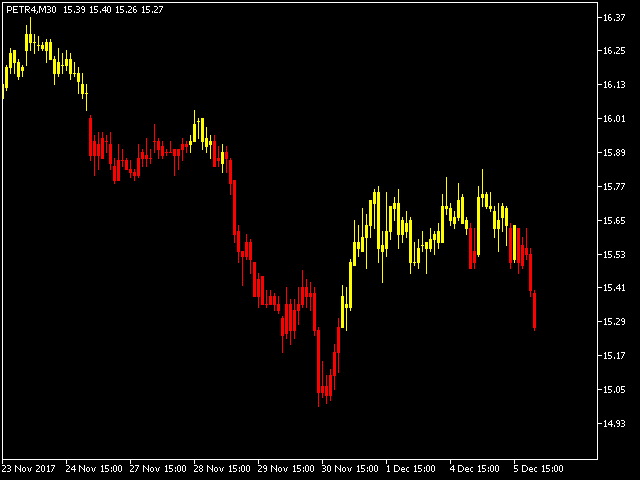
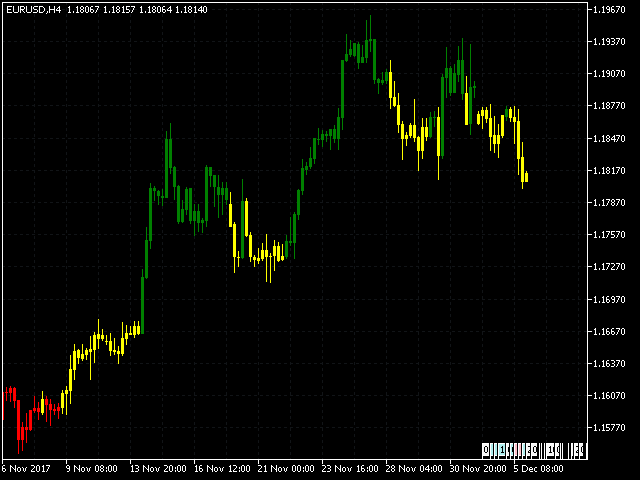
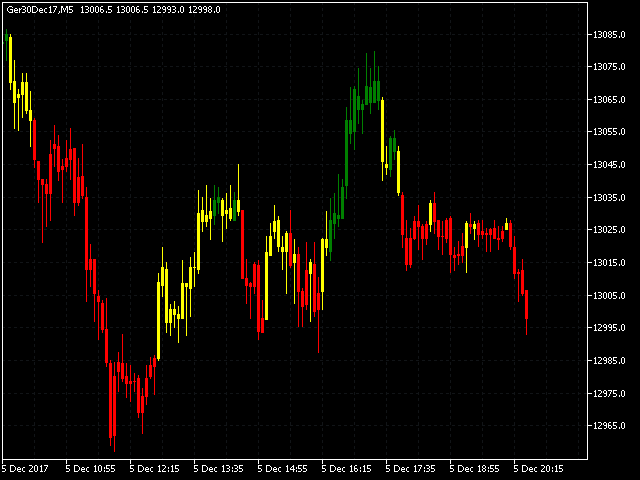
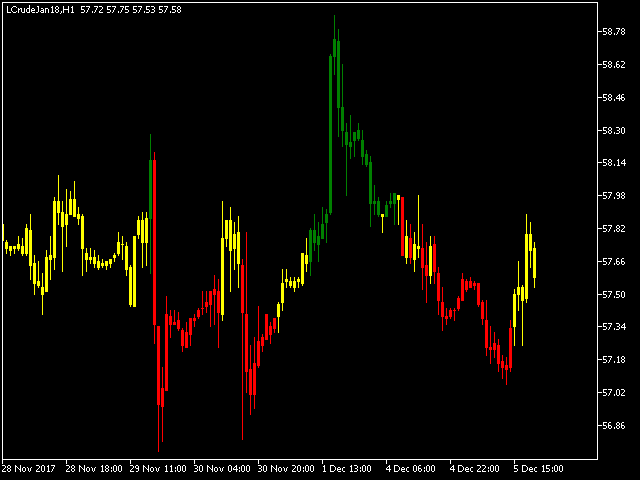
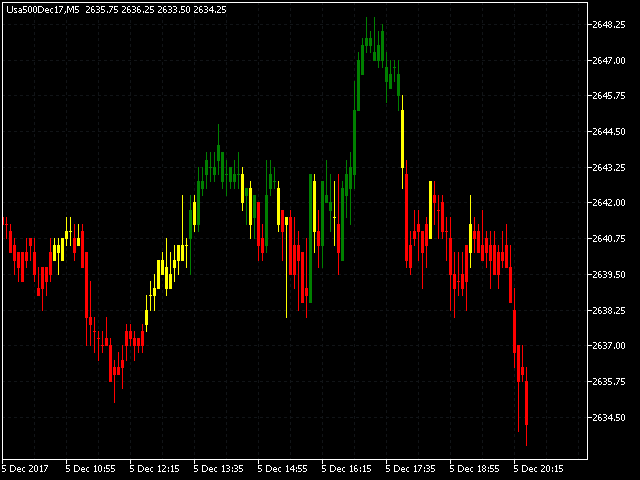
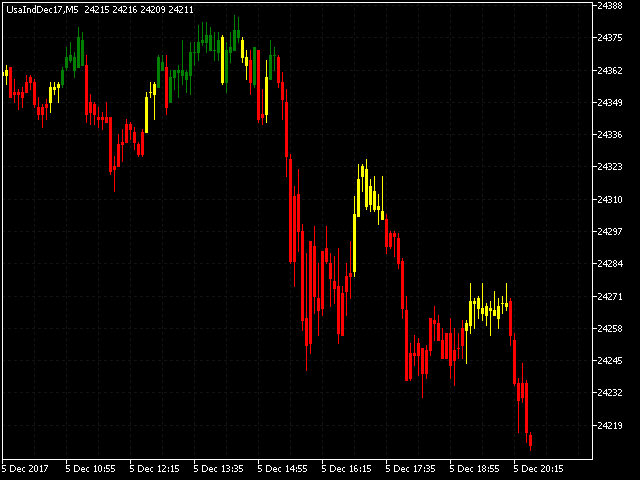
- Trend indication using multicolored candles.
New trend
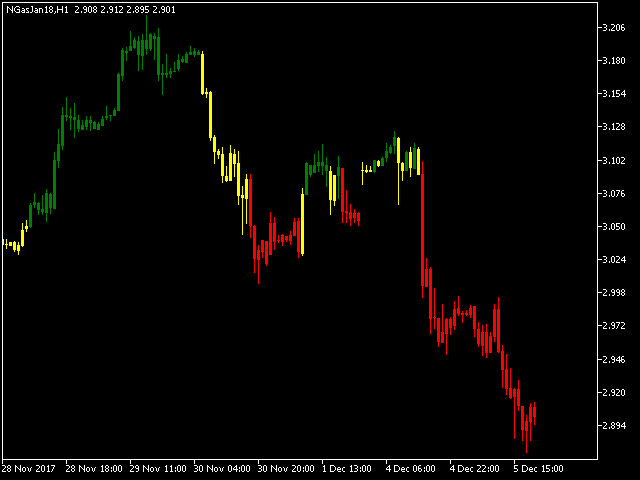
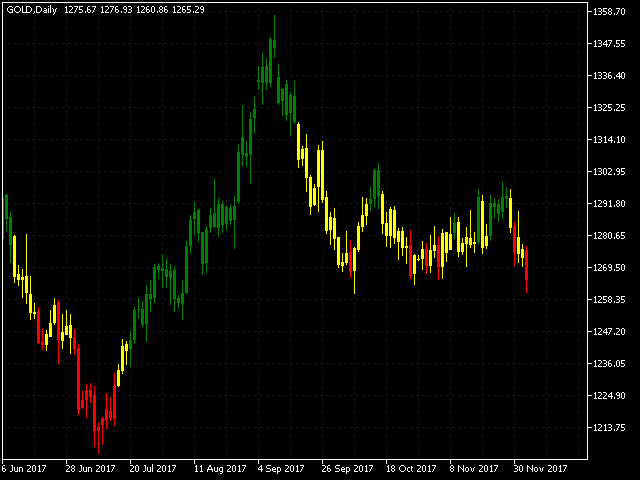
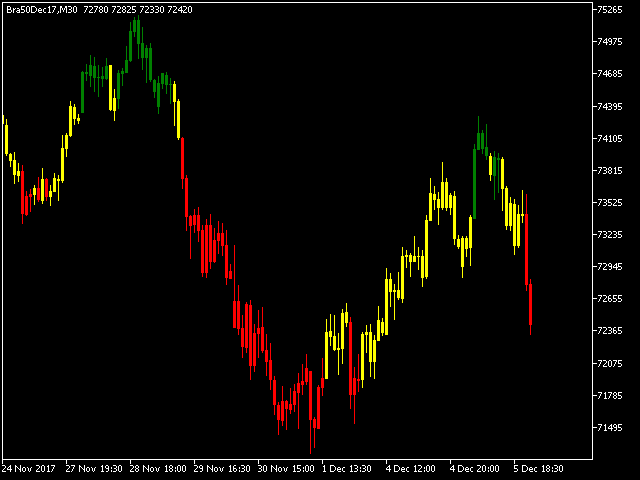
A new trend is signaled by the changing colors on the chart's candles.
The indicator indicates the upward trend with the green color, the downward trend by the red color and weak movements like congestion / consolidation in the yellow color.
This indicator does not repaint the signals.
Trend Aggression
Indicates that there is strength in the direction of the signaled trend.
It is signaled by the color of the candles, when it turns red indicates aggression in the downward tendency, and when it turns green it indicates aggression in the upward tendency.
Tendency weakening
This indicates that there is loss of strength in the direction of the tendency marked with aggression.
It is marked by the change in the color of the candles, when it turns yellow indicates loss of strength in the downward tendency or loss of force in the upward tendency.
Loss of strength is only identified after the trend has been confirmed with aggression, changing from green or red to yellow.
Trading with the Indicator
Trading with the indicator is a personal decision, and every trader has a particular way of doing it.
The most important thing is to respect the colors. It is important to protect the deals whenever the yellow color appears, placing the stop loss where you want, according to your risk profile.
Trend Semaphore Indicator Settings
Explanation of options A, B, C and D.
Each of these options, if enabled, will allow the price to be analyzed. If there is strength or weakness present, based on the use of one or more options, the indicator will paint the candles.
The rules of each option are based on strength and trend indicators.
- settings - Settings of Trend Semaphore Indicator:
- period_candles: current
- info_options = Enable or disable to build the strategy.
- Use Option_A = true
- Use Option_B = true
- Use Option_C = true
- Use Option_D = true
Final considerations
If you want to use various combinations of options A, B, C or D, simply enable or disable the options desired.
It is important to understand that the most liquid assets have trend cycles.
- It starts a trend and at some point there is aggression against or in the direction of the trend.
- Loss of strength in the trend
- It starts a new trend and at some point there is aggression against or in the direction of the trend.
We recommend using this indicator on liquid instruments with moderate or high volatility.
The color of the candles is not based on whether the candle is positive or negative.
The indicator shows in color the direction and strength of the trend of the traded instrument, based on the calculations of the indicators used in it.
A tall candle may be represented in yellow or red.
It may occur from a low candle being represented in yellow or green.
It is important to understand that there may be times when the indicator will not show signs completely in line with market conditions.
