SuperTrend 2 AM
- Indicadores
- Andriy Matviyevs'kyy
- Versión: 26.0
- Actualizado: 14 septiembre 2023
This indicator is a new version of the SuperTrend AM indicator.
The indicator allows to open a position at the very beginning of the price movement.
Another important feature of the indicator is the ability to follow the trend as long as possible to obtain all the potential profit while minimizing the potential losses.
This indicator does not repaint or not recalculate.
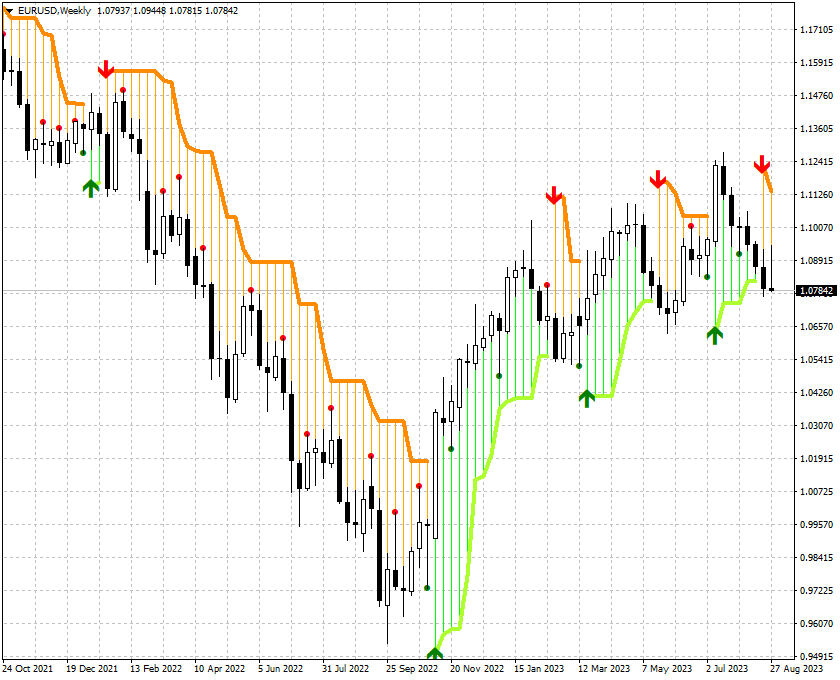
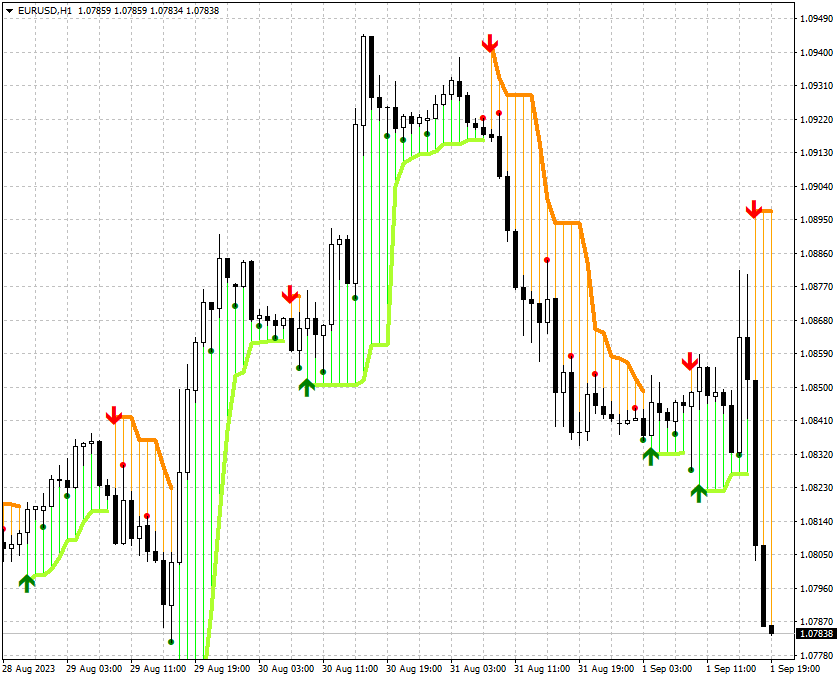
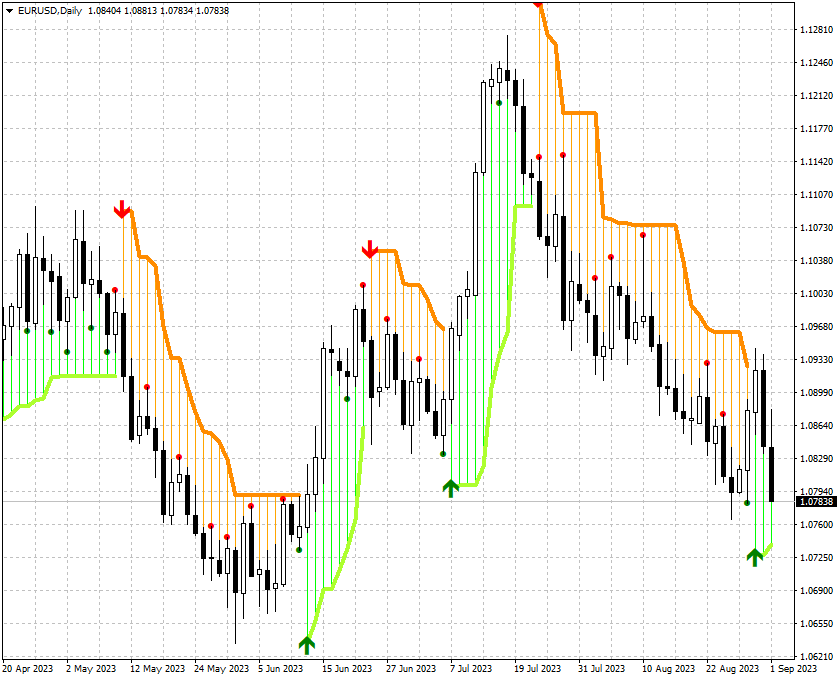
Signal of the indicator
- dot appearing above the price graph - possible start of a downtrend;
- dot appearing below the price graph - possible start of an uptrend;
- line - S/R levels.
Adjustable parameters of the indicator
- Sensitivity (>0) - indicator sensitivity;
- Alerts - show a dialog box containing user data;
- Send_Notification - sends push notifications to the mobile terminals, whose MetaQuotes IDs are specified in the "Notifications" tab;
- Send_Mail - sends an email using an address specified on the Email tab of the options window.