ATR stoping range MTF
- Indicadores
- Versión: 2.2
- Actualizado: 18 noviembre 2021
- Activaciones: 5

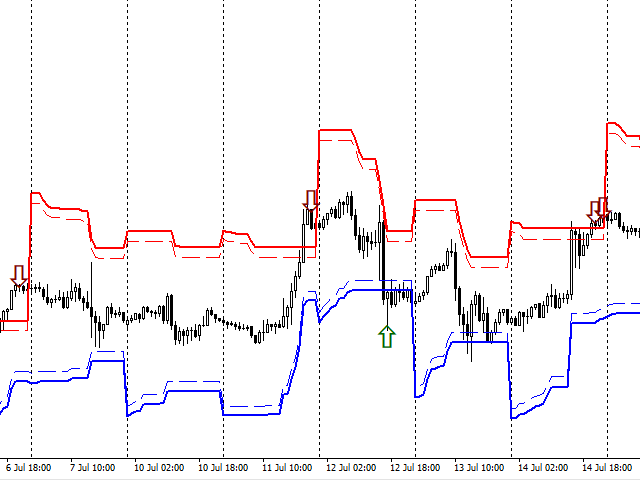
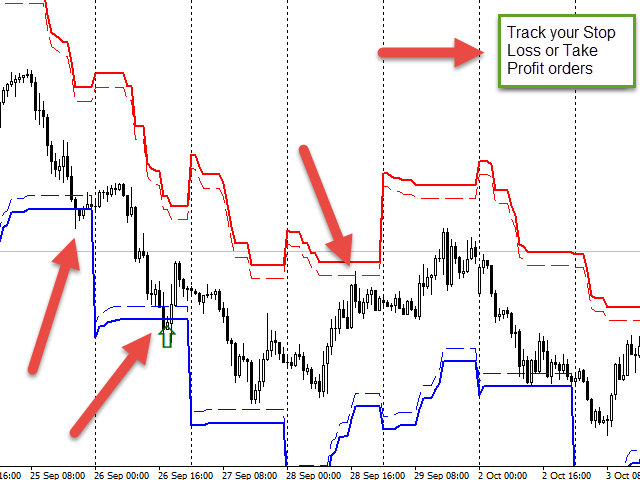
El indicador construye los rangos del movimiento probable del precio según el marco temporal especificado. El rango se construye a partir del nivel de Apertura del marco temporal especificado y se extiende hasta el Cierre del marco temporal, desplazándose en relación con los extremos. El límite superior se establece a partir del mínimo y sólo se desplaza hacia abajo cuando se actualiza el mínimo. El límite inferior se establece a partir del máximo y sólo sube cuando se actualiza el Máximo. Cuando el precio se acerca a los límites del rango, aumenta la probabilidad de que el movimiento se detenga, retroceda o incluso se invierta, ya que las zonas se basan en los valores del indicador ATR. Cuando el precio alcanza los límites del rango, el precio se "desvanece", agotando su fuerza motriz. Y si el límite se rompe y la vela cierra fuera de los límites del rango, la probabilidad de volver al límite roto tiende al 90%.
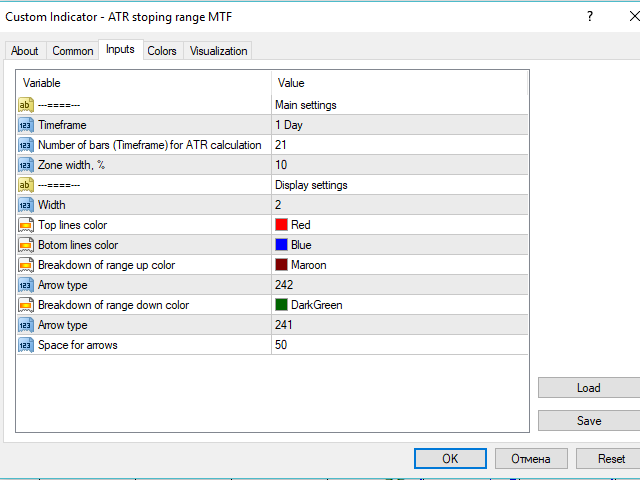
Parámetros del indicador
- Parámetros principales - bloque de los parámetros principales
- Periodo - Periodo ATR
- Period - Periodo ATR
- Ancho de la zona, % - span del rango en porcentaje
- Display settings - bloque de ajustes de visualización del indicador
- Ancho - grosor de la línea
- Color de las líneas superiores - color de las líneas superiores
- Colorde las líneas inferiores - color de las líneas inferiores
- Desglose del rango arriba color - color de la flecha para el desglose del borde superior
- Tipo de flecha - color de las flechas superiores
- Color de la flecha para el desglose del límite inferior
- Tipo de flecha - color de las flechas inferiores
- Espacio para las flechas - desplazamiento de las flechas