• Información general
  • Comentarios (2)
  • Discusión (1)
  • Novedades

EZT Trend

4
El indicador de tendencia EZT le mostrará la tendencia, el retroceso y las oportunidades de entrada. Se encuentran disponibles filtrado opcional y todo tipo de alertas. Se agregan alertas por correo electrónico y notificaciones automáticas. También estamos desarrollando un EA basado en este indicador, que estará disponible pronto.

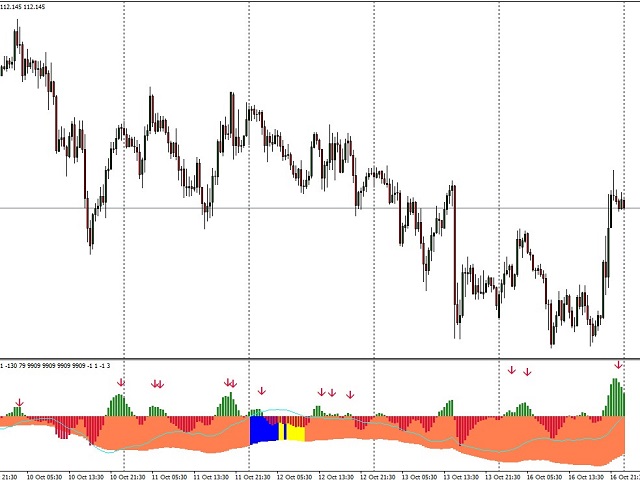
Es un indicador multifuncional que consta de dos histogramas de color y una línea. Es una representación visual de la dirección y la fuerza de una tendencia; también encontrará divergencias muchas veces, ya sea en la línea o en el histograma.

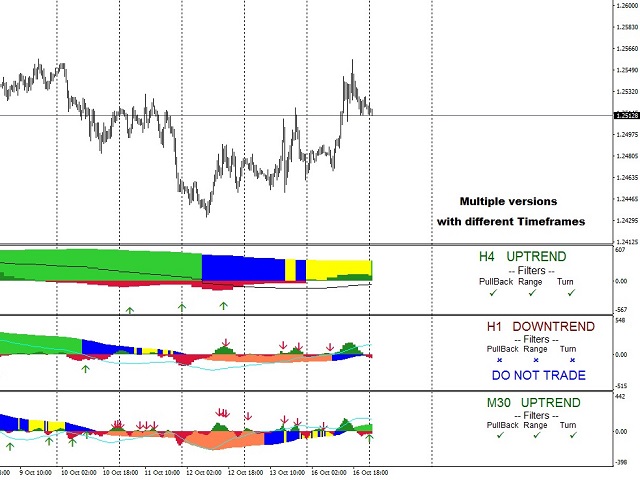
El indicador funciona bien con la configuración de parámetros automáticos. Están predeterminados para el período de tiempo determinado y recomendamos utilizar el indicador con esa configuración. En modo manual, puede configurar sus propios parámetros. Este es un indicador de múltiples períodos de tiempo (mtf).

El indicador funciona bien con una combinación de otros indicadores nuestros, como el MTF rsi o el MTF cci, o el MACD pro.

Cuanto más volátil sea el instrumento negociado, menor será el período de tiempo que deberá utilizar para encontrar las mejores entradas. ¡Considere siempre una dirección de plazos más altos!

Para hacer eso, debe usar más instancias del indicador.


Entradas
Modo de parámetros: elija entre “Parámetros manuales” o los “Parámetros automáticos” preestablecidos. Los parámetros automáticos están en modo de múltiples períodos de tiempo. Ejemplo: cuando configura el parámetro H1 automático: puede ver la misma pantalla desde el período de tiempo H1 hasta 1 minuto. En esta configuración, el indicador no se mostrará en períodos de tiempo más altos, como H4 o más.
Marco de tiempo manual: cuando se eligió el parámetro manual en el primer menú, aquí puede configurar el marco de tiempo actual o múltiple. Hay tres configuraciones diferentes que puede aplicar cuando elige usar el indicador manualmente. Los llamamos Entrada, Retroceso y Tendencia. Los tres tienen un período de suavizado.
Período de tendencia: este es el más lento y parece un histograma. La tendencia alcista está por encima de la línea 0 y la tendencia bajista está por debajo.
Período de retroceso: este es más rápido que una tendencia y más lento que la entrada, que se muestra como una línea delgada. Además, cuando vaya significativamente en contra de la tendencia, pinte el histograma de tendencia principal con otro color (predeterminado: azul). Cuando comienza a regresar a la dirección de la tendencia, vuelve a cambiar de color (predeterminado: amarillo), para que sepa que la tendencia se está reanudando.
Período de entrada: esta es la configuración más rápida. Mostrando como un histograma con líneas finas, cuando está opuesto al histograma de Tendencia, esto puede mostrarle las oportunidades de entrada. Alerta de flecha: cuando hay una señal para que el instrumento negociado reanude la dirección hacia la tendencia principal, el indicador pinta una flecha en el histograma. Puede establecer sus propios colores y grosor de línea para cada histograma, línea o flecha diferente.
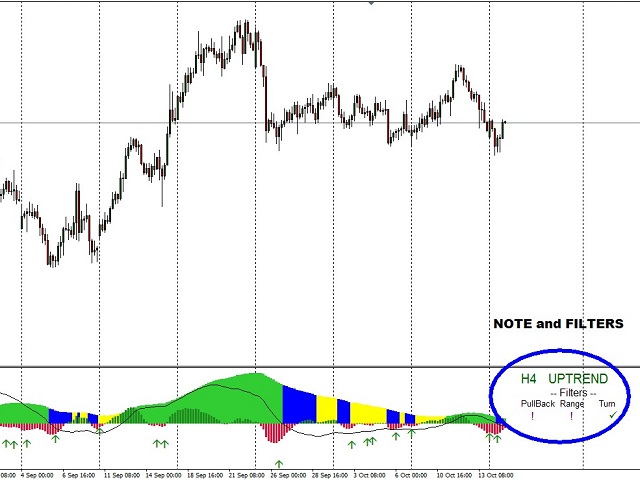
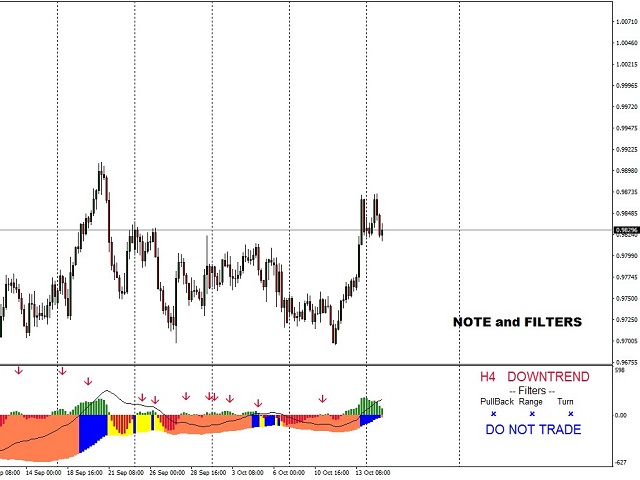
Filtros automáticos: verdadero o falso. Solo con la configuración automática de parámetros, existe la opción de usar filtros para obtener las mejores operaciones. Los filtros se muestran en el lado derecho de la subventana. Hay tres pasos para los filtros.
Retroceso: el instrumento negociado que realiza un retroceso mayor, ¡negocie con precaución! Cuando este filtro le avise, aún podrá operar, pero utilice un stop loss mayor.
Rango: el instrumento negociado ingresa a un territorio de rango, es posible un posible cambio de tendencia. ¡Comercio de mayor riesgo! La dirección puede cambiar en cualquier momento.
Giro: Lo más probable es que la tendencia cambie. ¡No abras operaciones! Cuando este filtro le da un aviso, no recomendamos ingresar a la operación.
Nota del sorteo: verdadero o falso. Cuando sea verdadero, verá una nota al margen: Tendencia alcista o Tendencia bajista.
Alertas:

Alerta de entrada de tendencia: le brinda una alerta cuando aparece una flecha en el histograma.
Pre Alerta: Te da una alerta cuando el histograma de entrada va en contra de la tendencia.
Modo de alerta de filtro: Cuando lo anterior es cierto, aquí puedes elegir qué alerta quieres recibir.
"Solo operaciones seguras" le brinda alertas solo cuando cada filtro sigue la tendencia principal, aquí es donde la tendencia es fuerte.
“Se permiten operaciones de alto riesgo”. Con esta opción, cuando los dos primeros filtros (llamados "Retroceso" y "Rango") muestran una señal de advertencia, aún recibirás alertas.
Cuando el filtro Giro (el tercero desde el lado derecho de la ventana secundaria) muestra una señal de advertencia, no recibirá ninguna alerta.
Además, puede optar por recibir alertas por correo electrónico o notificaciones automáticas.

Si te gusta mi trabajo, apóyame dejando un comentario o calificando mi producto.
Comentarios 2
raiinzen
727
raiinzen 2019.03.31 23:33 
 

Okay, so this was definitely on the pricey side, but I wanted to quickly be able to see trends across different time frames AS WELL AS areas of indecision. This indicator helps me to make smarter moves based upon price action and another indicator that I like. It helps me to decide when a larger time frame trend may be reversing which means it's a great time to get in, (areas of blue indecision) while catching the trend on the smaller time frames. It's very visual, so if you're a visual trader and want confirmations, this is worth it, IMHO.

Note: the only thing I don't love (which is my complaint with 95% of the indicators on this site) is that you are only given 10 activations, and you can't reset the activations, so make SURE you have a VPS picked out and don't go switching VPSs often, or you'll run out of your 10 pretty quickly. I'm going to get 2 new computers soon, so if I'm not careful, I could run out of those 10 activations pretty quickly. I wish it was more like 20, taking in account that VPSs suck and need to be changed frequently.

Productos recomendados
The Th3Eng PipFinite indicator is based on a very excellent analysis of the right trend direction with perfect custom algorithms. It show the true direction and the best point to start trading. With StopLoss point and Three Take Profit points. Also it show the right pivot of the price and small points to order to replace the dynamic support and resistance channel, Which surrounds the price. And Finally it draws a very helpful Box on the left side on the chart includes (take profits and Stop loss
Retroceso de Fibonacci & Herramientas de Dibujo de Líneas Extendidas Retroceso de Fibonacci & Herramientas de Dibujo de Líneas Extendidas son aptos para la plataforma MT4 y para operadores que emplean el método de negociación de puntos y la negociación de sección áurea. Ventajas: Sin líneas excusadas ni las excesivamente largas, y es fácil de observar y descubrir oportunidades de negociación. Versión de prueba: https://www.mql5.com/zh/market/product/35884 Funciones principales: 1.
Cosmic Diviner X Planet
Olena Kondratenko
4 (2)
This unique multi-currency strategy simultaneously determines the strength of trends and market entry points, visualizing this using histograms on the chart. The indicator is optimally adapted for trading on the timeframes М5, М15, М30, Н1. For the convenience of users, the indicator renders the entry point (in the form of an arrow), recommended take profit levels (TP1, TP2 with text labels) and the recommended Stop Loss level. The take profit levels (TP1, TP2) are automatically calculated for
Blahtech Market Profile
Blahtech Limited
4.61 (18)
Was: $249  Now: $99   Market Profile defines a number of day types that can help the trader to determine market behaviour. A key feature is the Value Area, representing the range of price action where 70% of trading took place. Understanding the Value Area can give traders valuable insight into market direction and establish the higher odds trade. It is an excellent addition to any system you may be using. Blahtech Limited presents their Market Profile indicator for the MetaTrader community. Ins
Strong Retracement Points Pro demo edition! SRP (Strong Retracement/Reversal Points) is a powerful and unique support and resistance indicator. It displays the closest important levels which we expect the price retracement/reversal! If all level are broken from one side, it recalculates and draws new support and resistance levels, so the levels might be valid for several days depending on the market! If you are still hesitating to start using this wonderful tool, you can check this link to see h
Daily Candle Predictor es un indicador que predice el precio de cierre de una vela. El indicador está destinado principalmente para su uso en gráficos D1. Este indicador es adecuado tanto para el comercio de divisas tradicional como para el comercio de opciones binarias. El indicador se puede utilizar como un sistema de negociación independiente o puede actuar como una adición a su sistema de negociación existente. Este indicador analiza la vela actual, calculando ciertos factores de fuerza dent
Night ghost
Dmitriy Kashevich
Night Ghost - Indicador de flecha para opciones binarias. ¡Este es un asistente confiable para usted en el futuro! - Sin redibujar en el gráfico -¡Funciona muy bien en todos los pares de divisas! -Indicador de precisión de hasta el 90% (Especialmente de noche) -No es necesario configurar durante mucho tiempo (configurar perfectamente para opciones binarias) - Señales no tardías - La aparición de una señal en la vela actual. -Perfecto para el período M1 (¡No más!) - Color de ve
Buy and sell zones
Evgeniy Zhdan
5 (3)
Indicador para determinar plano y tendencia. Si el precio está por debajo de cualquiera de los dos histogramas y dos líneas (rojo y azul), esta es una zona de venta. Al comprar esta versión del indicador, la versión MT4 para una cuenta real y una demo, ¡como regalo (para recibir, escríbame un mensaje privado)! Si el precio está por encima de cualquiera de los dos histogramas y dos líneas (rojo y azul), esta es una zona de compra. Versión MT4:   https://www.mql5.com/en/market/product/3793
VR Cub
Vladimir Pastushak
VR Cub es un indicador para obtener puntos de entrada de alta calidad. El indicador fue desarrollado para facilitar los cálculos matemáticos y simplificar la búsqueda de puntos de entrada a una posición. La estrategia comercial para la cual se diseñó el indicador ha demostrado su eficacia durante muchos años. La simplicidad de la estrategia comercial es su gran ventaja, que permite que incluso los operadores novatos negocien con éxito con ella. VR Cub calcula los puntos de apertura de posiciones
Gioteen Volatility Index (GVI)   - your ultimate solution to overcoming market unpredictability and maximizing trading opportunities. This revolutionary indicator helps you in lowering your losing trades due to choppy market movements. The GVI is designed to measure market volatility, providing you with valuable insights to identify the most favorable trading prospects. Its intuitive interface consists of a dynamic red line representing the volatility index, accompanied by blue line that indicat
Initial Balance Target Strategy is an indicator based on Fibonacci Levels. Its graphics flexibility allows you to adapt very well to your strategies or Trading System setting it with levels in input. The analysis of the time range allows replication of strategies as London Breakout and Kiss . The indicator is fully customizable, you can change colors, texts and percentages of Target. The simplicity and manageability of this indicator makes it an useful tool for all Intraday Trader . Input Valu
Master Scalping M1 es un indicador innovador que utiliza un algoritmo para determinar la tendencia de forma rápida y precisa. El indicador calcula el tiempo de apertura y cierre de posiciones, los algoritmos del indicador le permiten encontrar los momentos ideales para ingresar a una operación (comprar o vender un activo), lo que aumenta el éxito de las transacciones para la mayoría de los comerciantes. Beneficios del indicador: Fácil de usar, no sobrecarga el gráfico con información innecesari
Ante todo, vale la pena enfatizar que esta Herramienta de Trading es un Indicador No Repintado, No Redibujado y No Retrasado, lo que la hace ideal para el trading profesional. Curso en línea, manual del usuario y demostración. El Indicador de Conceptos de Acción del Precio Inteligente es una herramienta muy potente tanto para traders nuevos como experimentados. Combina más de 20 indicadores útiles en uno solo, combinando ideas avanzadas de trading como el Análisis del Trader del Círculo Interio
TPA True Price Action indicator reveals the true price action of the market makers through 100% non-repainting signals (except early signals mode) strictly at the close of a candle! TPA shows entries and re-entries, every time the bulls are definitely stronger than the bears and vice versa. Not to confuse with red/green candles. The shift of power gets confirmed at the earliest stage and is ONE exit strategy of several. There are available now two free parts of the TPA User Guide for our custo
Noize Absorption Index MT4
Ekaterina Saltykova
5 (1)
Noize Absorption Index - is the manual trading system that measures the difference of pressure between bears forces and bulls forces. Green line - is a noize free index that showing curent situation. Zero value of index shows totally choppy/flat market.Values above zero level shows how powerfull bullish wave is and values below zero measures bearish forces.Up arrow appears on bearish market when it's ready to reverse, dn arrow appears on weak bullish market, as a result of reverse expectation. S
Forex Gump
Andrey Kozak
2.83 (6)
Forex Gump is a fully finished semi-automatic trading system. In the form of arrows, signals are displayed on the screen for opening and closing deals. All you need is to follow the instructions of the indicator. When the indicator shows a blue arrow, you need to open a buy order. When the indicator shows a red arrow, you need to open a sell order. Close orders when the indicator draws a yellow cross. In order to get the most effective result, we recommend using the timeframes H1, H4, D1. There
Binary Options Support Resistance Indicator This indicator is designed for binary options trading and effectively shows retracements from support and resistance levels. Signals appear on the current candle. A red arrow pointing downwards indicates a potential selling opportunity, while a blue arrow pointing upwards suggests buying opportunities. All that needs adjustment is the color of the signal arrows. It is recommended to use it on the M1-M5 timeframes as signals are frequent on these timef
To download MT5 version please click  here . This is the exact conversion from TradingView: "WaveTrend [LazyBear]" By "zeusuk3". One of the coolest indicators out there to detect overbought and oversold zones. It can be used as a part of more complicated strategy and for confirming a potential trade setup. There are buffers to use in EAs also. The indicator is loaded light and non-repaint. - You can message in private chat for further changes you need. Thanks for downloading 
The trading statistics indicator notifies the trader of the aggregate income of the trading account for different time intervals. The indicator has wide display settings on the graph. There is a choice of one of the two display languages on the chart- English and Russian. Settings Indicator language (ENG, RUS) - Select the language to display on the chart; To control the magic (-1: any magic) - Entering the Magic for control (-1: any Magic); Angle of indicator tie - Selecting the angle of the
ZhiBiMACD MT4
Qiuyang Zheng
4.5 (2)
Este es un indicador MACD único que es más preciso y fácil de usar que el MACD tradicional. Es adecuado para cualquier ciclo de gráfico y es adecuado para cualquier variedad de mercado. La columna roja es la señal de banda (Comprar) y la columna azul es la señal de banda (Vender). Las líneas amarillas y verdes son líneas de tendencia, y las dos líneas nunca se cruzan. Compre: en la columna azul, mire la línea verde hacia arriba a través del eje 0 central. Venta: en la columna roja, mire
Le presentamos el indicador "Candle closing counter", que se convertirá en su asistente indispensable en el mundo del trading. Es por eso que saber cuándo se cerrará la vela puede ayudar: Si usted tiene gusto de negociar usando patrones de la vela, usted sabrá cuando la vela será cerrada. Este indicador le permitirá comprobar si se ha formado un patrón conocido y si hay una posibilidad de negociación. El indicador le ayudará a prepararse para la apertura del mercado y el cierre del mercado.
Dark Sniper
Dmitriy Kashevich
Dark Sniper pointer indicator.  Complete absence of redrawing   The percentage of correct indicator forecasts depends on your settings; the default is period 7 (performed better) The arrow indicates the direction of the next candle and the possible direction of the trend in the future.  Suitable for small timeframes m1 and m5  It is recommended to open transactions from 1 to 2 candles.  The signal appears on the current candle. Open a trade on the next one since the signal is being ge
PipFinite Exit EDGE
Karlo Wilson Vendiola
4.89 (160)
Did You Have A Profitable Trade But Suddenly Reversed? In a solid strategy, exiting a trade is equally important as entering. Exit EDGE helps maximize your current trade profit and avoid turning winning trades to losers. Never Miss An Exit Signal Again Monitor all pairs and timeframes in just 1 chart www.mql5.com/en/blogs/post/726558 How To Trade You can close your open trades as soon as you receive a signal Close your Buy orders if you receive an Exit Buy Signal. Close your Sell orde
This is the FXTraderariel-TakeProfit - Stop Loss Indicator . It provides you 3 potential Take Profits and 1 Stop Loss. These potential targets are computed based on several methods . The indicator can be used on every time frame, but we advise to use it on H1, H4 and D1. Especially if you are a novice trader. Pro Traders can also you use it for scalping in smaller time frames (M1, M5 and M15). This indicator is not a complete trading system. It doesn't provide you a Signal nor can predict the m
Dr Trend
Vitalii Zakharuk
Dr Trend is a trend indicator for the MetaTrader 4 trading platform. This indicator allows you to find the most likely trend reversal points. You won’t find a proprietary indicator like this anywhere else. A simple but effective system for determining the Forex trend. From the screenshots you can see for yourself the accuracy of this tool. Works on all currency pairs, stocks, commodities, cryptocurrencies. Are you already tired of constant ups and downs? You shouldn’t fall victim to unstable
Title : Market Bias Indicator - Oscillator-Based Trading Tool Introduction : Discover the potential of the "Market Bias Indicator," a revolutionary oscillator-based trading tool designed for precise market analysis. If you're in search of a robust alternative to traditional bias indicators, your quest ends here. Market Bias Indicator offers unparalleled accuracy in identifying market sentiment and is your gateway to confident trading decisions. Recommended Trading Pairs : Market Bias Indicator i
The principle of this indicator is very simple: detecting the trend with Moving Average, then monitoring the return point of graph by using the crossing of Stochastic Oscillator and finally predicting BUY and SELL signal with arrows, alerts and notifications. The parameters are fixed and automatically calculated on each time frame. Example: If you install indicator on EURUSD, timeframe M5: the indicator will detect the main trend with the Moving Average on this timeframe (for example the Moving
This indicator is another variant of the famous powerful indicator Fibonacci-SS https://www.mql5.com/en/market/product/10136 but has different behaviour in placing Pending Order and TP Line. Automatically places Fibonacci retracement lines from the last highest and lowest visible bars on the chart with: An auto Pending Order (Buy/Sell). Taking Profit 1, Taking Profit 2 is pivot point and Taking Profit 3 for extended reward opportunity. The best risk and reward ratio. Simple and powerful indica
TS krachobor
Magomed Zakaryaev
Всем привет! Выставляю свою торговую стратегию для форекс (далее - ТС). После покупки или аренды ТС пишете мне, я вас добавляют в закрытый чат телеграм, где дам все индикаторы и поддержку по торговле, и мы вместе будем торговать. Статистику по торговле в ТС я добавлю чуть позже, так как открыл новый счет по ТС, что бы было наглядно как проходит торговля. Кроме этого  я дам счет и пароль инвестора, можете сами смотреть в живую торговлю и решить для себя подходит ли она для вас. Два режима, 1) Сре
Delta Pairs
Anatolii Zainchkovskii
1 (1)
Delta Pairs is an indicator for pair trading, it displays the divergence of two currency pairs. Does not redraw. A useful tool for the analysis of the behavior of two currency pairs relative to each other. Purpose The Delta Pairs indicator is designed for determining the divergences in the movements of two currency pairs. This indicator is displayed as two line charts and the difference (delta) between these charts in the form of a histogram. The Delta Pairs indicator will be useful for those
Los compradores de este producto también adquieren
TPSpro RFI Levels
Roman Podpora
4.84 (19)
Reversal First Impulse levels (RFI)    INSTRUCTIONS        RUS       -       ENG              R ecommended to use with an indicator   -   TREND PRO -  Version MT5 A key element in trading is zones or levels from which decisions to buy or sell a trading instrument are made. Despite attempts by major players to conceal their presence in the market, they inevitably leave traces. Our task was to learn how to identify these traces and interpret them correctly. Main functions: Displaying active zones
Enigmera
Ivan Stefanov
5 (3)
ENIGMERA: El núcleo del mercado https://www.enigmera.com Introducción Este indicador y sistema de negociación es un enfoque extraordinario de los mercados financieros. ENIGMERA utiliza los ciclos fractales para calcular con precisión los niveles de soporte y resistencia. Muestra la auténtica fase de acumulación y proporciona dirección y objetivos.  Un sistema que funciona tanto si estamos en una tendencia como en una corrección.  ¿Cómo funciona? ENIGMERA consta de tres líneas: la línea de s
Scalper Inside PRO
Alexey Minkov
4.74 (58)
An exclusive indicator that utilizes an innovative algorithm to swiftly and accurately determine the market trend. The indicator automatically calculates opening, closing, and profit levels, providing detailed trading statistics. With these features, you can choose the most appropriate trading instrument for the current market conditions. Additionally, you can easily integrate your own arrow indicators into Scalper Inside Pro to quickly evaluate their statistics and profitability. Scalper Inside
TPSproTREND PrO
Roman Podpora
4.78 (18)
TPSpro TRENDPRO  - is a trend indicator that automatically analyzes the market and provides information about the trend and each of its changes, as well as giving signals for entering trades without redrawing! The indicator uses each candle, analyzing them separately. referring to different impulses - up or down impulse. Exact entry points into transactions for currencies, crypto, metals, stocks, indices!  -  Version MT5               DETAILED DESCRIPTION                R ecommended to use with
Atomic Analyst
Issam Kassas
5 (3)
En primer lugar, vale la pena enfatizar que este Indicador de Trading no repinta, no redibuja y no se retrasa, lo que lo hace ideal tanto para el trading manual como para el automatizado. Manual del usuario: configuraciones, entradas y estrategia. El Analista Atómico es un Indicador de Acción del Precio PA que utiliza la fuerza y el impulso del precio para encontrar una mejor ventaja en el mercado. Equipado con filtros avanzados que ayudan a eliminar ruidos y señales falsas, y aumentan el poten
FX Volume
Daniel Stein
4.6 (35)
Obtenga su actualización diaria del mercado con detalles y capturas de pantalla a través de nuestro Morning Briefing aquí en mql5 y en Telegram ! FX Volume es el PRIMER y ÚNICO indicador de volumen que proporciona una visión REAL del sentimiento del mercado desde el punto de vista de un bróker. Proporciona una visión impresionante de cómo los participantes institucionales del mercado, como los brokers, están posicionados en el mercado Forex, mucho más rápido que los informes COT. Ver esta info
TrendMaestro
Stefano Frisetti
5 (3)
note: this indicator is for METATRADER4, if you want the version for METATRADER5 this is the link:  https://www.mql5.com/it/market/product/108106 TRENDMAESTRO ver 2.4 TRENDMAESTRO recognizes a new TREND in the bud, he never makes mistakes. The certainty of identifying a new TREND is priceless. DESCRIPTION TRENDMAESTRO identifies a new TREND in the bud, this indicator examines the volatility, volumes and momentum to identify the moment in which there is an explosion of one or more of these data a
¡Actualmente 20% OFF ! ¡La mejor solución para cualquier novato o trader experto! Este software funciona con 28 pares de divisas. Se basa en 2 de nuestros principales indicadores (Advanced Currency Strength 28 y Advanced Currency Impulse). Proporciona una gran visión general de todo el mercado de divisas. Muestra los valores de Advanced Currency Strength, la velocidad de movimiento de las divisas y las señales para 28 pares de divisas en todos los (9) marcos temporales. Imagine cómo mejorar
Introduciendo       Indicador Quantum Trend Sniper   , el innovador indicador MQL5 que está transformando la forma en que identificas y negocias los cambios de tendencia. Desarrollado por un equipo de comerciantes experimentados con experiencia comercial de más de 13 años,       Indicador de francotirador de tendencia cuántica       está diseñado para impulsar su viaje comercial a nuevas alturas con su forma innovadora de identificar cambios de tendencia con una precisión extremadamente alta.
GOLD Impulse with Alert
Bernhard Schweigert
4.56 (9)
Este indicador es una super combinación de nuestros 2 productos Advanced Currency IMPULSE with ALERT  +   Currency Strength Exotics . ¡Funciona para todos los marcos de tiempo y muestra gráficamente el impulso de fuerza o debilidad para las 8 divisas principales más un Símbolo! Este Indicador está especializado en mostrar la aceleración de la fuerza de la divisa para cualquier símbolo como Oro, Pares Exóticos, Materias Primas, Índices o Futuros. Es el primero de su clase, cualquier símbol
Quantum Breakout Indicator PRO
Bogdan Ion Puscasu
4.96 (26)
Introduciendo       Quantum Breakout PRO   , el innovador indicador MQL5 que está transformando la forma en que comercia con Breakout Zones. Desarrollado por un equipo de operadores experimentados con experiencia comercial de más de 13 años,   Quantum Breakout PRO   está diseñado para impulsar su viaje comercial a nuevas alturas con su innovadora y dinámica estrategia de zona de ruptura. El indicador de ruptura cuántica le dará flechas de señal en las zonas de ruptura con 5 zonas objetivo de
How to use Pair Trading Station Pair Trading Station is recommended for H1 time frame and you can use it for any currency pairs. To generate buy and sell signal, follow few steps below to apply Pair Trading Station to your MetaTrader terminal. When you load Pair Trading Station on your chart, Pair Trading station will assess available historical data in your MetaTrader platforms for each currency pair. On your chart, the amount of historical data available will be displayed for each currency pai
El indicador " ZigZag on Trend " es un asistente para determinar la dirección del movimiento del precio, así como una calculadora de barras y pips. Consiste en un indicador de tendencia que monitorea la dirección del precio con una línea de tendencia presentada en forma de zigzag y un contador que calcula el número de barras pasadas en la dirección de la tendencia y el número de puntos en una escala vertical. (Los cálculos se realizan mediante la apertura de la barra) El indicador no se vuelve a
RelicusRoad Pro
Relicus LLC
4.76 (139)
Ahora $ 147 (aumentando a $ 499 después de algunas actualizaciones) - Cuentas ilimitadas (PC o Mac) Manual de usuario de RelicusRoad + Videos de capacitación + Acceso al grupo privado de Discord + Estado VIP UNA NUEVA MANERA DE VER EL MERCADO RelicusRoad es el indicador comercial más poderoso del mundo para divisas, futuros, criptomonedas, acciones e índices, y brinda a los comerciantes toda la información y las herramientas que necesitan para mantenerse rentables. Brindamos análisis téc
Supply and Demand Dashboard PRO
Bernhard Schweigert
4.82 (22)
¡Actualmente 20% OFF ! Este tablero de instrumentos es una pieza muy poderosa de software de trabajo en múltiples símbolos y hasta 9 marcos de tiempo. Se basa en nuestro indicador principal (Mejores críticas: Advanced Supply Demand ).  El tablero de instrumentos da una gran visión general. Se muestra:  Valores filtrados de Oferta y Demanda, incluyendo la calificación de fuerza de la zona, Pips distancias a / y dentro de las zonas, Destaca las zonas anidadas, Da 4 tipos de alertas para los s
Backtest with good trend detection results from January 2023 EURUSD Time frame: m15, m30, H1 AUDUSD Time frame: m15, m30 NASDAQ Time frame: m15 S&P 500 Time frame: m15, m30 XAUUSD Time frame: m30 BTCUSD Time frame: H4 These are just some of the assets tested (Please note that past results are no guarantee of future results). Note that this is not a complete strategy, you can use this indicator as an entry trigger after your analysis by setting stop loss and take profit values ​​that you d
Volatility Trend System - un sistema de comercio que da señales para las entradas. El sistema de volatilidad da señales lineales y puntuales en la dirección de la tendencia, así como señales para salir de ella, sin redibujar ni demoras. El indicador de tendencia monitorea la dirección de la tendencia a mediano plazo, muestra la dirección y su cambio. El indicador de señal se basa en cambios en la volatilidad y muestra entradas en el mercado. El indicador está equipado con varios tipos de ale
PZ Trend Trading
PZ TRADING SLU
4.75 (4)
Trend Trading es un indicador diseñado para sacar el máximo provecho posible de las tendencias que tienen lugar en el mercado, mediante el cronometraje de retrocesos y rupturas. Encuentra oportunidades comerciales al analizar qué está haciendo el precio durante las tendencias establecidas. [ Guía de instalación | Guía de actualización | Solución de problemas | FAQ | Todos los productos ] Opere en los mercados financieros con confianza y eficiencia Aproveche las tendencias establecidas sin s
NAM Order Blocks
NAM TECH GROUP, CORP.
5 (1)
Indicador de detección de Order Blocks multitimeframe para MT4. Características - Panel de control totalmente personalizable, proporciona una interacción completa. - Oculta y muestra el panel de control donde quieras. - Detecta OB en múltiples marcos de tiempo. - Permite seleccionar la cantidad de OB para mostrar. - Interfaz de usuario de diferentes OBs. - Diferentes filtros de OBs (regulares, rejection y sin capitalizar). - Alerta de proximidad de OBs. - Líneas ADR High y Low. - Servicio de not
ALERTA DE COMPRA Y VENTA MULTIDIVISA y MULTITIMEFRAME. ¡STOP DE TRAILING AUTOMÁTICO Y TOMA DE BENEFICIOS DE RECOMPENSA DE RIESGO! ¡EL INDICADOR ESCANEA Y ANALIZA EL MERCADO PARA QUE NO TENGAS NADA QUE HACER! ¡COMERCIA TODAS TUS MONEDAS EN 1 GRÁFICO!   Después de la compra, deje un comentario, contácteme y le enviaré el asistente comercial EA. El indicador utiliza varios osciladores y filtros adjuntos para encontrar los mejores puntos de entrada CONFIRMADOS, ¡así que no necesita preocupars
Entry Points Pro
Yury Orlov
4.7 (225)
Este es un genial indicador para MT4 que ofrece señales precisas para entrar en una transacción sin redibujar. Se puede aplicar a cualquier activo financiero: fórex, criptomonedas, metales, acciones, índices. Nos dará valoraciones bastante precisas y nos dirá cuándo es mejor abrir y cerra una transacción. Eche un vistazo  al vídeo  (6:22), ¡contiene un ejemplo de procesamiento de una sola señal que ha amortizado el indicador! La mayoría de los tráders mejoran sus resultados comerciales durante l
Gann Swing Structure
Kirill Borovskii
5 (1)
This indicator is based on the mathematics of the great trader W.D. Ganna. With its help, you can easily find strong levels by analyzing swings to find the optimal entry point. The indicator works on all instruments and all timeframes. The indicator is fully manual and has control buttons. All you need to do is press the NEW button, a segment will appear, which you can place on any movement, swing or even 1 candle that you want to analyze. By placing the segment, press the OK button. A grid (th
Limitless MT4
Dmitriy Kashevich
El MT4 ilimitado es un indicador universal adecuado para todos los operadores principiantes y experimentados. funciona en todos los pares de divisas, criptomonedas, acciones en bruto MT4 ilimitado: ya está configurado y no requiere configuración adicional Y ahora lo principal ¿Por qué MT4 ilimitado? 1 falta total de redibujo 2 dos años de pruebas por los mejores especialistas en comercio 3 la precisión de las señales correctas supera el 80% 4 tuvo un buen desempeño en el comerci
Royal Wave Pro M4
Vahidreza Heidar Gholami
5 (3)
Royal Wave is a Trend-Power oscillator which has been programmed to locate and signal low-risk entry and exit zones. Its core algorithm statistically analyzes the market and generates trading signals for overbought, oversold and low volatile areas. By using a well-designed alerting system, this indicator makes it easier to make proper decisions regarding where to enter and where to exit trades. Features Trend-Power Algorithm Low risk Entry Zones and Exit Zones Predictions for Overbought and Over
Por supuesto, aquí tienes la traducción al español: Presentamos el Indicador de Astronomía para MT4: Tu Compañero Celestial Definitivo en el Trading ¿Estás listo para elevar tu experiencia de trading a alturas celestiales? No busques más allá de nuestro revolucionario Indicador de Astronomía para MT4. Esta innovadora herramienta trasciende los indicadores de trading tradicionales, aprovechando el poder de algoritmos complejos para proporcionarte una visión astronómica sin igual y cálculos de pre
The indicator of a Professional Trader is an arrow indicator for predicting the direction of price movement. I have been working on this indicator since 2014. You can use this indicator as your main indicator, use its entry signals, and use it as your only indicator to find entry points. About the product: Recommended TF [H4-D1-W1]   . The indicator predicts the direction of the next candle. Fits a variety of tools; Flexibility in settings for different instruments and intervals through the
Volume by Price MT4
Brian Collard
4.71 (14)
The Volume by Price Indicator for MetaTrader 4 features Volume Profile and Market Profile TPO (Time Price Opportunity). Volume and TPO histogram bar and line charts. Volume Footprint charts. TPO letter and block marker collapsed and split structure charts. Session filtering and grouping. Static, dynamic and flexible range segmentation and compositing methods with relative and absolute visualizations. Graphical layering, positioning and styling options to suit the user's analytic and aesthetic n
ECM Channel MT4
Paulo Rocha
5 (1)
ECM Elite Channel is a volatility-based indicator, developed with a specific time algorithm, which consists of finding possible corrections in the market. This indicator shows two outer lines, an inner line (retracement line) and an arrow sign, where the channel theory is to help identify overbought and oversold conditions in the market. The market price will generally fall between the boundaries of the channel. If prices touch or move outside the channel, it's a trading opportunity. The
Full Forex Market View Dashboard
Opengates Success International
5 (2)
VISTA COMPLETA DEL MERCADO FOREX Indicador del tablero Este es un indicador personalizado creado para brindar a los comerciantes una visión completa de lo que está sucediendo en el mercado. Utiliza datos en tiempo real para acceder al mercado y mostrar toda la información necesaria para realizar transacciones exitosas. INSTALACIÓN: Antes de adjuntar este indicador a su gráfico de ventana, vaya al panel Market Watch de su MT4 y OCULTE todos los pares de divisas que no necesita ni opere y
Indicator : RealValueIndicator Description : RealValueIndicator is a powerful tool designed specifically for trading on the EURUSD pair. This indicator analyzes all EUR and USD pairs, calculates their real currency strength values, and displays them as a single realistic value to give you a head start on price. This indicator will tell you moves before they happen if you use it right. RealValueIndicator allows you to get a quick and accurate overview of the EURUSD currency pair tops and bottoms,
Otros productos de este autor
EZT Macd Pro
Tibor Rituper
5 (4)
Descripción del programa Este indicador puede mostrar 1 o 2 indicadores MACD en diferentes marcos de tiempo y configuraciones. Existe una versión GRATUITA que utiliza EMA para el cálculo. Esta versión Pro utiliza los 4 tipos de media móvil para el cálculo: simple, exponencial, suavizada y ponderada lineal. Los indicadores activos pueden emitir alertas emergentes, sonoras, push o por correo electrónico. La alerta de la versión gratuita solo en cruce de nivel cero, esta alerta de versión Pro se p
The FREE version works on Demo account and only CADCHF and NZDCHF pairs. The indicator predict the future candles direction, by scanning past candle movement. Based on the principal: “ The history repeat itself”. Programmed according to Kendall Correlation. In the settings menu, different scanning options are available. When the indicator find a match, start painting future candles from the current candle to the right, also from the current candle to the left as well, showing you the candle
FREE
EZT MultiTF MACD
Tibor Rituper
5 (8)
This indicator can display 1 or 2 MACD indicator on different time-frames and settings. Uses EMA for calculation. The active indicators can give visual and sound alert on zero-level-cross if the user choose that option. Alert can be set on one or both active indicator, even if the time-frame, and the period different on each. When alert set to both, the two MACD histogram must be on the same size of the 0 level to get an arrow. There is a display panel with buttons on the main chart, what is sho
FREE
EZT Bollinger Trendline Indicator based on multiple settings of Bollinger Band. In the menu you can choose the similar settings than bollinger band indicator. Trend period and trend deviations. Also paint and arrow on chart when direction change. Three different kind of alert , such as pop up, e-mail and push notification. Try different settings on different timeframes. Please help my work and rate and comment my products!
FREE
This is a free version of our Great tool with limited functions. The ChartChanger is a great utility tool to reduce the number of open charts on your terminal. There is three section to it: Symbols, Time frames and Templates. You need only one chart to be open and still you can scroll up to multiple ones. Symbols: With the push of a button you can change from one symbol to another, and your applied indicators will stay on the next chart. For the symbols there is an auto detection mode, or you ca
FREE
This indicator can display 1-6 RSI indicator on different timeframes and settings. The active indicators can give visual and sound alert on oversold/overbought level if the user choose that option. Alert can be set on one or all active indicator, even if the timeframe, the period and the oversold/overbought level different on each.There is a display panel with buttons on the main chart, what is show the active indicators and their settings.There is an option to hide this panel. With the buttons
This indicator can display 1-3 CCI indicator on different time frames and settings. The active indicators can give visual and sound alert on oversold/overbought level if the user choose that option. Alert can be set on one or all active indicator, even if the time frame, the period and the oversold/overbought level different on each. There is a display panel with buttons on the main chart, what is show the active indicators and their settings. There is an option to hide this panel. With the butt
ChartChanger es una gran herramienta de utilidad para reducir la cantidad de gráficos abiertos en su terminal. Tiene tres secciones: Símbolos, Marcos de tiempo y Plantillas. Solo necesita que haya un gráfico abierto y aun así puede desplazarse hasta varios. Símbolos: con solo presionar un botón, puede cambiar de un símbolo a otro y los indicadores aplicados permanecerán en el siguiente gráfico. Para los símbolos hay un modo de detección automática, o puede ingresar manualmente los que desee. Pue
Este es un indicador de alerta de barra de pines de marco de tiempo múltiple. Puede utilizarlo solo en el período de tiempo actual o en todos los períodos de tiempo, desde 1 minuto hasta el mensual. Cuando elige todos los marcos de tiempo, recibe una alerta sobre el marco de tiempo actual en el que está abierto su gráfico y los marcos de tiempo anteriores. Hay alertas de notificaciones emergentes, por correo electrónico y push para cada período de tiempo elegido por separado. El indicador
Este es un indicador de alerta de vela envolvente de múltiples períodos de tiempo. Puede utilizarlo solo en el período de tiempo actual o en todos los períodos de tiempo, desde 1 minuto hasta el mensual. Este es un indicador MTF que no se repinta. Cuando utiliza la opción de períodos de tiempo seleccionados (modo MultiTimeframe), puede ver señales en el período de tiempo actual y superior. Hay alertas de notificaciones emergentes, por correo electrónico y push para cada período de tiempo
This is a great utility tool to see valuable information on your chart. The panel is free-floating, grab with your mouse and move around on the chart with ease. Also the panel is collapsible so you can save space, and you can see only the information you wish. There is three section to the panel, when is closed you can see the top section only. Here the list of information you can see on the panel, from the top to bottom: The first part of the panel: Price : The color is changing according to
EZT Stochastic
Tibor Rituper
5 (2)
EZT_Stochastic   This is a Multi Timeframe stochastic indicator, with colored background. The colored background can be set to different colors based on the K and D line, (moving up, or down), and also about the position of the lines. In the oversold or overbought zones you can choose different colors.   Settings: You can choose the time-frame you want to see the stochastic. Set the regular parameters in a same way like in the original stochastic. Histogram style: The style. Histogram width: The
EZT_Ichimoku_MTF Multitimeframe Ichimoku indicator. Display up to 4 different Ichimoku on the chart. Every line of every ichimoku is customizable, you can turn off/on or choose different thickness or color. You can choose to see only the cloud in multiple ichimokus. Optional info panel to identify the different Ichimokus. Works the same way like the original Ichimoku indicator.
EZT Trade History This is a great tool to analyze past trades or follow current ongoing trades, especially when you using an EA to manage your transactions. You will see the exact candle where the trade was opened and closed. Collapsible floating panel on the chart, free to move anywhere with your mouse. When you using multiple EA’s with different magic numbers, you have 5 options to separate those trades, so you will know which EA opened specific transactions. You can set the day limits how fa
The indicator predict the future candles direction, by scanning past candle movement. Based on the principal: “ The history repeat itself”. Programmed according to Kendall Correlation. In the settings menu, different scanning options are available. When the indicator find a match, start painting future candles from the current candle to the right, also from the current candle to the left as well, showing you the candle pattern what the actual signal is based on. The left side candle are option
Filtro:
adonis4ex
6308
adonis4ex 2021.07.14 22:52 
 

El usuario no ha dejado ningún comentario para su valoración

raiinzen
727
raiinzen 2019.03.31 23:33 
 

Okay, so this was definitely on the pricey side, but I wanted to quickly be able to see trends across different time frames AS WELL AS areas of indecision. This indicator helps me to make smarter moves based upon price action and another indicator that I like. It helps me to decide when a larger time frame trend may be reversing which means it's a great time to get in, (areas of blue indecision) while catching the trend on the smaller time frames. It's very visual, so if you're a visual trader and want confirmations, this is worth it, IMHO.

Note: the only thing I don't love (which is my complaint with 95% of the indicators on this site) is that you are only given 10 activations, and you can't reset the activations, so make SURE you have a VPS picked out and don't go switching VPSs often, or you'll run out of your 10 pretty quickly. I'm going to get 2 new computers soon, so if I'm not careful, I could run out of those 10 activations pretty quickly. I wish it was more like 20, taking in account that VPSs suck and need to be changed frequently.

Respuesta al comentario
Versión 1.21 2024.01.04
bugs fixed
Versión 1.2 2021.11.24
Compatibility update