• Información general
  • Comentarios
  • Discusión

AIS Simple Linear Smoothing

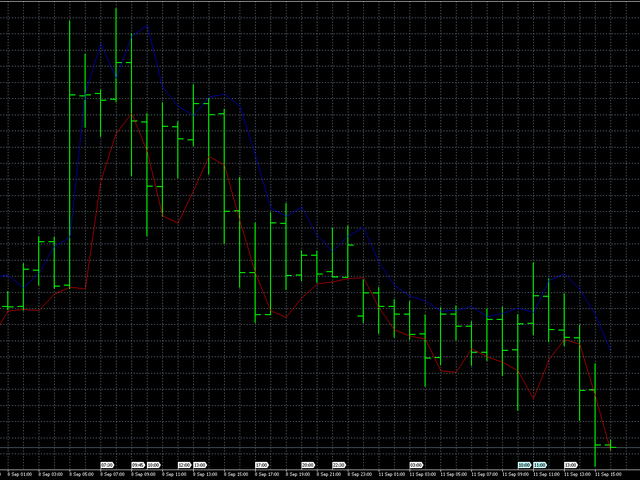
Este indicador implementa un proceso de suavizado lineal simple.

Una de las desventajas del suavizado exponencial es el rápido decaimiento de la señal. Esto hace que sea imposible realizar un seguimiento completo de las tendencias a largo plazo en el rango de precios. El suavizado lineal le permite ajustar con mayor precisión y precisión el filtrado de la señal.

El indicador se configura seleccionando parámetros:

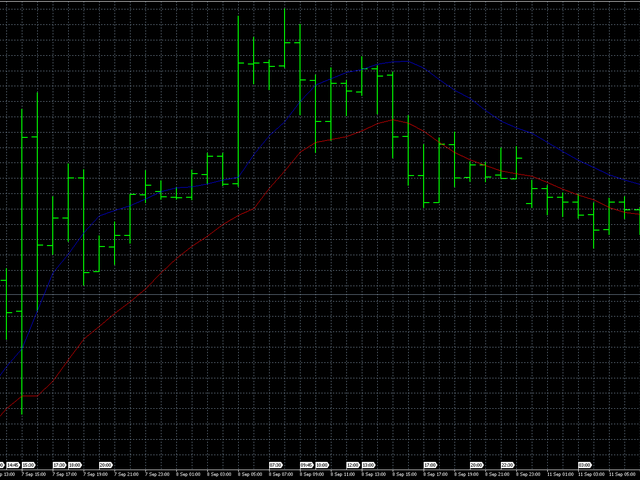
LP: este parámetro le permite seleccionar el período de suavizado. Cuanto mayor sea su valor, más tendencias a largo plazo muestra el indicador. El valor válido es 0 - 255.
SP: este parámetro afecta la sensibilidad del indicador. Cuanto mayor sea este parámetro, mayor será la influencia de los últimos valores de la serie de precios. Si el valor de este parámetro es cero, entonces el indicador muestra una media móvil simple con un período igual a LP+1. El valor válido es 0 - 255.
Productos recomendados
Dynamic SR Trend Channel Dynamic SR Trend Channel is a simple indicator for trend detection as well as resistance/support levels on the current timeframe. It shows you areas where to expect possible change in trend direction and trend continuation. It works with any trading system (both price action and other trading system that use indicators) and is also very good for renko charting system as well. In an uptrend, the red line (main line) serves as the support and the blue line serves as the
Indicador Forex "Sobres HTF" para MT4 Actualice sus métodos comerciales con los sobres HTF profesionales para MT4. HTF significa - Marco de tiempo más alto Sobres es uno de los mejores indicadores de tendencias del mercado: herramienta perfecta para operar Se utiliza para ayudar a los operadores a identificar condiciones extremas de sobrecompra y sobreventa, así como rangos de negociación. El indicador HTF Sobres es excelente para sistemas de comercio de marcos de tiempo múltiples con entrada
Provides instant signals on the chart in panel form. Equipped with signal description and trading analysis tools such as drawing auto trendlines, support/resistance area, regression channel, Fibonacci levels, Pivot levels and current signal price, signal time, signal expiry and stoploss recommendation. Also sending alert messages to all available mt4 alert tool. A detailed description panel provides information about where the signal comes from and what indicators are behind the signal. Includin
Trend Suffer
Philip Effiong Philip
Alerts you on new trends, with ENTRY and EXIT points. INSTRUCTIONS  Select asset of choice, activate the indicator on the chart and just follow the signals from the arrows. ITS FREE, GIVE ME A GOOD RATING! Platform : Metatrader4 Asset : All Currencies, Gold, BTCUSD, NASDAQ PS : F or newbie and pro traders. Used by more 3,000 traders around the world. Send  a mail for further help and information...........
The Waddah Attar Explosion (WAE) indicator is a potent tool in Forex trading, offering buy, sell, exit buy, and exit sell signals. It assesses trends as trend power and momentum as explosion power. Trend Direction: - Green bars indicate a bullish trend. - Red bars indicate a bearish trend. Signal Line: - A line serves as a threshold for momentum. Buy Trade Setup: **Entry:** Go long when a green bar crosses above the threshold. Place a stop loss below the entry candle. **Exit:** Close the
The Auto Super Pivot indicator is an indicator designed to calculate support points and resistance points for pivot points. this indicator has the ability to calculate standard pivot, fibonacci, camarilla, woodie and demark pivot points. It also allows you to use all time zones with the time frame feature. Another feature of the indicator is the auto time slice feature. This feature allows automatic calculations without having to set any time zone. Features 6 different pivot calculation modes
FiboZag
Andriy Sydoruk
Indicator FiboZag - transfer the indicator to the chart and the Fibonacci levels will be built automatically on the last ZigZag turn. The main advantage lies in the correct construction of Fibonacci levels and markup of price levels. Simple, visual and effective use. The indicator is not redrawn and does not lag. Works on all currency pairs and on all timeframes.
RSI Divergence Scanner
Reza Aghajanpour
4.5 (14)
** All Symbols x All Timeframes scan just by pressing scanner button ** ***Contact me after purchase to send you instructions and add you in "RSI scanner group" for sharing or seeing experiences with other users. Introduction RSI divergence is a main technique used to determine trend reversing when it’s time to sell or buy because prices are likely to drop or pick in the charts. The RSI Divergence indicator can help you locate the top and bottom of the market. This indicator finds Regular div
Champio
Ivan Simonika
It is extremely important for any trader to correctly determine the direction and strength of the trend movement. Unfortunately, the only true solution to this problem is missing. Many traders trade at various time intervals. For this reason, the received signals are perceived subjectively. Trend indicators provide an opportunity to classify the direction of price movement, determining its strength. Solving this problem helps investors to enter the market on time and get a good return. The
ADR Alert Dashboard
LEE SAMSON
3.83 (12)
El panel de alertas de ADR le muestra de un vistazo dónde se negocia actualmente el precio en relación con su rango diario promedio normal. Recibirá alertas instantáneas a través de una ventana emergente, correo electrónico o push cuando el precio exceda su rango promedio y los niveles por encima de su elección para que pueda saltar rápidamente a retrocesos y reversiones. El guión está diseñado para colocarse en un gráfico en blanco y sentarse en el fondo y alertarlo cuando se alcanzan los nive
The indicator allows for quick identification of price reversals by promptly reacting to price impulses and indicating the beginning of a price reversal. The histogram demonstrates the direction of movement and identifies favorable moments for opening positions. It is recommended for use in swing trading and can be applied to any currency pairs, metals, and cryptocurrencies. It is also suitable for binary options trading. Key Features Rapidly identifies changes in the local trend Works on all t
Pivot Points MT4
KEENBASE SOFTWARE SOLUTIONS
KT Pivot Points automatically plots the daily, weekly, and monthly pivot levels on a chart with the precise calculation based on the latest data. Pivot points is a widely used indicator in technical analysis, particularly in the Forex market. Features Send alerts when the price touches the pivot level.  It offers complete customization for each kind of pivot level.   Shows daily, weekly, and monthly pivot levels without any fuss. It uses minimum CPU resources for faster calculation. Compati
Global Trend
Vitalii Zakharuk
Global Trend Indicator, shows the signals for entry. Displays both entry points and the trend itself. Shows statistically calculated moments for entering the market with arrows. When using the indicator, the risk factor can be optimally distributed. Settings: Uses all one parameter for settings. Choosing a parameter, it is necessary to visually resemble it so that the appropriate graph has a projection of extremes. Parameters: Length - the number of bars for calculating the indicator.
This cross MA and trend line indicator defines entries based on fast and slow MA and on the previous bot or top. The entry is displayed together with indicative prices for target and stoploss. It also gives a indicative pending sl and tp in case you set a reverse stop order. The prices are based on tops and bots from my strategy which I use in my other indicator - https://www.mql5.com/en/market/product/56045. The entry shows you if a correction is strong and will become reverse trend or if the c
Laguerre Mom AM
Andriy Matviyevs'kyy
The indicator displays in the form of a histogram the difference between the current price and the price for the previous period. A similar method of market analysis is used in the classic Momentum indicator. At the same time, the presented indicator uses the primary data smoothing by the Laguerre filter, which allows maintaining the sensitivity of the indicator and minimizing the "noise". The indicator signals are: Histogram crossing 0. Change of signal line direction.
FREE
Drawing Pack
John Louis Fernando Diamante
4 (1)
This indicator provides several drawing tools to assist in various methods of chart analysis. The drawings will keep their proportions (according to their handle trendline) across different chart scales, update in real time, and multiple drawings are supported. # Drawing Option Description  1 Grid box draggable boxed grid, user defines rows x colums, diagonal ray option  2 Grid partial or fullscreen grid, sized by handle line  3 Grid flex a diagonal grid, sized and sloped by handle line
The trader uses the Trend for Neuro indicator to determine the market situation. This is a trending algorithm that is convenient to download, install and use. The algorithm with acceptable accuracy generates input signals and output levels. Strategy for trend trading, filtering and all the necessary functions built into one tool! By launching the indicator, the user will see only two types of arrows that can change color to blue during an uptrend, to red during a downtrend there is no uncertaint
Overview This is the DELUXE version in the Pivot Point Plotter Series. It is a robust indicator that dynamically calculates and plots any of the 4 major pivot points on your chart irrespective of intra day timeframe on which the indicator is placed. This indicator is capable of plotting STANDARD, CAMARILLA, FIBONNACI or WOODIE daily pivot points. Whichever you use in your trading, this indicator is your one-stop shop. Kindly note that it is a DAILY Pivot Point Plotter for DAY TRADERS who trade o
GreenBox
Taro Mitsuyasu
It is an indicator that analyzes the high and low prices in real time by Dow theory, draws a trend line, and draws the predicted arrival point in the Box format after breaking the low price and the high return price. The high and low prices are determined by the nBars parameter (initial value = 5), but displaying the corresponding moving averages (SMA and EMA 4 to 5 times nBars) at the same time makes it easier to understand the trend change. (D ownload the demo version of the free GreenBox and
Fargo
Yvan Musatov
Fargo does not change its readings, it is a technical indicator in the Forex market without redrawing. It combines several filters to display market entry arrows on the chart. You can note the accuracy and clarity of the signals of this pointer indicator. When a suitable moment for buying appears, the indicator generates a signal exactly at the moment of its appearance and not below or above the current candle. The arrow will be exactly at the price where the signal appears and will not change
HeikenashiSmoothing
Rodolfo Leonardo De Morais
Heiken ashi Smoothing in separate window MTF The color of the Heiken-Ashi candles depend on their shadows. The advantage of the Heiken-Ashi chart is that the trend is determined very simply, the upward-facing sails are blue, and the downward-tendency sails are red. For profitable trading it is necessary to use it with the standard candles (make analyzes) and with the other indicators. Indicator Parameters TimeFrame - Graphic time being 0 = Current graph time, 1 = M1, 5 = M5, 15 = M15, 30 = M30
If the direction of the market is upward, the market is said to be in an  uptrend ; if it is downward, it is in a  downtrend  and if you can classify it neither upward nor downward or rather fluctuating between two levels, then the market is said to be in a sideways trend. This indicator shows Up Trend (Green Histogram), Down Trend (Red Histogram) and Sideways Trend (Yellow Histogram). Only one input parameter: ActionLevel. This parameter depends of the length of the shown sideways trend.
Indicator from the Real Non RePaint MultiTimeFrame (Real NRP MTF)  series. Specially designed to display the RSI standard indicator reading from the Senior TimeFrame (TF) to the Junior. The indicator differs from the standard scale - symmetrical relative to 0. Add 50.0 to the readings to get the standard values. Does not look into the future for history at the senior TF. DOES NOT DIFFER from the standard real-time indicator readings (including bias), but shows the actual indicator readings on th
This indicator shows data from 9 currency pairs by your choice for all 9 Time Frames. If a digital value of the RSI is less or equal to DnLevel = 30 (or whatever number you decided to put) then a Green square will appear. This is potentially an oversold condition and maybe a good time to go Long. If a digital value of the RSI is greater or equal to UpLevel = 70 (or whatever number you decided to put) then a Red square will appear. This is potentially an overbought condition and maybe a good time
Colored indicator of the linear channel based on the Fibonacci sequence. It is used for making trading decisions and analyzing market sentiment. The channel boundaries represent strong support/resistance levels, as they are the Fibonacci proportion levels. Users can select the number of displayed lines of channel boundaries on the chart by means of the input parameters. Attaching multiple instances of the indicator to the chart with different calculation periods leads to displaying a system of c
The indicator draws trend lines based on Thomas Demark algorithm. It draws lines from different timeframes on one chart. The timeframes can be higher than or equal to the timeframe of the chart, on which the indicator is used. The indicator considers breakthrough qualifiers (if the conditions are met, an additional symbol appears in the place of the breakthrough) and draws approximate targets (target line above/below the current prices) according to Demark algorithm. Recommended timeframes for t
The   GGP Chandelier Exit Alert MT4   Indicator is a volatility-based indicator that identifies stop loss exit points for long and short trading positions. Chandelier Exit is based on the Average True Range (ATR) indicator. It is designed to keep traders in the trend until a defined trend reversal happens. Traders use CE to maximize their returns in a trade and make stop loss exit decisions. It is based on the principle that a trend reversal is highly probable when the price of an asset moves ag
Introduction In the fast-paced world of financial market trading, success often hinges on the ability to spot and leverage trends. Among the various strategies available, momentum trading stands out as a powerful tool for traders seeking to capitalize on market movements. In this article, we will delve into the concept of momentum, its significance in trading, and the numerous benefits it offers to traders. What is Momentum? Momentum in trading refers to the tendency of assets to continue movin
MACD Platinum
Kristmundur Roman Zakharii
This version of the MACD named MACD Platinum is the   MACD indicator calculated with ZeroLag moving averages (ZLEMA) .   ZLEMA is an abbreviation of   Zero Lag   Exponential   Moving Average . It was developed by John Ehlers and Rick Way. ZLEMA is a kind of Exponential   moving average   but its main idea is to eliminate the lag arising from the very nature of the   moving averages   and other trend following indicators.
RoyalPrince Fibo
Richard Louis Pastor
4.93 (29)
Royal Prince Fibonacci , has the most advance Trend detection algorithm built into its Alert system combined with the RoyalPrince Non-repaint Arrows with it's own alert system you will never miss the opportunity of the trade.  works on all Charts and all Timeframe on mt4. ︎Best Timeframe M15 for scalping  H1 for Day Trading Options: • Fibonacci days High and Lows  • Fibonacci Targets • Fibonacci Alert System • Trend Percentage updated consistently • Trend Long Entry & Exit Alerts • Trend Shor
Los compradores de este producto también adquieren
Gann Made Easy
Oleg Rodin
4.96 (47)
Gann Made Easy es un sistema de comercio de Forex profesional y fácil de usar que se basa en los mejores principios de comercio utilizando la teoría del Sr. W. D. Gann. El indicador proporciona señales precisas de COMPRA y VENTA, incluidos los niveles de Stop Loss y Take Profit. Puede comerciar incluso sobre la marcha utilizando notificaciones PUSH. ¡Por favor, póngase en contacto conmigo después de la compra! ¡Compartiré mis consejos comerciales con usted y excelentes indicadores de bonificació
Atomic Analyst
Issam Kassas
5 (1)
En primer lugar, vale la pena enfatizar que este Indicador de Trading no repinta, no redibuja y no se retrasa, lo que lo hace ideal tanto para el trading manual como para el automatizado. El Analista Atómico es un Indicador de Acción del Precio PA que utiliza la fuerza y el impulso del precio para encontrar una mejor ventaja en el mercado. Equipado con filtros avanzados que ayudan a eliminar ruidos y señales falsas, y aumentan el potencial de trading. Utilizando múltiples capas de indicadores
ACTUALMENTE 26% DE DESCUENTO ¡La mejor solución para cualquier operador novato o experto! Este indicador es una herramienta única, de alta calidad y asequible porque hemos incorporado una serie de características propias y una nueva fórmula. ¡Con sólo UN gráfico puede leer la Fuerza de la Divisa para 28 pares de Divisas! Imagínese cómo mejorará su operativa porque podrá señalar el punto exacto de activación de una nueva tendencia o de una oportunidad de scalping. Manual del usuario: haga
Ante todo, vale la pena enfatizar que esta Herramienta de Trading es un Indicador No Repintado, No Redibujado y No Retrasado, lo que la hace ideal para el trading profesional. El Indicador de Conceptos de Acción del Precio Inteligente es una herramienta muy potente tanto para traders nuevos como experimentados. Combina más de 20 indicadores útiles en uno solo, combinando ideas avanzadas de trading como el Análisis del Trader del Círculo Interior y Estrategias de Trading de Conceptos de Dinero
Scalper Vault
Oleg Rodin
5 (27)
Scalper Vault es un sistema profesional de reventa que le brinda todo lo que necesita para una reventa exitosa. Este indicador es un sistema comercial completo que puede ser utilizado por operadores de divisas y opciones binarias. El marco de tiempo recomendado es M5. El sistema le proporciona señales de flecha precisas en la dirección de la tendencia. También le proporciona señales superiores e inferiores y niveles de mercado de Gann. Los indicadores proporcionan todo tipo de alertas, incluidas
TPSproTREND PrO
Roman Podpora
5 (15)
TPSpro TRENDPRO  - is a trend indicator that automatically analyzes the market and provides information about the trend and each of its changes, as well as giving signals for entering trades without redrawing! The indicator uses each candle, analyzing them separately. referring to different impulses - up or down impulse. Exact entry points into transactions for currencies, crypto, metals, stocks, indices!  -  Version MT5               DETAILED DESCRIPTION        /       TRADING SETUPS           
Trend Screener
STE S.S.COMPANY
4.83 (86)
Indicador de tendencia, solución única e innovadora para el comercio y filtrado de tendencias con todas las funciones de tendencias importantes integradas en una sola herramienta. Es un indicador 100% sin repintar de marcos temporales y monedas múltiples que se puede usar en todos los símbolos/instrumentos: divisas, materias primas, criptomonedas, índices y acciones. Trend Screener es un indicador de seguimiento de tendencia eficiente que proporciona señales de tendencia de flecha con puntos en
¡Actualmente 20% OFF ! ¡La mejor solución para cualquier novato o trader experto! Este software funciona con 28 pares de divisas. Se basa en 2 de nuestros principales indicadores (Advanced Currency Strength 28 y Advanced Currency Impulse). Proporciona una gran visión general de todo el mercado de divisas. Muestra los valores de Advanced Currency Strength, la velocidad de movimiento de las divisas y las señales para 28 pares de divisas en todos los (9) marcos temporales. Imagine cómo mejorar
Scalper Inside PRO
Alexey Minkov
4.75 (55)
SALE NOW! Limited Time Offer! An exclusive indicator that utilizes an innovative algorithm to swiftly and accurately determine the market trend. The indicator automatically calculates opening, closing, and profit levels, providing detailed trading statistics. With these features, you can choose the most appropriate trading instrument for the current market conditions. Additionally, you can easily integrate your own arrow indicators into Scalper Inside Pro to quickly evaluate their statistics and
Conviértase en un Breaker Trader y obtenga beneficios de los cambios en la estructura del mercado a medida que se invierte el precio. El indicador de ruptura de bloque de órdenes identifica cuándo una tendencia o movimiento de precio se acerca al agotamiento y está listo para revertirse. Le alerta sobre cambios en la estructura del mercado que generalmente ocurren cuando una reversión o un retroceso importante están a punto de suceder. El indicador utiliza un cálculo patentado que identific
TPSpro RFI Levels
Roman Podpora
5 (13)
A key element in trading is zones or levels from which decisions to buy or sell a trading instrument are made. Despite attempts by major players to conceal their presence in the market, they inevitably leave traces. Our task was to learn how to identify these traces and interpret them correctly. Reversal First Impulse levels (RFI)   -  Version MT5                INSTRUCTIONS                 RUS                 ENG                                       R ecommended to use with an indicator   -  
Introduciendo       Indicador Quantum Trend Sniper   , el innovador indicador MQL5 que está transformando la forma en que identificas y negocias los cambios de tendencia. Desarrollado por un equipo de comerciantes experimentados con experiencia comercial de más de 13 años,       Indicador de francotirador de tendencia cuántica       está diseñado para impulsar su viaje comercial a nuevas alturas con su forma innovadora de identificar cambios de tendencia con una precisión extremadamente alta.
Quantum Breakout Indicator PRO
Bogdan Ion Puscasu
4.96 (26)
Introduciendo       Quantum Breakout PRO   , el innovador indicador MQL5 que está transformando la forma en que comercia con Breakout Zones. Desarrollado por un equipo de operadores experimentados con experiencia comercial de más de 13 años,   Quantum Breakout PRO   está diseñado para impulsar su viaje comercial a nuevas alturas con su innovadora y dinámica estrategia de zona de ruptura. El indicador de ruptura cuántica le dará flechas de señal en las zonas de ruptura con 5 zonas objetivo de
Advanced Supply Demand
Bernhard Schweigert
4.92 (310)
¡Actualmente con 33% de descuento! ¡La mejor solución para cualquier tráder principiante o experto! Este indicador es una herramienta comercial única, de alta calidad y asequible, porque incorpora una serie de características patentadas y una nueva fórmula. Con esta actualización, podrá mostrar zonas de doble marco temporal. No solo podrá mostrar un marco temporal más alto, sino también mostrar ambos, el marco temporal del gráfico MÁS el marco temporal más alto: MOSTRANDO ZONAS ANIDADAS. A todos
¡Descubra el secreto para el comercio de Forex exitoso con nuestro indicador MT4 personalizado! ¿Alguna vez se ha preguntado cómo lograr el éxito en el mercado de Forex, obteniendo ganancias constantemente al tiempo que minimiza el riesgo? ¡Aquí está la respuesta que ha estado buscando! Permítanos presentar nuestro indicador MT4 patentado que revolucionará su enfoque para el comercio. Versatilidad única Nuestro indicador está especialmente diseñado para usuarios que prefieren las formacio
Presentamos el Indicador Milagroso de Forex: Desata el Poder del Trading Preciso ¿Estás cansado de buscar el mejor indicador de Forex que realmente ofrezca resultados excepcionales en todos los marcos temporales? ¡No busques más! Ha llegado el Indicador Milagroso de Forex para revolucionar tu experiencia de trading y llevar tus ganancias a nuevas alturas. Construido sobre una base de tecnología de vanguardia y años de desarrollo meticuloso, el Indicador Milagroso de Forex se erige como el pinácu
Break and Retest
Mohamed Hassan
5 (2)
Break & Retest is unstoppable when combined with our other divergence indicator. After purchase, send us a message and you could get this  2nd indicator  for  FREE  as a  BONUS! ‍You can visually backtest Break & Retest to see how it behaved in the past!    Manual guide:   Click here $59  for the first 25 copies ( 4  left)! Next price is $120 .  After many months of hard work and dedication, we are extremely proud to present you our  Break and Retest price action indicator crea
Entry Points Pro
Yury Orlov
4.7 (225)
Este es un genial indicador para MT4 que ofrece señales precisas para entrar en una transacción sin redibujar. Se puede aplicar a cualquier activo financiero: fórex, criptomonedas, metales, acciones, índices. Nos dará valoraciones bastante precisas y nos dirá cuándo es mejor abrir y cerra una transacción. Eche un vistazo  al vídeo  (6:22), ¡contiene un ejemplo de procesamiento de una sola señal que ha amortizado el indicador! La mayoría de los tráders mejoran sus resultados comerciales durante l
Currency Strength Wizard es un indicador muy poderoso que le proporciona una solución todo en uno para operar con éxito. El indicador calcula el poder de este o aquel par de divisas utilizando los datos de todas las monedas en múltiples marcos de tiempo. Estos datos se representan en forma de índice de moneda fácil de usar y líneas eléctricas de moneda que puede usar para ver el poder de esta o aquella moneda. Todo lo que necesita es adjuntar el indicador al gráfico que desea operar y el indicad
TrendMaestro
Stefano Frisetti
5 (2)
note: this indicator is for METATRADER4, if you want the version for METATRADER5 this is the link: TRENDMAESTRO recognizes a new TREND in the bud, he never makes mistakes. The certainty of identifying a new TREND is priceless. DESCRIPTION TRENDMAESTRO identifies a new TREND in the bud, this indicator examines the volatility, volumes and momentum to identify the moment in which there is an explosion of one or more of these data and therefore the moment in which prices have strong probability of f
TrendDecoder Premium
Christophe, Pa Trouillas
5 (3)
Identifique los rangos y los próximos movimientos probables   |  Obtenga las señales más tempranas y la fuerza de las Tendencias   |  Obtener salidas claras antes de reversión   |  Detecte los niveles de Fibo que el precio pondrá a prueba Indicador no repintado y no retardado - ideal para la trading manual y automatizada - adecuado para todos los activos y todas las unidades temporales Oferta por tiempo limitado >>   50% OFF Después de la compra, póngase en contacto con mi canal  para conocer lo
ALERTA DE COMPRA Y VENTA MULTIDIVISA y MULTITIMEFRAME. ¡STOP DE TRAILING AUTOMÁTICO Y TOMA DE BENEFICIOS DE RECOMPENSA DE RIESGO! ¡EL INDICADOR ESCANEA Y ANALIZA EL MERCADO PARA QUE NO TENGAS NADA QUE HACER! ¡COMERCIA TODAS TUS MONEDAS EN 1 GRÁFICO!   Después de la compra, deje un comentario, contácteme y le enviaré el asistente comercial EA. El indicador utiliza varios osciladores y filtros adjuntos para encontrar los mejores puntos de entrada CONFIRMADOS, ¡así que no necesita preocupars
FX Power MT4 NG
Daniel Stein
5 (8)
Obtenga su actualización diaria del mercado con detalles y capturas de pantalla a través de nuestro Morning Briefing aquí en mql5 y en Telegram ! FX Power MT4 NG es la nueva generación de nuestro popular medidor de fuerza de divisas, FX Power. ¿Y qué ofrece este medidor de fuerza de nueva generación? Todo lo que le encantaba del FX Power original PLUS Análisis de fuerza de ORO/XAU Resultados de cálculo aún más precisos Períodos de análisis configurables individualmente Límite de cálculo persona
Trend Forecasting
Mohamed Hassan
5 (15)
This indicator is unstoppable when combined with our other indicator called Katana. After purchase, send us a message and you could get Katana for FREE as a BONUS After purchase, send us a private message for your instructions.  MT5 version: click here 3 copies left available at $45. Next price is $99. Don't miss this great deal!  The Trend Forecasting indicator is a very unique & easy tool that is able to make prediction about future price movement based on the signals generated
Price Action Entry Alerts
Stephen Sanjeeve Sahayam
5 (3)
Este indicador analiza cada barra en busca de presión de compra o venta e identifica 4 tipos de patrones de velas con el volumen más alto. Estas velas luego se filtran utilizando varios filtros lineales para mostrar señales de compra o venta. Las señales funcionan mejor, junto con una dirección de marco de tiempo más alta y cuando se negocian durante horas de alto volumen. Todos los filtros son personalizables y funcionan de forma independiente. Puede ver señales de una sola dirección con el cli
ACTUALMENTE 31% DE DESCUENTO Este indicador es una herramienta de transacción única, de alta calidad y asequible porque hemos incorporado una serie de características propias y una fórmula secreta. Con solo un gráfico, da Alertas para los 28 pares de divisas. ¡Imagina cómo mejorarás porque puedes identificar el punto de activación exacto de una nueva tendencia u oportunidad de crecimiento! Basado en nuevos algoritmos subyacentes , hace que sea aún más fácil identificar y confirmar operaciones po
FX Volume
Daniel Stein
4.6 (35)
Obtenga su actualización diaria del mercado con detalles y capturas de pantalla a través de nuestro Morning Briefing aquí en mql5 y en Telegram ! FX Volume es el PRIMER y ÚNICO indicador de volumen que proporciona una visión REAL del sentimiento del mercado desde el punto de vista de un bróker. Proporciona una visión impresionante de cómo los participantes institucionales del mercado, como los brokers, están posicionados en el mercado Forex, mucho más rápido que los informes COT. Ver esta info
Up down v6T
Guner Koca
5 (1)
Thise indicator is up down v6  comes with tradingwiev version. purchased people, after installed on terminal ,contact me on mql5  to get BONUS  TradingView version. up-down indicator is no repaint and works all pairs and lower than weekly time frames charts. it is suitable also 1 m charts for all pairs. and hold long way to signal. dont gives too many signals. when red histogram cross trigger line that is up signal.and price probably will down when blue histogram cross trigger line that is dow
Dibuja automáticamente los niveles de soporte y resistencia MÁS los gaps de las velas de propulsión en su gráfico, para que pueda ver hacia dónde es probable que el precio se dirija a continuación y/o potencialmente retroceda. Este indicador está diseñado para ser utilizado como parte de la metodología de negociación de posiciones que se enseña en mi sitio web (The Market Structure Trader) y muestra información clave para la orientación y entradas potenciales. Hay 2 características PRINCIPA
How to use Pair Trading Station Pair Trading Station is recommended for H1 time frame and you can use it for any currency pairs. To generate buy and sell signal, follow few steps below to apply Pair Trading Station to your MetaTrader terminal. When you load Pair Trading Station on your chart, Pair Trading station will assess available historical data in your MetaTrader platforms for each currency pair. On your chart, the amount of historical data available will be displayed for each currency pai
Otros productos de este autor
This script allows selecting the TakeProfit and StopLoss levels. It analyzes the history data, and then calculates the probability of reaching a given price level. How the script works Suppose you have a trading strategy and you want to select the TakeProfit and StopLoss levels. Run the script and set the parameter: Number of Bars - the average position holding time in bars. Once the script operation is complete, the AIS-PPL.csv file will be created in the Files folder in the terminal data cat
FREE
AIS Money Management MT5
Aleksej Poljakov
5 (1)
El script se basa en la simulación de transacciones comerciales utilizando un generador de números aleatorios. Esto le permite obtener resultados completamente diferentes, incluso con los mismos parámetros de entrada. Cuando ejecuta el script, se abre un cuadro de diálogo en el que puede establecer los valores deseados para las variables externas. En el bloque,   TradingOptions   define los parámetros básicos que se necesitan para simular el comercio. StartBalance : establece el tamaño inicial
FREE
The script allows selecting the required 'Filter level' value of the AIS-MTF MT5 indicator. Run the script on the required chart and selected timeframe. Once its operation is complete, the HPS.csv file will be created in the Files folder. Open the file. You will see three columns. The 'Filter lvl' column represents the value of the 'Filter level' for the AIS-MTF indicator. Am. dev. - degree and direction of the indicator's deviation from the price level (sorted in ascending order). Negative valu
FREE
El script se basa en la simulación de transacciones comerciales utilizando un generador de números aleatorios. Esto le permite obtener resultados completamente diferentes, incluso con los mismos parámetros de entrada. Cuando ejecuta el script, se abre un cuadro de diálogo en el que puede establecer los valores deseados para las variables externas. En el bloque, TradingOptions define los parámetros básicos que se necesitan para simular el comercio. StartBalance : establece el tamaño inicial de l
FREE
La elección de los niveles de StopLoss y TakeProfit puede tener un impacto muy fuerte en el rendimiento general de las operaciones. Además de los parámetros obvios de una transacción comercial (el tamaño de una posible ganancia o pérdida probable), los niveles de StopLoss y TakeProfit también afectan la duración esperada de la transacción y la rentabilidad de la negociación en general. Si ya ha determinado la duración óptima de la transacción utilizando el script " AIS-ODT ", entonces puede come
FREE
Este script está diseñado para que el comerciante pueda determinar la duración promedio de las transacciones comerciales, en la cual la relación de posibles ganancias y pérdidas será óptima. Primero, veamos el enfoque general para determinar la duración óptima de las transacciones comerciales. Introducimos las siguientes variables: R   - el resultado de la transacción; T   - el tiempo durante el cual la transacción estuvo abierta; W : el tiempo entre el cierre de la transacción anterior y la ape
FREE
MinDeposit
Aleksej Poljakov
5 (1)
The script analyzes the history of quotes and gives recommendations on the minimum deposit. The calculations take into account the variability of prices and the standard deviation. Margin requirements for the instrument are also taken into account. The result of the script is the minimum recommended deposit for trading the given currency pair.
FREE
La elección de los niveles de StopLoss y TakeProfit puede tener un impacto muy fuerte en el rendimiento general de las operaciones. Además de los parámetros obvios de una transacción comercial (el tamaño de una posible ganancia o pérdida probable), los niveles de StopLoss y TakeProfit también afectan la duración esperada de la transacción y la rentabilidad de la negociación en general. Si ya ha determinado la duración óptima de la transacción utilizando el script " AIS-ODT ", entonces puede come
FREE
Este script está diseñado para que el comerciante pueda determinar la duración promedio de las transacciones comerciales, en la cual la relación de posibles ganancias y pérdidas será óptima. Primero, veamos el enfoque general para determinar la duración óptima de las transacciones comerciales. Introducimos las siguientes variables: R - el resultado de la transacción; T - el tiempo durante el cual la transacción estuvo abierta; W : el tiempo entre el cierre de la transacción anterior y la apertur
FREE
MinDeposit MT5
Aleksej Poljakov
3 (1)
The script analyzes the history of quotes and gives recommendations on the minimum deposit. The calculations take into account the variability of prices and the standard deviation. Margin requirements for the instrument are also taken into account. The result of the script is the minimum recommended deposit for trading the given currency pair.
FREE
The script allows selecting the required 'Filter level' value of the AIS-MTF indicator. Run the script on the required chart and selected timeframe. Once its operation is complete, the HPS.csv file will be created in the Files folder. Open the file. You will see three columns. The 'Filter lvl' column represents the value of the 'Filter level' for the AIS-MTF indicator. Am. dev. - degree and direction of the indicator's deviation from the price level (sorted in ascending order). Negative values i
FREE
This script allows selecting the TakeProfit and StopLoss levels. It analyzes the history data, and then calculates the probability of reaching a given price level. How the script works Suppose you have a trading strategy and you want to select the TakeProfit and StopLoss levels. Run the script and set the parameter: Number of Bars - the average position holding time in bars. Once the script operation is complete, the AIS-PPL.csv file will be created in the Files folder in the terminal data cat
FREE
El indicador de promedios correctos de AIS le permite establecer el comienzo de un movimiento de tendencia en el mercado. Otra cualidad importante del indicador es una clara señal del final de la tendencia. El indicador no se redibuja ni se recalcula. Valores mostrados h_AE - límite superior del canal AE l_AE - límite inferior del canal AE h_EC - Valor predicho alto para la barra actual l_EC - Valor predicho bajo para la barra actual Señales al trabajar con el indicador. La señal prin
El indicador de promedio móvil ponderado AIS calcula un promedio móvil ponderado y le permite determinar el comienzo de un movimiento de tendencia del mercado. Los coeficientes de peso se calculan teniendo en cuenta las características específicas de cada barra. Esto le permite filtrar los movimientos aleatorios del mercado. La señal principal que confirma el comienzo de una tendencia es un cambio en la dirección de las líneas del indicador y el precio que cruza las líneas del indicador.
El indicador de factibilidad de grado avanzado de AIS está diseñado para predecir los niveles que el precio puede alcanzar en el futuro. Su trabajo es analizar las últimas tres barras y construir un pronóstico basado en eso. El indicador se puede utilizar en cualquier período de tiempo y cualquier par de divisas. Con la ayuda de la configuración, puede lograr la calidad deseada del pronóstico. Profundidad de pronóstico: establece la profundidad de pronóstico deseada en barras. Se recomienda s
The indicator is designed to measure the price volatility. This allows determining the moments for opening or closing trade positions more accurately. High intensity of the market indicates the instability of its movement, but allows for better results. And, conversely, low intensity of the market indicates the stability of its movement. Parameters Bars to process - the number of bars to measure the price movements. A low value of this parameter allows determining the moments of rapid price mo
This indicator uses the Fibonacci p-numbers to smooth a price series. This allows combining the advantages of the simple and exponential moving averages. The smoothing coefficients depend on the level of the p-number, which is set in the indicator parameters. The higher the level, the greater the influence of the simple moving average and the less significant the exponential moving average. Parameters Fibonacci Numbers Order - order of the Fibonacci p-number, specified by trader. Valid values
The indicator is based on the analysis of interaction of two filters. The first filter is the popular Moving Average. It helps to identify linear price movements and to smooth minor price fluctuations. The second filter is the Sliding Median. It is a non-linear filter. It allows to filter out noise and single spikes in the price movement. A predictive filter implemented in this indicator is based on the difference between these filters. The indicator is trained during operation and is therefore
This indicator studies the price action as a combination of micro-trends. All micro-trends are analyzed and averaged. Price movement is filtered based on this averaging. IP_High and IP_Low (blue and red dashed lines) show the instantaneous price movement. They display the forecast only for the current price values, taking into account only the number of bars defined by the 'Filter level' parameter. SP_High and SP_Low (blue and red solid lines) smooth the price movements with respect to history.
Este indicador es un filtro híbrido secuencial basado en una combinación de propiedades medias y medias móviles. El uso de la mediana permite filtrar valores atípicos anormales e impulsos aleatorios en los valores de las series de precios. Al mismo tiempo, el filtro de mediana no actúa sobre la tendencia en el movimiento de precios, dejándolo sin cambios. Como el filtro de la mediana no es lineal, se utiliza el promedio utilizando un promedio móvil simple para suavizar sus valores. Este enfoq
Este indicador es una combinación de dos filtros modificados de Lanczos. El primer filtro sirve para extrapolar el precio. Basado en valores pasados, predice un posible movimiento de precios dentro de la barra actual. Es decir, muestra cuál sería el precio si las tendencias pasadas permanecieran sin cambios. El segundo filtro para suavizar y promediar los precios dentro de la ventana, determinado por el nivel del filtro. Gracias a la selección de ponderaciones, este filtro responde más activamen
Echemos un vistazo a la naturaleza de los cambios de precios en el mercado de divisas, sin prestar atención a las razones por las que se producen estos cambios. Este enfoque nos permitirá identificar los principales factores que afectan el movimiento de precios. Por ejemplo, tomemos los precios de apertura de las barras en el par de divisas EUR-USD y el período H1. Para estos precios, construimos el diagrama de Lameray (Figura 1). En este diagrama, se puede ver que el movimiento del precio se pr
Este indicador es más informativo. Su trabajo se basa en la suposición de que el movimiento de los precios en el mercado puede representarse como el ruido de un color en particular, que depende de los parámetros de la distribución de los valores de los precios. Gracias a esto, es posible analizar el cambio de precio desde diferentes ángulos y, considerando el movimiento del precio como ruido de un color en particular, se puede obtener información sobre el estado actual de las cosas en el mercad
A pesar de algunos inconvenientes del indicador " AIS Color Noise Filter ", la idea de usarlo para suavizar las series de precios y los precios de previsión parece bastante atractiva. Esto se debe a varias razones: En primer lugar, tener en cuenta varios componentes de ruido permite elaborar un pronóstico sobre factores independientes entre sí, lo que puede mejorar la calidad del pronóstico; en segundo lugar, las características de ruido de las series de precios se comportan de manera bastante
Muy a menudo, en el estudio de series financieras se aplica su suavizado. Mediante el suavizado, puede eliminar componentes de alta frecuencia; se cree que están causados ​​por factores aleatorios y, por lo tanto, no son significativos. El suavizado siempre incluye alguna forma de promediar los datos, en la que los cambios aleatorios en las series de tiempo se absorben mutuamente. Muy a menudo, para este propósito, se utilizan métodos de media móvil simple o ponderada, así como el suavizado exp
Para aislar componentes a largo plazo y no aleatorios, es necesario saber no solo cuánto ha cambiado el precio, sino también cómo se produjeron estos cambios. En otras palabras, estamos interesados ​​no solo en los valores de los niveles de precios, sino también en el orden en que estos niveles se reemplazan entre sí. A través de este enfoque, se pueden encontrar factores a largo plazo y estables que influyen (o pueden influir) en el cambio de precio en un momento dado. Y el conocimiento de est
Uno de los poderosos métodos de análisis es el modelado de series financieras utilizando procesos de Levy. La principal ventaja de estos procesos es que pueden usarse para modelar una gran cantidad de fenómenos, desde los más simples hasta los más complejos. Basta con decir que la idea del movimiento de los precios fractales en el mercado es solo un caso especial de los procesos de Levy. Por otro lado, con la selección adecuada de los parámetros, cualquier proceso de Levy puede representarse co
Muy a menudo, el comerciante se enfrenta a la tarea de determinar en qué medida el precio puede cambiar en un futuro próximo. Para este propósito, puede usar el tipo de distribución Johnson SB. La principal ventaja de esta distribución es que puede usarse incluso con una pequeña cantidad de datos acumulados. El enfoque empírico utilizado para determinar los parámetros de esta distribución le permite determinar con precisión los niveles máximos y mínimos del canal de precios. Estos valores se pu
Este indicador le permite determinar la probabilidad de que el precio alcance uno u otro nivel. Su algoritmo es bastante simple y se basa en el uso de datos estadísticos sobre los niveles de precios de un par de divisas en particular. Gracias a los datos históricos recopilados, es posible determinar en qué medida cambiará el precio durante la barra actual. A pesar de su simplicidad, este indicador puede proporcionar asistencia invaluable en el comercio. Entonces, con su ayuda, es posible determ
Se pueden utilizar distribuciones sostenibles para suavizar las series financieras. Dado que se puede usar un historial bastante profundo para calcular los parámetros de distribución, tal suavizado, en algunos casos, puede ser aún más efectivo en comparación con otros métodos. La figura muestra un ejemplo de la distribución de los precios de apertura del par de divisas EUR-USD en el marco temporal H1 durante diez años (Figura 1). Se ve fascinante, ¿no? La idea principal que subyace a este i
Filtro:
No hay comentarios
Respuesta al comentario