Dashboard RSI Multicurrency
- Indicadores
- Taras Slobodyanik
- Versión: 5.20
- Actualizado: 14 marzo 2024
- Activaciones: 10
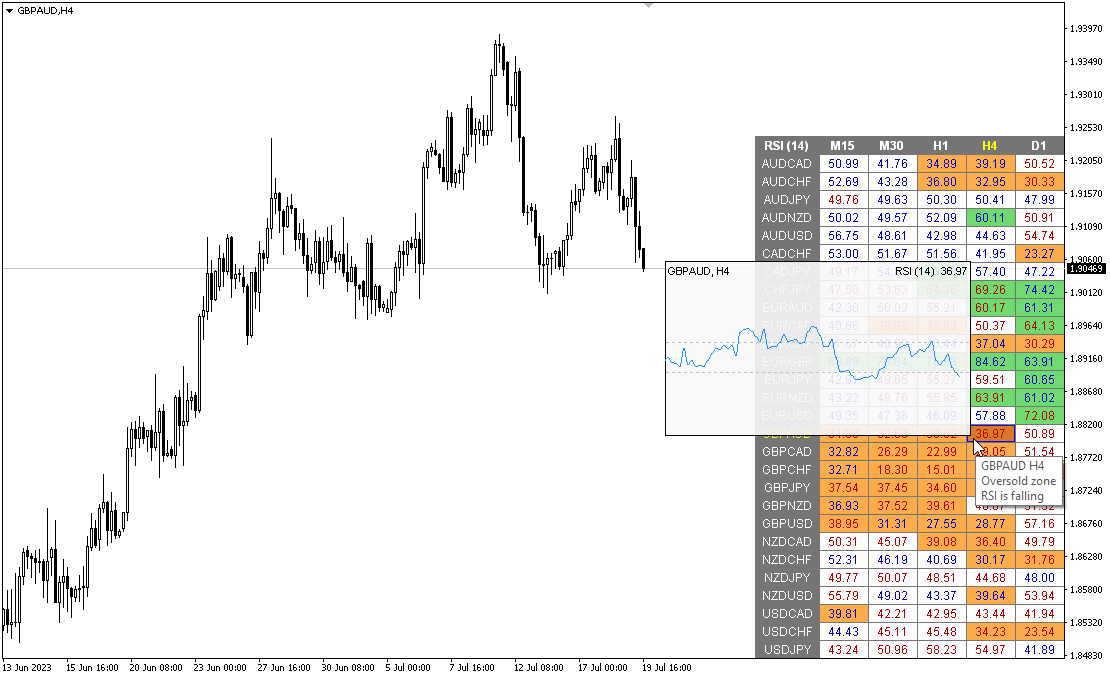
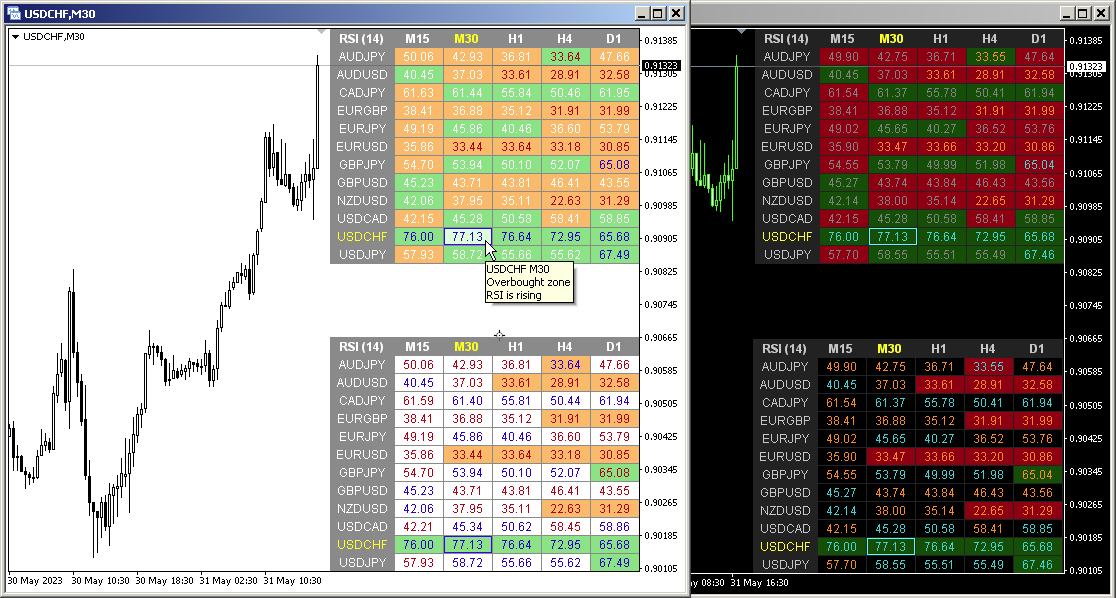
Modificación multidivisa y multitemporal del indicador Índice de Fuerza Relativa (RSI). Puede especificar las monedas y plazos que desee en los parámetros. Además, el panel puede enviar notificaciones cuando se cruzan niveles de sobrecompra y sobreventa. Al hacer clic en una celda con un punto, se abrirá este símbolo y punto. Este es el escáner MTF.
La clave para ocultar el panel del gráfico es "D" de forma predeterminada.
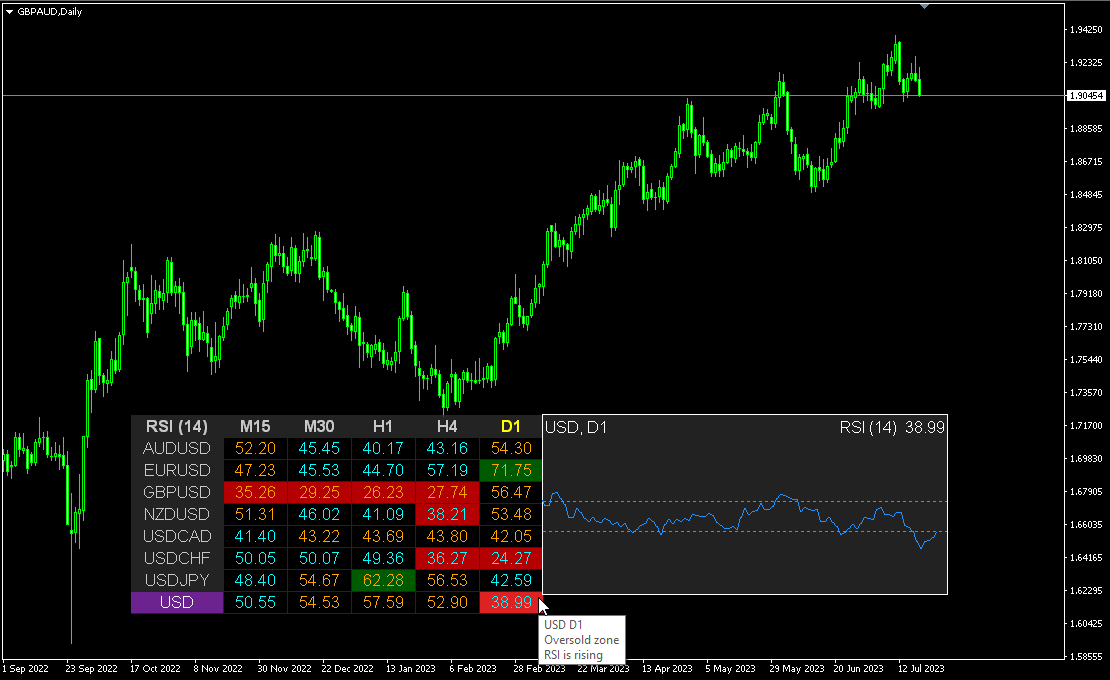
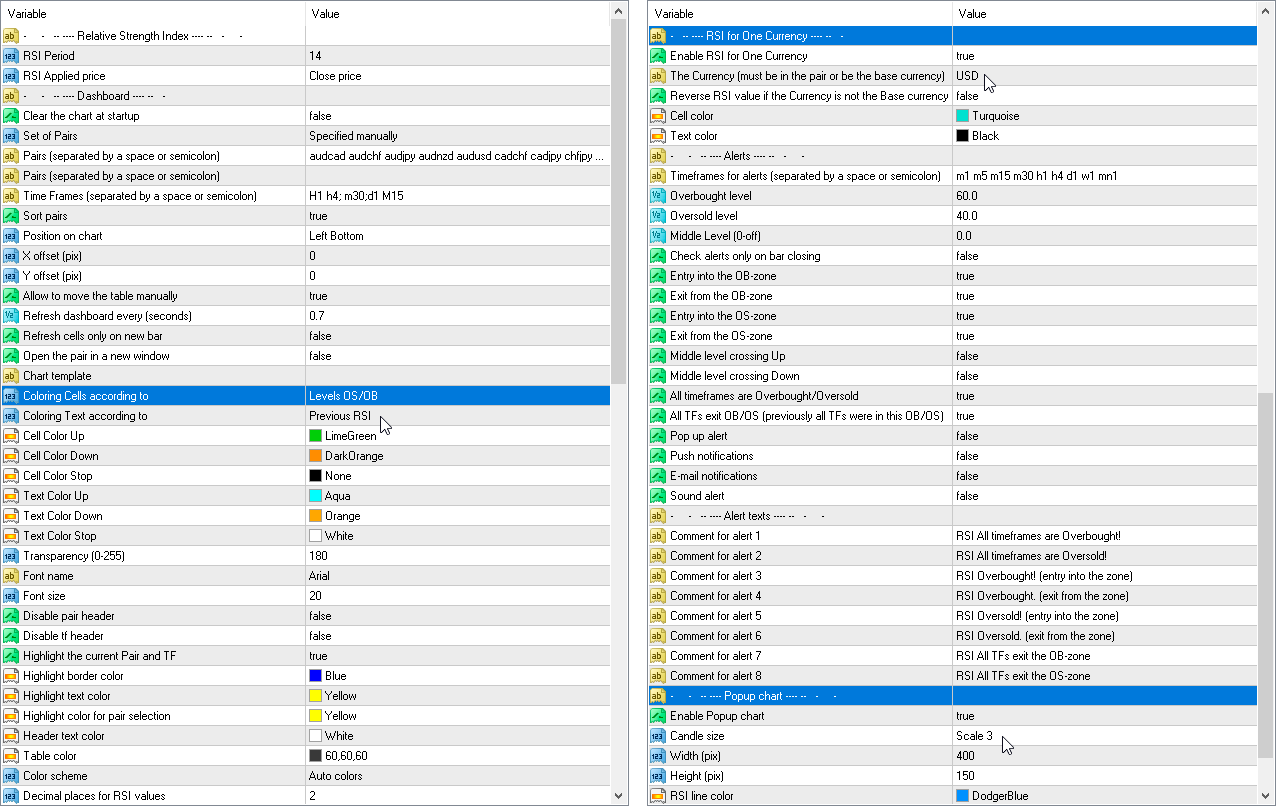
De manera similar al medidor de fortaleza de la moneda, el Panel puede seleccionar automáticamente pares que contengan la moneda especificada o aquellos pares que tengan esta moneda como base. El indicador también calculará el RSI para esta moneda en una línea separada.
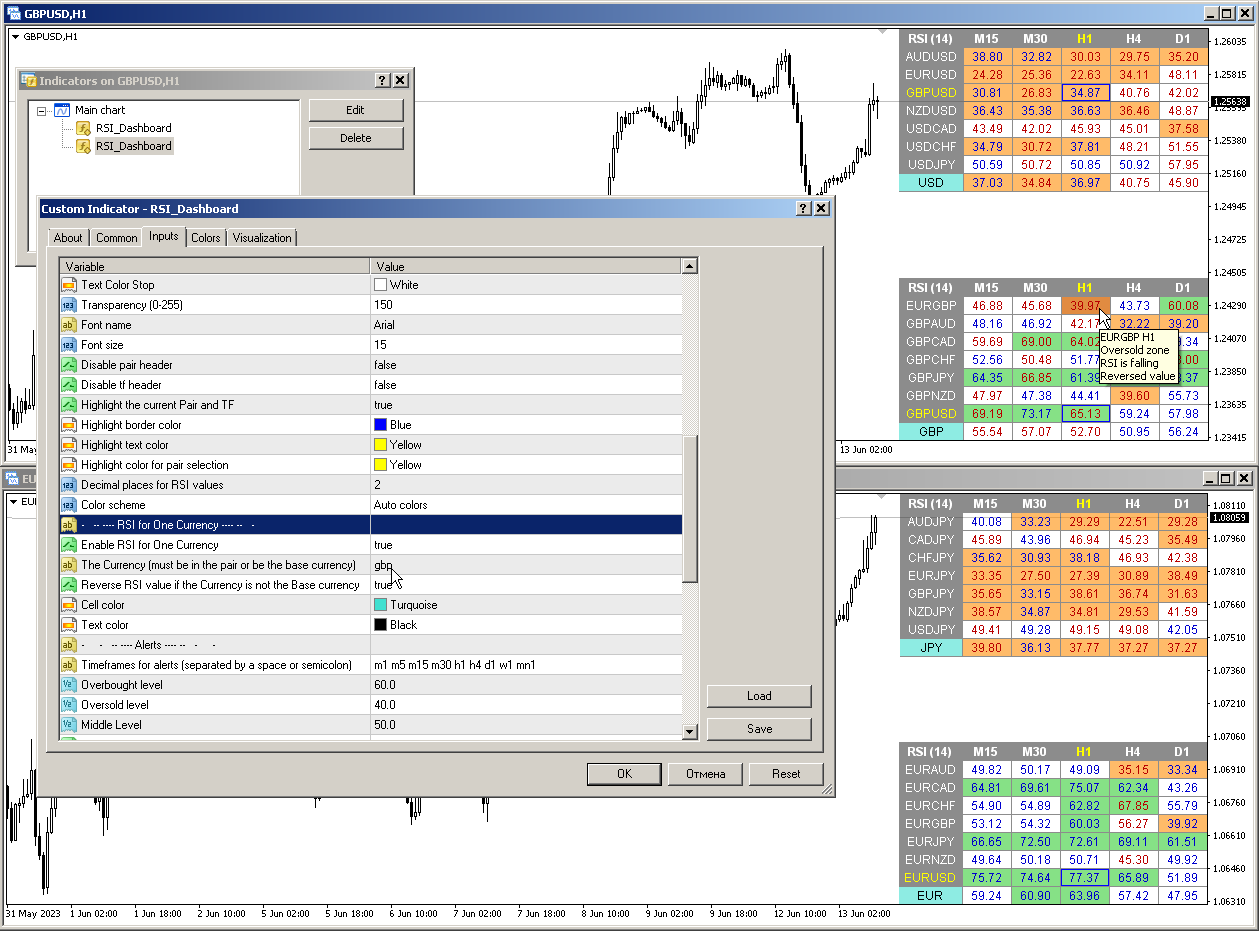
Parámetros
RSI Period — período promedio.
RSI Applied price — tipo de precio.
Clear the chart at startup — borre el gráfico al inicio.
Set of Pairs — conjunto de símbolos
— Market Watch — pares de "Market Watch".— Specified manually — pares especificados manualmente, en los parámetros "Pares".— Current pair — muestra solo el par actual.
Pairs (separated by a space or semicolon) — lista de símbolos separados por espacios o punto y coma. Los nombres de las monedas deben escribirse exactamente igual que los del bróker, manteniendo las mayúsculas y minúsculas y el prefijo/sufijo.
Time Frames (separated by a space or semicolon) — lista de períodos de tiempo separados por espacios o punto y coma (marcos de tiempo múltiples).
Sort pairs — ordenar la lista de pares.
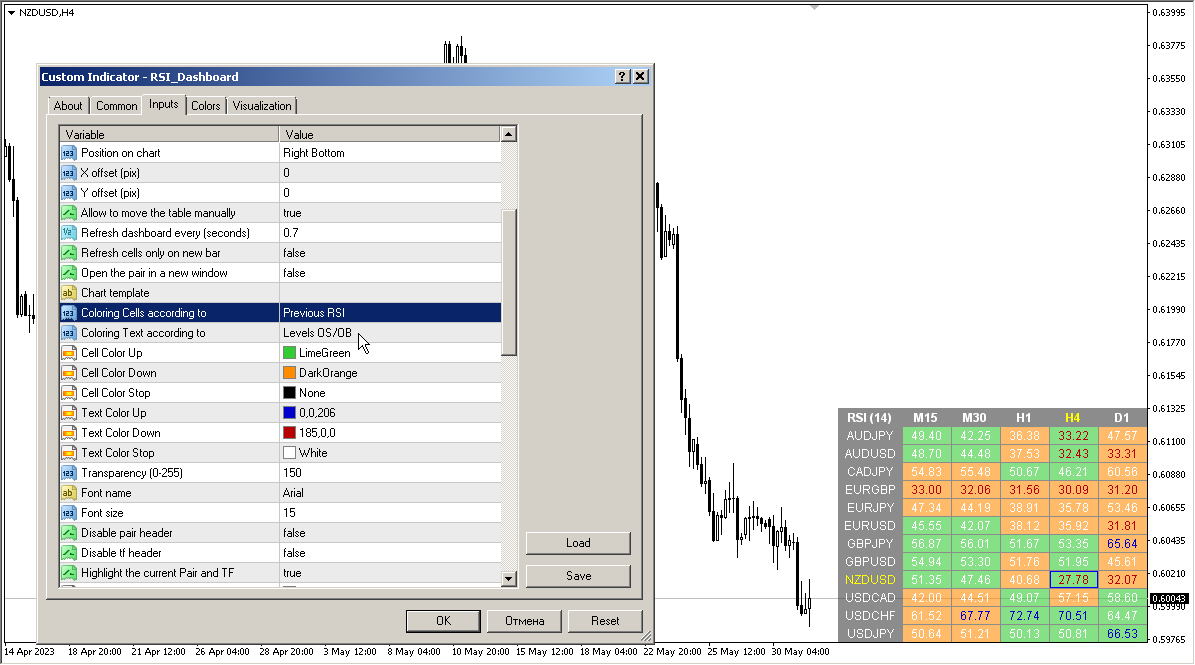
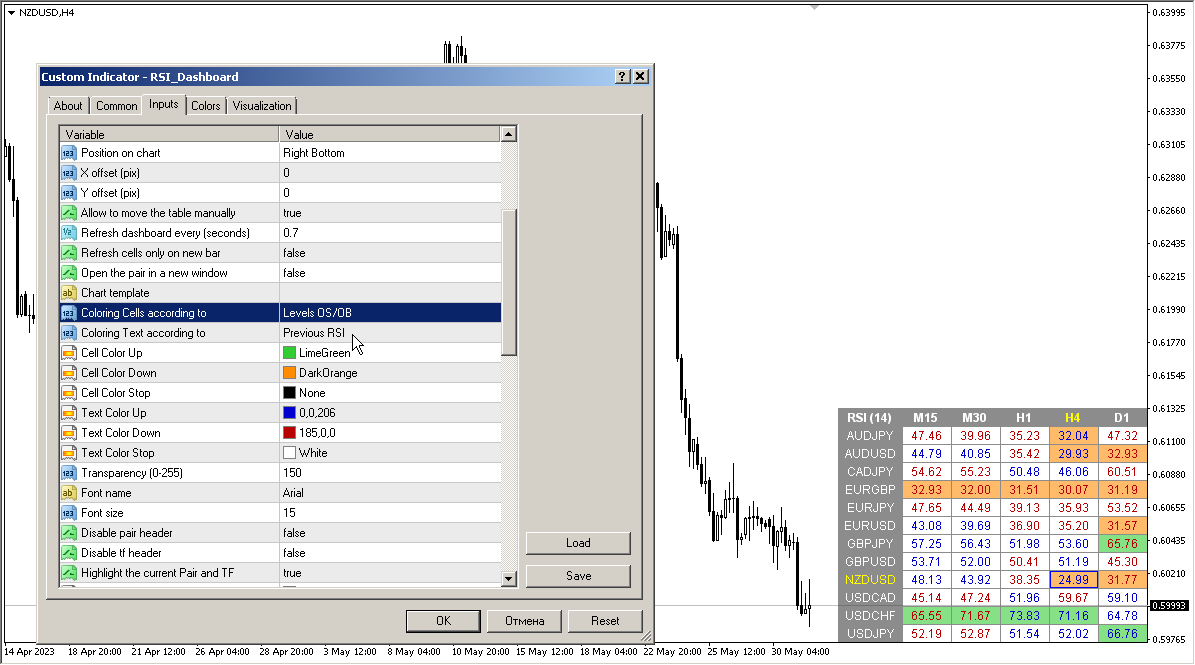
Position on chart — esquina para mostrar el panel en el gráfico.
X offset (pix) — desplaza el panel a lo largo del eje X;
Y offset (pix) — desplaza el panel a lo largo del eje Y;
Refresh dashboard every (seconds) — período de actualización para todos los pares y períodos de tiempo.
Refresh cells only on new bar — las actualizaciones de celda (y alertas) solo se producirán cuando aparezca una nueva barra.
Open the pair in a new window — abra un símbolo en una nueva ventana del gráfico haciendo clic.
Chart template — el nombre de la plantilla del gráfico, si el gráfico se abre en una ventana nueva.
Coloring the cells according to the — pinte las celdas de la tabla según los niveles de sobrecompra/sobreventa o según la dirección de la vela anterior.
Color Up — color de la celda si el indicador aumenta.
Color Down — color de la celda si el indicador disminuye.
Color Stop — color de la celda si el indicador no cambia.
Transparency (0-255) — transparencia del panel.
Font name — nombre de fuente.
Font size — tamaño de fuente.
Alertas
Timeframes for alerts (separated by a space or semicolon) — lista de períodos durante los cuales se enviará la alerta (separados por un espacio o punto y coma).
Overbought level — nivel de sobrecompra para alertas.
Oversold level — nivel de sobreventa para alertas.
Middle Level — Nivel medio
Check alerts only on bar closing — Verifique las alertas solo al cerrar la barra; verifique el paso a nivel solo después del cierre de la barra.
Entry into the OB-zone — Entrada a la zona OB
Exit from the OB-zone — Salir de la zona OB
Entry into the OS-zone — Entrada a la zona OS
Exit from the OS-zone — Salir de la zona OS
Middle level crossing Up — Paso a nivel medio Arriba
Middle level crossing Down — Paso a nivel medio Abajo
Alert when RSI direction changes — Alerta cuando cambia la dirección del RSI
All timeframes are Overbought/Oversold — Todos los plazos están sobrecomprados/sobrevendidos.
All TFs exit OB/OS (previously all TFs were in this OB/OS) — Todos los TF salen del OB/OS (anteriormente todos los TF estaban en este OB/OS)
Pop up alert — alerta emergente.
Push notifications — notificación push.
E-mail notifications — notificación por correo electrónico.
Sound alert — alerta sonora.


TARAS is the "KING OF THE DASHBOARDS", not even close! Responds promptly and professionally to any inquiries and takes into consideration your request / suggestion if it will improve the indicator. Very clever features with a robust alert system. His Heiken Ashi Dash is equally superb. This cat is not your average Joe! THANKS!