Versión 7.6
2021.08.04
1. Bug with order and position management fixed
Versión 7.5
2021.02.02
1. Fixed a bug that causes loss of mouse control
Versión 7.4
2021.01.25
1. Fixed the error of not refreshing the indicators of the high timeframe
Versión 7.3
2021.01.25
1. Fixed bug of array overrun when disabling data retrieval from market depth
Versión 7.2
2021.01.21
1. Fixed an error with order opening on CME
Versión 7.1
2020.11.16
1. Fixed work with the limit take
Versión 7.0
2020.11.12
1. Added the ability to set a take with a limit order, the setting is located in the Trade tab
2. Added the ability to paint over all boxes of the senior half
3. Fixed a bug associated with setting up a clustered graph
Versión 6.9
2020.10.21
1. Improved the function of order setting from the chart
Versión 6.8
2020.08.26
1. Fixed nonpreservation of the value zone color in the stretched profile.
2. Added the "Magnifier" tool to turn on/off, press the mouse wheel button in the graphics area, or press the ESC key on your keyboard.
Versión 6.7
2020.08.19
1. Fix out of bounds array
2. Saving screen zoom settings when restarting the terminal
3. Added the ability to show / remove the price line for established orders and positions
Versión 6.6
2020.08.06
1. Fixed display of vertical fibo levels
Versión 6.5
2020.08.05
1. Fixed buggies with drawing trend lines
2. Added vertical fibo levels in individual settings
Versión 6.4
2020.07.29
1. Fixed buggies with drawing trend lines and Fibo
Versión 6.3
2020.07.26
1. The algorithm and format of drawing of all lines have been changed, in this connection line building in previous versions will not be displayed in the current version
Versión 6.2
2020.07.21
1. Changed the display borders of the stretched profile to allow displaying the market profile in a single bar
2. Changed the display pole of the current time frame, the pole is drawn on the closing level of the bar is level pole
3. Added a shift of the displayed pole of the higher timeframe, located in the settings
4. Added timeframe in the shape of a frame period timeframe corresponds to the period of the pole timeframe inclusion on the chart through the icon with the letter C, enter the settings right click the mouse on the icon
5. Added overlay line graph to a chart in the form of bars
6. Added coloration of a candle body with the growth of volume in this candle
7. Added keyboard shortcuts for displaying the Cluster Search indicator (A - enable / disable by volume, S-enable / disable by Delta, D-enable / disable by ascbid
Versión 6.1
2020.07.14
1. Fixed centering by price in footprint display mode
Versión 6.0
2020.06.29
1. Added option of simultaneous display of delta and volume in footprint
2. Fixed errors in footprint drawing when price step was changed.
3. Fixed repainting of the ImBalance indicator in a footprint at the changed price step.
4. Added saving of price step change in the template
Versión 5.9
2020.06.15
1. Fixed color display of orders and positions on the price scale
Versión 5.8
2020.06.08
1. fixed saving the function of highlighting bars to the volume color in the template when the volume exceeds the previous bar
Versión 5.7
2020.06.07
1. the Delta indicator has added a display option in the form of a histogram of ask and bids.
2. Added: if the volume in the bar is exceeded in comparison with the previous bar, the bar or candle contour is highlighted with the color of the volume indicator.
3. Added the ability to draw and display lines only in the current window
Versión 5.6
2020.06.03
1. fixed a division by zero error in the drawing function
Versión 5.5
2020.06.02
1. Fixed a bug with the build of bars in the history and online
Versión 5.4
2020.05.27
1. Fixed a bug resulting in data overrun in the candle.
Versión 5.3
2020.05.11
1. Fixed display of maximum deltas when you change the step size in footprint
Versión 5.2
2020.05.11
1. Added a price step for clusters and footprints.
Versión 5.1
2020.04.20
1. Аdded a cumulative Delta in the Delta indicator. Summation occurs for the period of the loaded history.
2. Changed the calculation for ticks in the settings for building range and Renko bars.
3. Аdded the ability to disable text under the profile frame In the stretched market profile.
4. Added a countdown to the closing of the bar, depending on the selected type of chart shows the time, ticks, volume, Delta or number of ticks.
Versión 5.0
2020.03.13
1. Fixed scaling by price
Versión 4.9
2020.03.12
1. Fixed an error when typing the template name
2. Removed duplication of Fibo levels for all Windows with the same tool
3. When the "prevent the current price from going out of the window up and down" icon is enabled, a sharp return of the price to the visible area of the window by a certain amount is introduced
Versión 4.8
2020.03.05
1. Added the Fibonacci levels .
2. Added hotkeys for on / off displaying the profile of the higher timeframe and the daily timeframe, Q and W, respectively.
3. Fixed the display of the file name in the template, resulting in duplicate extensions ."OI" for instruments of the Russian market with open interest.
Versión 4.7
2020.02.15
1. Added line to open the day
2. The error of the formation of bars in the tick chart is fixed
Versión 4.6
2020.02.10
1. Added Dynamic POC indicator for the daily timeframe and the selected higher timeframe
2. Added VWAP indicator of the daily timeframe and the selected higher timeframe
3. The error of not saving current orders and positions in the display template has been fixed
Versión 4.5
2020.02.05
1. Added: in the Templates tab of the main settings menu, when you select from the list of downloaded templates, the file name is copied to the line to save the template
Versión 4.4
2020.02.04
1. The error of placing a pending order at the best price from the trading panel is fixed
Versión 4.3
2020.02.04
1. Fixed bug with moving stop loss for pending sell orders
2. Added to the line measurement in percent
Versión 4.2
2020.01.29
1. Fixed errors in the settings of the footprint and the ClusterSearch indicator
2. Added the ability to draw trend lines and rectangles on top of the chart
3. In templates, checking for the presence of a file in the list of saved templates with the entered name is added
4. Added setting stop loss and take profit for pending orders in the absence of a position
Versión 4.1
2020.01.26
1. Fixed a color error displaying the outline of the icons.
2. The static color of highlighting the pressed icons is changed to dynamic.
Versión 4.0
2020.01.25
1. Fixed a division by zero error in ClusterSearch indicator settings
Versión 3.9
2020.01.25
1. Fix for not clicking on new icons
Versión 3.8
2020.01.25
1. Added indicator icons: the pole, the pole of the higher timeframe and circles that draw at the closing level of the bar with the peak volume
Versión 3.7
2020.01.24
1. Completely changed the graphical interface.
2. Added indicators: the profile of the current day and previous, the profile of the selected timeframe, ClusterSearch, ImBalance, the pole of the higher timeframe.
3. Improved work with templates.
4. Disabled display of orders and positions, the ability to disable trading from the chart
Versión 3.6
2019.12.12
1. Fixed a bug that caused the utility to be removed when the terminal was rebooted
Versión 3.5
2019.12.09
1. Removed the ID entered in the EA settings.
Versión 3.4
2019.12.07
1. Fixed incorrect drawing of the chart on the Euro
2. Increased the thickness of the lines VAH and VAL in the drawn market profile
Versión 3.3
2019.09.28
1. Fixed a bug in displaying the number of orders
Versión 3.2
2019.09.09
1. Fixed bug with load more after the weekend.
Versión 3.1
2019.07.27
1. Fixed an error when drawing trend lines outside the array
Versión 3.0
2019.07.07
1. Fixed a bug when displaying the daily timeframe
2. Added an icon for the ability to move the chart vertically, relevant for footprints
3. Added display of the value area in market profile
Versión 2.7
2018.11.01
1. Устранены некоторые ошибки
Versión 2.6
2018.10.26
1. В индикаторе отображающем закрытие бара с пиковым объемом в виде кругов изменен вариант отображения, с монотонного на градиентное.
2. Изменены звуки на торговые операции.
3. Устранены некоторые ошибки в логике программы.
Versión 2.5
2018.10.23
1. Исправлена ошибка по работе с ордерами
Versión 2.4
2018.10.21
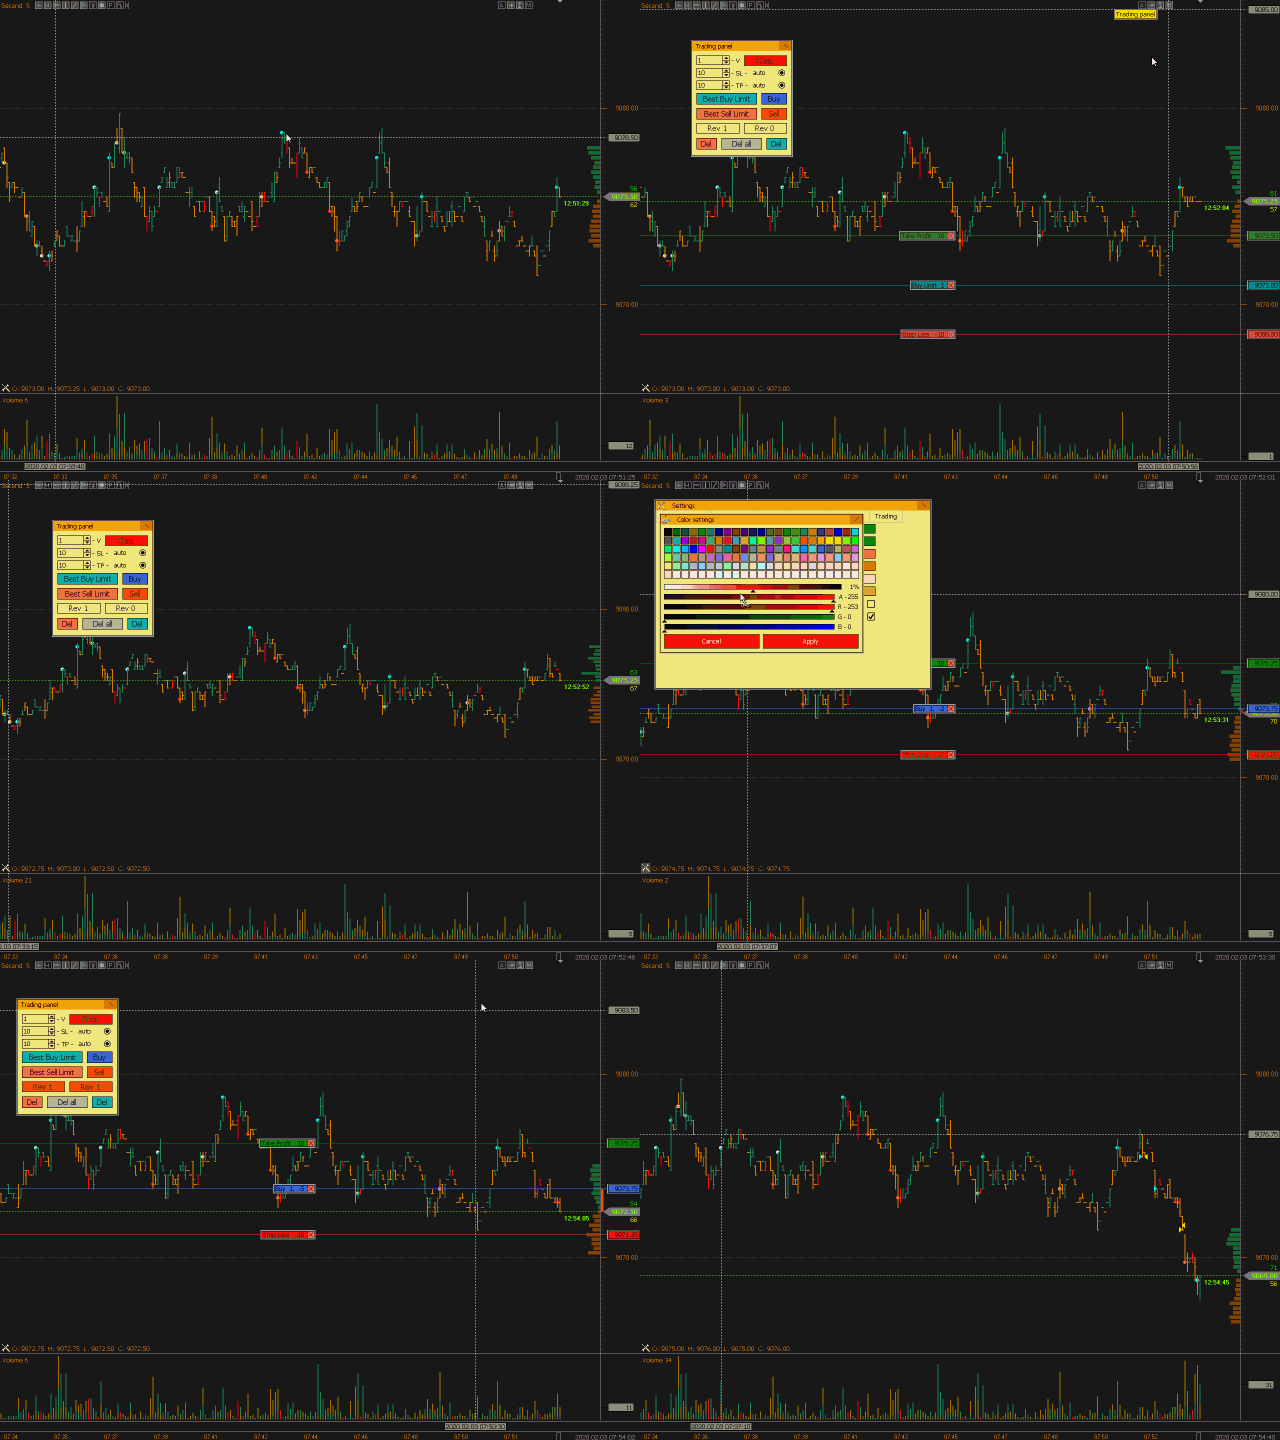
1. Добавлена торговая панель
2. Добавлены автоматически сохраняемые шаблоны
Versión 2.3
2018.10.19
1. Исправлена ошибка отоборажения отложенных ордеров
Versión 2.2
2018.10.19
1. Исправлены некоторые ошибки.
2. Добавлена линия продолжения при отображении ордеров на графике
Versión 2.1
2018.10.15
1. Добавлены графические построения, трендовые линии, прямоугольники, вертикальные.
2. В профиле рынка добавлено цифровое отображение дельты
3. Расширен диапазон построения графиков, теперь, кроме секундных, можно построить график тиков, график по объему или по дельте, ренко или рендж.
4. В управлении графиком добавлены двойной клик, правая клавиша и колесико мышки
5. Добавлен индикатор полюс
6. В индикаторе объема есть возможность отображения цвета градиентом в зависимости от дельты бара
7. Добавлена возможность выбора толщины баров
8. В свечах и барах доступно отображение РОСа
Versión 2.0
2018.03.02
1. Reading the Open Interest values from a saved file.
2. Improved the function for plotting the Market Profile.
Versión 1.9
2017.11.24
1. Added display of Open, Close, High and Low prices for the bar when hovering a cursor over it.
2. Fixed display of bars when narrowing the window.
Versión 1.8
2017.10.23
1. Added the option to display the open interest, similar to displaying the values of the delta indicator.
2. Fix error - array out of range.
Versión 1.7
2017.09.29
1. Added an option for highlighting a candlestick with a contrasting volume, using a circle, filtering by a threshold value.
2. Added an option for drawing the market profile in the visual part of the screen.
3. Added an option for hiding the current price line.
4. Added an option for drawing the current price label on a chart.
5. Added an option for showing the local computer time on the price chart.
Versión 1.6
2017.09.20
1. Fixed an error that occurred in the "bar color settings" menu.
2. Added the ability to display the current day's High and Low as lines.
3. Added 3 filters in the display of vertical volumes. The filtered bars in the volume and on the chart are "highlighted" in the specified color. When displayed in the candlestick chart, clusters or footprint, only the volumes are "highlighted".
4. Added the ability to increase the indentation of the displayed orders and positions from the price scale.
Versión 1.5
2017.09.15
1. Added the ability to automatically set the stop loss and take profit values for the open position.
2. Added the Open Interest indicator. Attention!!! Not all brokers broadcast the data on open interest.
3. Added the ability to disable the reception of quotes for the Depth of Market (Level II) event.
Versión 1.4
2017.09.05
1. Added Delta indicator disaplying delta values as a histogram in a separate window
2. Added Candle indicator displaying candles in a separate window
3. Added ability to reverse a position from the chart
Versión 1.3
2017.08.02
1. Added the ability to display the trade history on the chart
2. Added vertical and horizontal lines (grid)
3. Added a setting for the default number of bars ("the number of displayed bars" input parameter)
Versión 1.2
2017.06.30
Added the ability to trade directly from the chart
Buy_Limit - in the price chart area, press Ctrl + left mouse button below the current price
Sell_Limit - in the price chart area, press Ctrl + left mouse button above the current price
Buy_Stop - in the price chart area, press Shift + left mouse button above the current price
Sell_Stop - in the price chart area, press Shift + left mouse button below the current price
Buy_Market - in the area between the chart and scale, press Shift + left mouse button above the current price
Sell_Market - in the area between the chart and scale, press Shift + left mouse button below the current price
Versión 1.1
2017.05.29
1. Added an icon for disabling cursor lines
2. Introduced additional settings in the bar color change menu
3. Added filters based on the volume and delta in the footprint display
4. Added the DOM (Depth of Market) indicator
5. Changed the display color if the current timeframe when used with a black background






























Здравствуйте. Сразу видно работа выполнена мастером своего дела, в ней нет мелочей, которые бы остались без внимания, все четко и со вкусом. Когда такая вещь попадает в руки это всегда праздник. Большое вам спасибо, торговать одно удовольствие.