ZigZag Lines MTF for MT5
- Indicadores
- Taras Slobodyanik
- Versión: 6.1
- Actualizado: 7 septiembre 2024
- Activaciones: 10
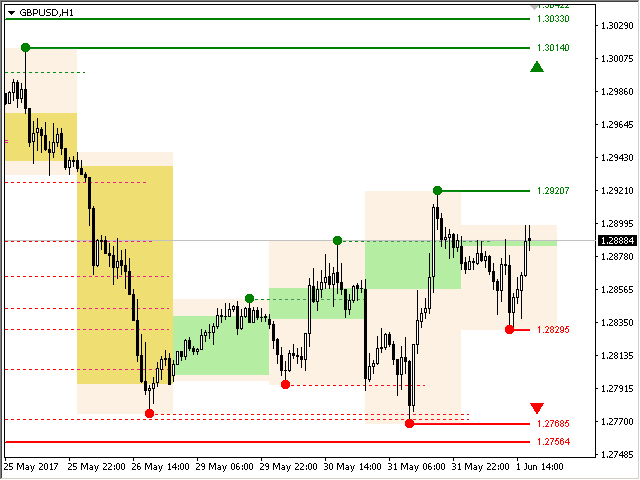
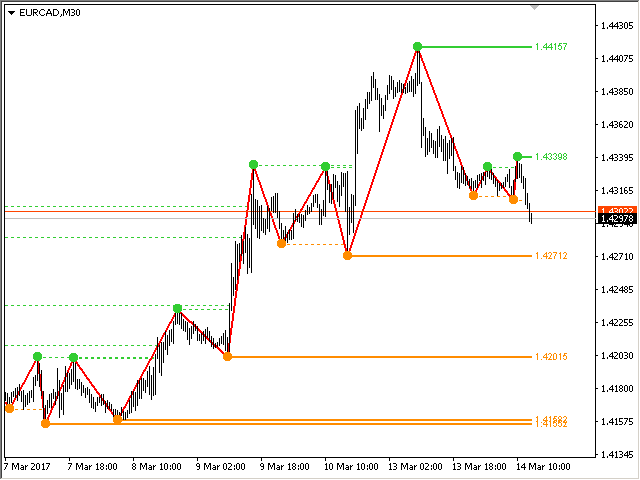
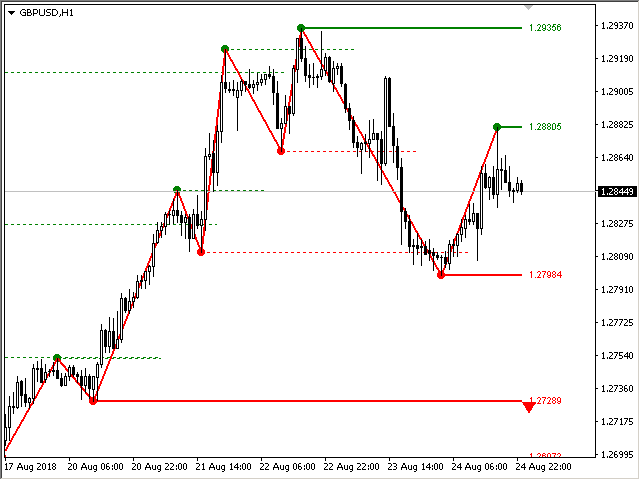
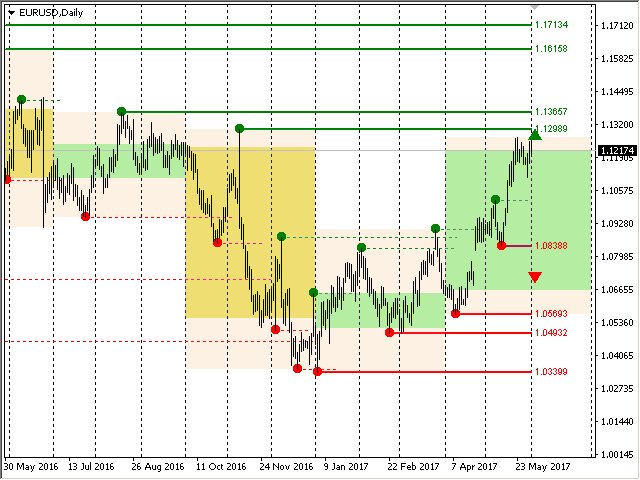
Indicador ZigZag de múltiples marcos temporales. Muestra las líneas horizontales de soporte/resistencia y sus rupturas, además de dibujar los objetivos actuales del mercado. También puede mostrar líneas del indicador Fractales y velas de otros períodos (hasta Trimestral).
El indicador vuelve a dibujar el último punto (actual) y, en algunos casos, puede cambiar los últimos 2 o 3 puntos.
Todas las líneas están dibujadas como objetos (no como buffers de indicadores, pero existe la posibilidad de recibir los datos para el EA).
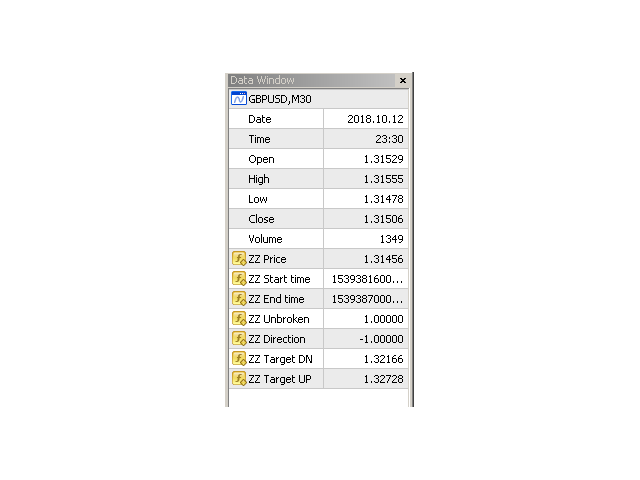
Cuando se utiliza en un Asesor Experto, puede leer puntos ZigZag usando iCustom.
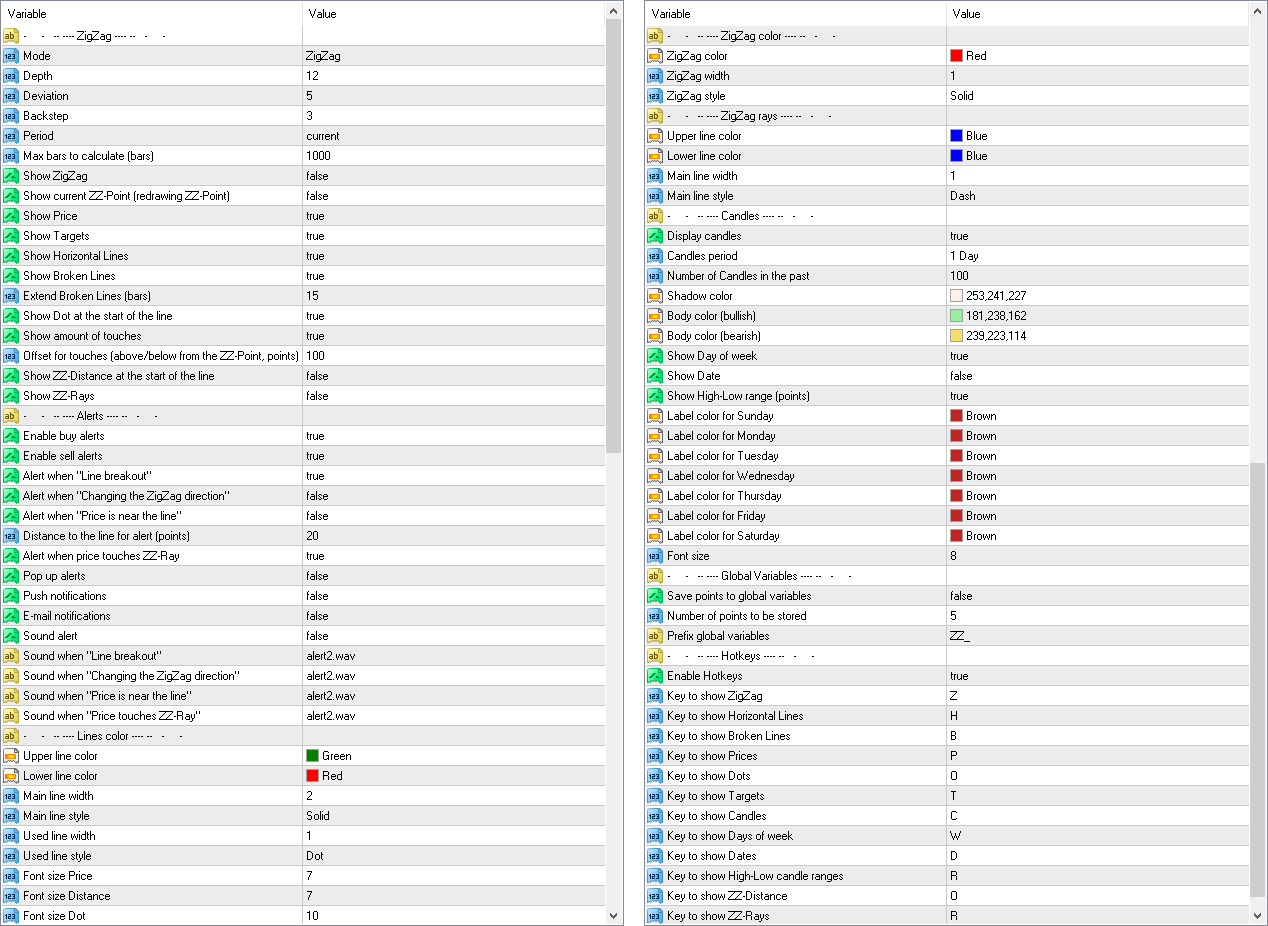
Ajustes
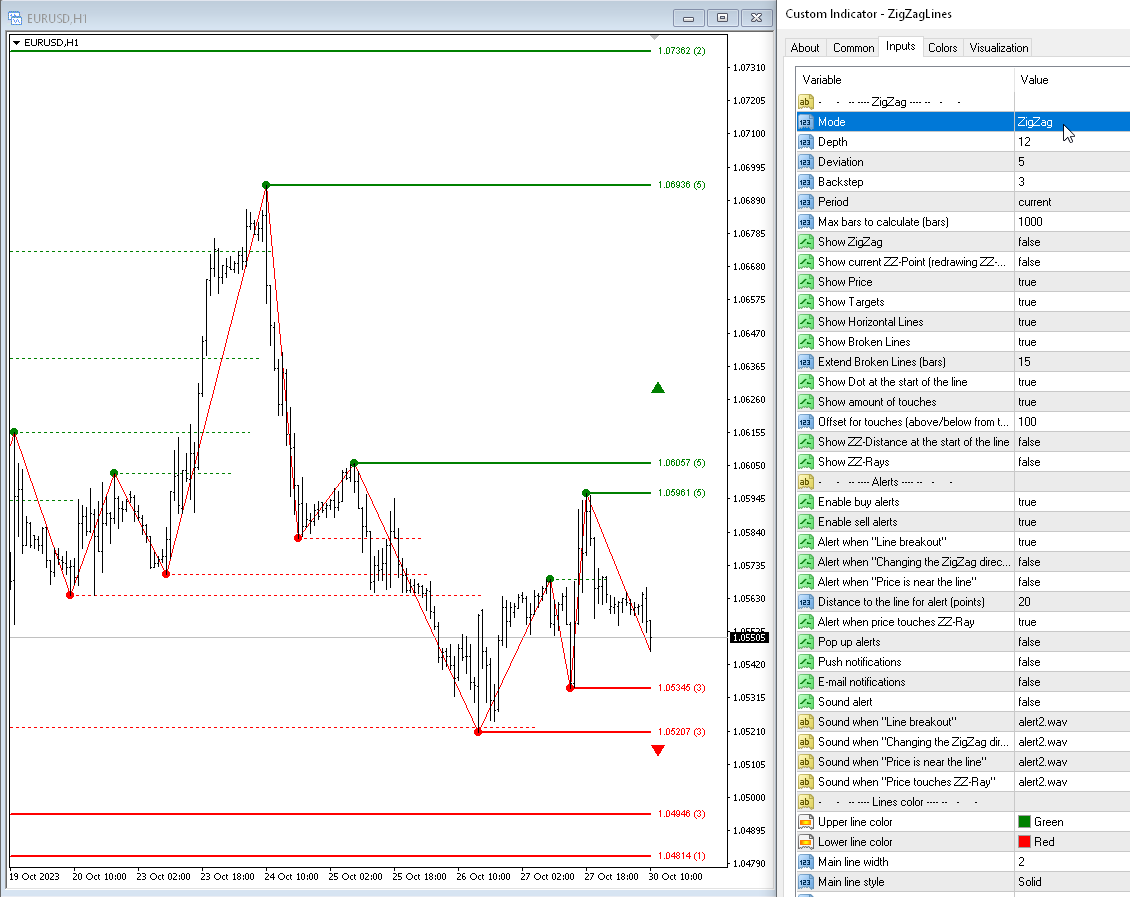
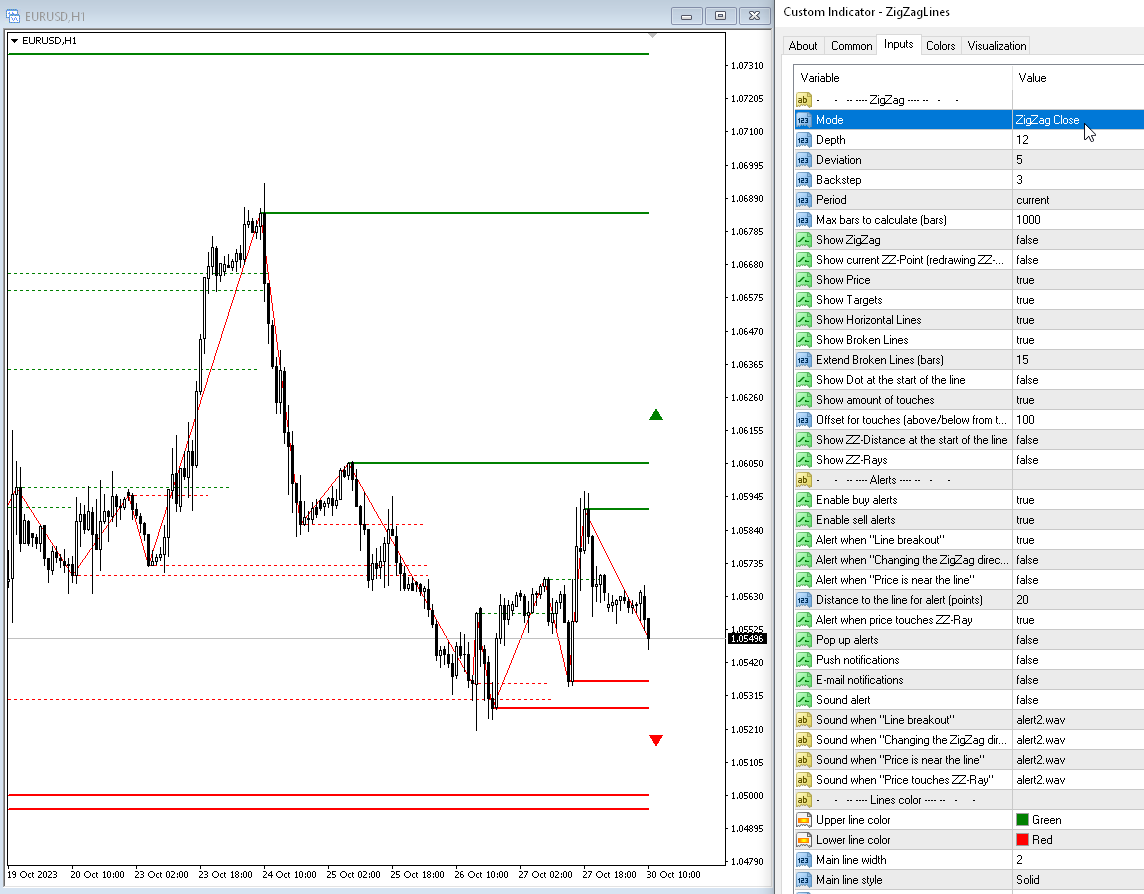
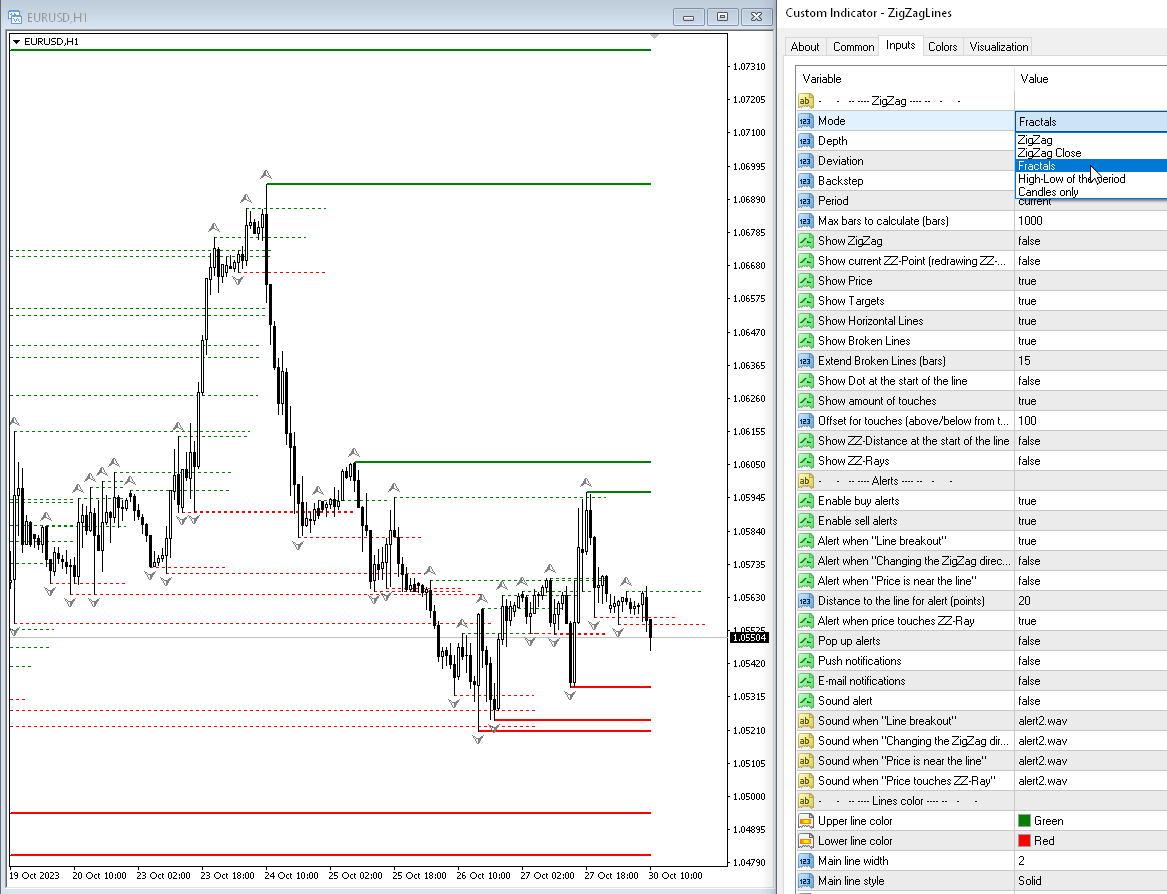
Modo: dibuja niveles de soporte y resistencia basados en:
— Zig Zag — el indicador ZigZag;— ZigZag Close — el indicador de cierre de ZigZag;— Fractals — el indicador Fractales;— High-Low of the period — construcción del indicador por niveles alto-bajo. El período de tiempo se especifica en el parámetro Período;— Candles only — sacar sólo velas;
Depth — el número mínimo de velas para las cuales Zigzag no dibujará el segundo máximo (o mínimo), si la última tiene una Desviación menor (o mayor) que la anterior;
Deviation — el número mínimo de puntos entre los máximos y mínimos de dos velas adyacentes para que el Zigzag forme un máximo o mínimo local;
Backstep — el número mínimo de velas entre los máximos y mínimos locales;
Period — período para el cálculo del ZigZag de Fractales;
Max bars to calculate (bars) — el número máximo de barras para el cálculo. Esta limitación se introduce para acelerar los cálculos;
Mostrar en el gráfico
Show Zigzag — muestra el ZigZag;
Show current ZZ-point (redrawing point) — muestra el (último) punto actual;
Show Price — muestra el precio de los niveles;
Show Targets — muestra los objetivos actuales (hacia dónde se dirige el mercado);
Show broken lines) — muestra los niveles discontinuos;
Check the breakout of the Lines by price: — Consulta el desglose de las Líneas por precio:
- High-Low (current bar) — Alto-Bajo (barra actual)
- High-Low (previous bar) — Alto-Bajo (barra anterior)
- Close (previous bar) — Cerrar (barra anterior)
- Open (current bar) — Abrir (barra actual)
Extend broken lines (bars) — extiende las líneas discontinuas hacia la derecha el número de barras especificado;
Show Dot at the start of the line — muestra puntos en los puntos de giro del indicador;
Show amount of touches — muestra la cantidad de toques cerca del precio de la línea;
Offset for touches (above/below from the ZZ-point, points) — el rango en el que se considerará que el punto ZZ toca el nivel.
Alertas
Pop up alerts — alerta emergente al tocar un nivel;
Push notifications — notificación push;
E-mail notifications — notificación por correo electrónico;
Sound alert — alerta sonora al tocar un nivel;
Alert when "Line breakout" — alerta cuando se rompe el nivel de ZigZag;
Alert when "Changing the ZigZag direction" — alerta al cambiar la dirección del ZigZag;
Alert when "Price is near the line" — alerta si el precio está cerca del nivel (una vez que hay una barra, el punto actual del ZigZag no está marcado);
Distance to the line for alert (points) — distancia de alerta (en puntos);
Colores
Upper line color — color de las líneas superiores;
Lower line color — color de las líneas inferiores;
Main line width — ancho de la línea principal;
Main line style — estilo de la línea principal;
Used line width — ancho de la línea utilizada;
Used line style — estilo de la línea usada;
Font size price — tamaño de fuente para los Precios;
Font size dot — tamaño de fuente para los puntos;
ZigZag color — color del ZigZagа;
ZigZag width — ancho de las líneas de ZigZag;
ZigZag style — estilo de las líneas ZigZag;
Velas
Display candles — habilite la exhibición de velas de otros períodos;
Candles period — periodo para las velas, todas las estándar más Trimestral;
Number of Candles in the past — el número de velas en el gráfico;
Shadow color — vela de las mechas de las velas;
Body color (bullish) — vela del cuerpo de una vela alcista;
Body color (bearish) — color del cuerpo de una vela bajista;
Save points to global variables — almacene puntos en las Variables globales del terminal;
Number of points to be stored — número de puntos que se almacenarán (el punto actual es cero);
Prefix global variables — prefijo para nombres de variables globales.


Great indicator, setting how long it takes to cancel the high/low is a great thing. I use several indicators from this creator and they always try to accommodate.