• Información general
  • Comentarios (2)
  • Discusión (3)
  • Novedades

MTF RSI for MT5

5

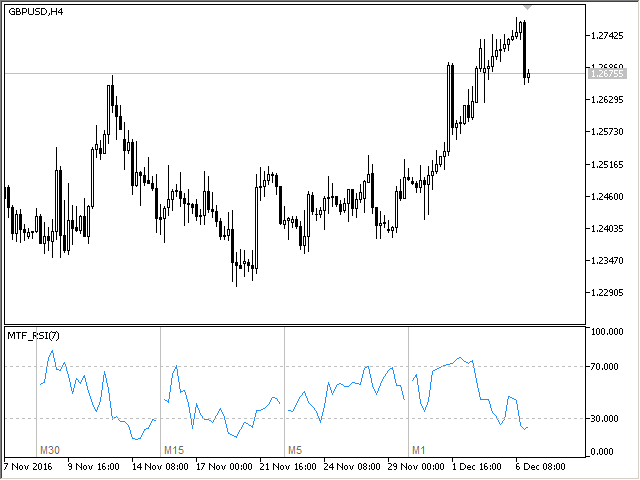
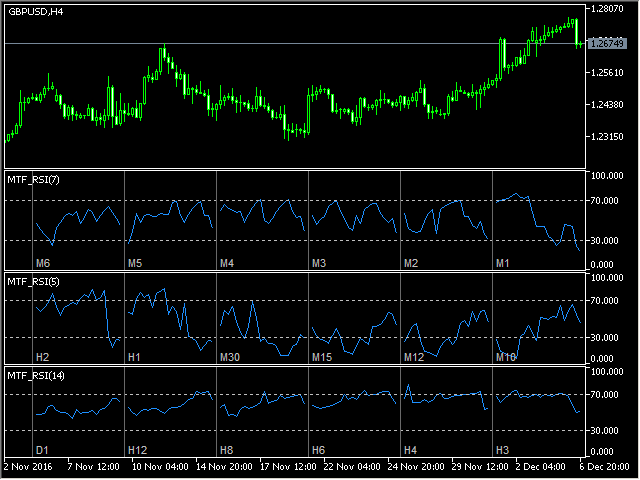
Multi-timeframe indicator Relative Strength Index displays information simultaneously from different periods in one subwindow of the chart.


Parameters

  • Period of averaging — averaging period for the RSI calculation.
  • Type of price — price used.
  • Timeframes for RSI — list of periods, separated by a space or comma or semicolon.
  • Number of bars for each period — the number of bars displayed for each period.
  • Sort periods — sort periods if they are listed in no particular order.
  • Current period first — display the current period first.
Comentarios 2
Devonish
2950
Devonish 2020.11.06 12:57 
 

I don't know why no one has given this a positive review before? I guess that depends on wether you like using RSI? I use this indicator set one time frame above, and one below the current tf. I like it.

Productos recomendados
The best time to trade Using this Indicator is when the time reach exactly hour,half,45 minutes,15 minutes and sometimes 5 minutes.. This indicators is helpful to those who trade boom and crash indecies.How to read this indicator first you'll see Blue allow and Red allow all these allows used to indicate or to detect the spike which will happen so the allow happens soon before the spike happen.This indicator works properly only in boom and crash trading thing which you have to consider when
Noize Absorption Index - is the manual trading system that measures the difference of pressure between bears forces and bulls forces. Green line - is a noize free index that showing curent situation. Zero value of index shows totally choppy/flat market.Values above zero level shows how powerfull bullish wave is and values below zero measures bearish forces.Up arrow appears on bearish market when it's ready to reverse, dn arrow appears on weak bullish market, as a result of reverse expectation.
HMA Trend Professional MT5
Pavel Zamoshnikov
4.4 (5)
Improved version of the free HMA Trend indicator (for MetaTrader 4) with statistical analysis. HMA Trend is a trend indicator based on the Hull Moving Average (HMA) with two periods. HMA with a slow period identifies the trend, while HMA with a fast period determines the short-term movements and signals in the trend direction. The main differences from the free version: Ability to predict the probability of a trend reversal using analysis of history data. Plotting statistical charts for analyz
To download MT4 version please click here . This is the exact conversion from TradingView: "WaveTrend [LazyBear]" By "zeusuk3". One of the coolest indicators out there to detect overbought and oversold zones. It can be used as a part of more complicated strategy and for confirming a potential trade setup. There are buffers to use in EAs also. The indicator is loaded light and non-repaint. - You can message in private chat for further changes you need. Thanks for downloading 
Buy CTS scalping indicator, provide buying and selling signals, automatic channeling and sending signals to mobile phones Using technical analysis and price action methods and modern methods, CTS indicator can draw price channels and recognize price trends with high accuracy and issue entry and exit signals according to them. Traders can easily fluctuate using this indicator in different time frames and in different markets. With the CTS indicator, you can signal in different ways. This indicat
nuestro indicador   Basic Support and Resistance   es la solución que necesita para aumentar su análisis técnico.Este indicador le permite proyectar niveles de soporte y resistencia en el gráfico/ mt4 gratuita características Integración de los niveles de Fibonacci: Con la opción de mostrar los niveles de Fibonacci junto con los niveles de soporte y resistencia, nuestro indicador le brinda una visión aún más profunda del comportamiento del mercado y las posibles áreas de inversión. Optimiza
MACDivergence MTF MT5
Pavel Zamoshnikov
4.17 (6)
Advanced ideas of the popular MACD indicator: It detects and displays classic and reverse divergences (two methods of detecting divergences). It uses different color to highlight an uptrend and a downtrend. Two methods of determining a trend: а) MACD crosses the 0 level (classic signal); б) MACD crosses its own average (early signal). This is a multi-timeframe indicator: it can display MACD data from other timeframes. Two methods of drawing: classic histogram and line. It generates sound and vis
Introducing the Consecutive Green/Red Candle Alert Indicator for MT5 - Your Trend Spotting Companion! Are you ready to take your trading to the next level? We present the Consecutive Green/Red Candle Alert Indicator, a powerful tool designed to help you spot trends and potential reversals with ease. Whether you're a new trader looking for clarity in the market or an experienced pro seeking additional confirmation, this indicator is your trusted companion. Key Features of the Consecutive Gre
Volality Index scalper indicator  Meant for Volality pairs such as Volality 10, 25, 50, 75 and 100 The indicator works on all timeframes from the 1 minute to the monthly timeframe the indicator is non repaint the indicator has 3 entry settings 1 color change on zero cross 2 color change on slope change 3 color change on signal line cross Orange line is your sell signal Blue line is your buy signal.
The new update makes this indicator a complete tool for studying, analyzing and operating probabilistic patterns. It includes: On-chart Multi-asset percentage monitor. Configurable martingales. Twenty-one pre-configured patterns, including Mhi patterns and C3. An advanced pattern editor to store up to 5 custom patterns. Backtest mode to test results with loss reports. Trend filter. Hit operational filter. Martingale Cycles option. Various types of strategies and alerts. Confluence between patter
PZ Trend Trading MT5
PZ TRADING SLU
3.67 (3)
Trend Trading es un indicador diseñado para sacar el máximo provecho posible de las tendencias que tienen lugar en el mercado, mediante el cronometraje de retrocesos y rupturas. Encuentra oportunidades comerciales al analizar qué está haciendo el precio durante las tendencias establecidas. [ Guía de instalación | Guía de actualización | Solución de problemas | FAQ | Todos los productos ] Opere en los mercados financieros con confianza y eficiencia Aproveche las tendencias establecidas sin s
The Antique Trend Indicator is a revolutionary trend trading and filtering solution with all the important features of a trend tool built into one tool! The Antique Trend indicator is good for any trader, suitable for any trader both for Forex and binary options. There is no need to configure anything, everything has been perfected by time and experience, it works great during flats and trends. The Antique Trend indicator is a tool for technical analysis of financial markets, reflecting curre
Was: $249  Now: $99   Market Profile defines a number of day types that can help the trader to determine market behaviour. A key feature is the Value Area, representing the range of price action where 70% of trading took place. Understanding the Value Area can give traders valuable insight into market direction and establish the higher odds trade. It is an excellent addition to any system you may be using. Inspired by Jim Dalton’s book “Mind Over Markets”, this indicator is designed to suit the
How to use Pair Trading Station Pair Trading Station is recommended for H1 time frame and you can use it for any currency pairs. To generate buy and sell signal, follow few steps below to apply Pair Trading Station to your MetaTrader terminal. When you load Pair Trading Station on your chart, Pair Trading station will assess available historical data in your MetaTrader platforms for each currency pair. On your chart, the amount of historical data available will be displayed for each currency pai
B Xtrender
Yashar Seyyedin
5 (1)
To download MT4 version please click here . This is the exact conversion from TradingView: "B-Xtrender" By "QuantTherapy". - It is an oscillator based on RSI and multiple layers of moving averages. -   It is a two in one indicator to calculate overbought and oversold zones for different RSI settings. -  This indicator lets you read the buffers for all data on the window. - This is a non-repaint and light processing load indicator. - You can message in private chat for further changes you need.
To get access to MT4 version please click here . - This is the exact conversion from TradingView: "Stochastic Momentum Index" By "UCSgears". - This is a popular version of stochastic oscillator on tradingview. - This is a light-load processing and non-repaint indicator. - Buffers are available for the lines on chart. - You can message in private chat for further changes you need. Thanks for downloading
Технический индикатор Universal Oscillator является комбинацией торговых сигналов самых популярных и широко используемых осцилляторов. Индикатор представлен гистограммами, а также линиями fast и slow MA, что позволяет расширить список получаемых торговых рекомендаций и работать как по тренду, так и в боковом движении рынка. Таким образом, гистограммы позволяют определить момент пробоя ценовых значений и движение в новой фазе рынка, а линии указывают на зоны перекупленности и перепроданности.  Ос
US30NinjaMT5
Satyaseelan Shankarananda Moodley
US30 Ninja is a 5 minute scalping indicator that will let know you when there is a trade set up (buy or sell). Once the indicator gives the trade direction, you can open a trade and use a 30 pip stop loss and a 30 pip to 50 pip take profit. Please trade at own own risk. This indicator has been created solely for the US30 market and may not yield positive results on any other pair. 
The Riko Trend indicator is a revolutionary trend trading and filtering solution with all the important features of a trend tool built into one tool! The Riko Trend indicator is good for any trader, suitable for any trader for both forex and binary options. You don’t need to configure anything, everything is perfected by time and experience, it works great during a flat and in a trend. The Riko Trend indicator is a technical analysis tool for financial markets that reflects the current price
DYJ Super Trend Wave es un sistema de negociación de picos y valles altamente preciso. Este indicador busca los puntos más altos y más bajos de la línea de velas al entrar y salir del mercado. El precio de entrada está cerca del punto más alto o más bajo. El tipo de notificación de la señal se ha agregado a dyj supertrend. Cuando se genera una señal multi-espacial, Se pueden utilizar los siguientes tipos de señales de notificación: Alert mailSend, MobilePush. Input InpSignalPeriod = 10 Ba
Bear Bull
Ignacio Agustin Mene Franco
Bear Bull ! es un indicador que marca con velas heikin ashi pero modificado , las ventas y compras  a largas y cortas tendencia !  con 2 colores  verde marca la compra ,  violeta marca la venta ,  sirve para cualquier tipo de temporalidad ,  sirve para los mercados de forex y indices sinteticos !  ideal para cualquier par , tambien sirve para los pares de crypto ,  Buen Profit ! World Inversor -
- This is the exact conversion from TradingView: "Support/Resistance" By "BarsStallone". - This indicator lets you read the buffers for R/S values. - This is a non-repaint and light processing load indicator. - This is not a multi time frame indicator If you want the multi time frame version you should create a personal order and I deliver two files that you need them both to have the multi time frame indicator running on your system. - The MT4 version of the indicator is not light load from pr
Paula Bollinger Bands Strategy
Francisco Gomes Da Silva
4 (2)
Bollinger bands out/in strategy A strategy created by Joe Ross, and very useful for finding trades when the market is overloaded. Indicator You don't need to find where there are entries on the chart, this indicator shows them for you. The entrance The trade is confirmed when the price closes outside the bollinger bands on a candle and the candle after the price closes inside the bands. comment I want to improve this indicator, so you can help me sending me your reviews and comments, thanks :).
FREE
Provided Trend is a complex signal formation indicator. As a result of the work of internal algorithms, you can see only three types of signals on your chart. The first is a buy signal, the second is a sell signal, and the third is a market exit signal. Options: CalcFlatSlow - The first parameter that controls the main function of splitting the price chart into waves. CalcFlatFast - The second parameter that controls the main function of splitting the price chart into waves. CalcFlatAvg - Par
Supply demand zoning
Oluwatosin Isaac Omotayo
After forming a New Structure High the market will retrace creating a higher low. When this movement occurs, that NSH's now become an area of structure called  resistance . As price action pushes up from the newly created higher lows, that resistance level becomes the last stand for sellers to stop the buyers from rallying.    IF the resistance level cannot be penetrated, THEN it's likely that we'll see either a period of consolidation or a reversal in trend. IF price action breaks through
Este indicador le mostrará los valores TP y SL (en esa moneda) que ya configuró para cada pedido en los gráficos (cerrados a la línea de transacción/pedido) que lo ayudarán mucho a estimar sus ganancias y pérdidas para cada pedido. Y también te muestra los valores de PIP. el formato que se muestra es "Valores de moneda de nuestros valores de ganancias o pérdidas / PIP". El valor TP se mostrará en color verde y el valor SL se mostrará en color rojo. Para cualquier pregunta o más información, n
Your Trend Friend
Luigi Nunes Labigalini
The trend is your friend! Look at the color of the indicator and trade on that direction. It does not  repaint. After each candle is closed, that's the color of the trend. You can focus on shorter faster trends or major trends, just test what's most suitable for the symbol and timeframe you trade. Simply change the "Length" parameter and the indicator will automatically adapt. You can also change the color, thickness and style of the lines. Download and give it a try! There are big movements
Wolfe Wave Scanner MT5
Reza Aghajanpour
5 (4)
**  All Symbols  x  All Timeframes  scan just by pressing scanner button ** *** Contact me after the purchase to send you instructions and add you in "Wolfe Wave Scanner group" for sharing or seeing experiences with other users. Introduction: A Wolfe Wave is created with five-wave patterns in price. It shows supply and demand and a fight towards a balance price. T hese waves of price actions can help traders identify the boundaries of   the trend . Also  It helps forecast how the price will mo
Before installing the HeatMap indicator make sure you are using a broker that gives you access to the Depth of market (DOM) !! This indicator creates a heatmap on your chart allowing you to see the buy or sell limit orders easily and in real time. You have the possibility to change the setting and the colors of the HeatMap in order to adapt to all markets and all charts. Here is an example of a setting you can use with the NASDAQ100 on the AMPGlobal broker :  https://www.youtube.com/watch?v=x0
Upgraded - Stars added to indentify Areas you can scale in to compound on your entry  when buying or selling version 2.4 Upgraded Notifications and alerts added version 2.3 *The indicator is suitable for all pairs fromm  Deriv pairs (Vix,jump,boom & crash indices) , Currencies, cryptos , stocks(USA100, USA30 ), and metals like gold etc. How does it work? Increasing the period make it more stable hence will only focus on important entry points However  lowering the period will mean the indica
Los compradores de este producto también adquieren
Atomic Analyst MT5
Issam Kassas
5 (13)
En primer lugar, vale la pena enfatizar que este Indicador de Trading no repinta, no redibuja y no se retrasa, lo que lo hace ideal tanto para el trading manual como para el automatizado. Manual del usuario: configuraciones, entradas y estrategia. El Analista Atómico es un Indicador de Acción del Precio PA que utiliza la fuerza y el impulso del precio para encontrar una mejor ventaja en el mercado. Equipado con filtros avanzados que ayudan a eliminar ruidos y señales falsas, y aumentan el poten
Primero que todo, vale la pena enfatizar que este Sistema de Trading es un Indicador No Repintado, No Redibujado y No Retrasado, lo que lo hace ideal tanto para el trading manual como para el automatizado. Curso en línea, manual y descarga de ajustes preestablecidos. El "Sistema de Trading Inteligente MT5" es una solución completa de trading diseñada para traders nuevos y experimentados. Combina más de 10 indicadores premium y presenta más de 7 estrategias de trading robustas, lo que lo convie
Gold Stuff mt5
Vasiliy Strukov
4.89 (175)
Gold Stuff mt5: un indicador de tendencia diseñado específicamente para el oro, también se puede usar en cualquier instrumento financiero. El indicador no se vuelve a dibujar ni se retrasa. El marco de tiempo recomendado es H1. IMPORTANTE! Póngase en contacto conmigo inmediatamente después de la compra para obtener instrucciones y bonificación! PARÁMETROS Draw Arrow-incl.desactivado. dibujar flechas en el gráfico. Alerts-incl.desactivado.alertas de sonido. E-mail notification-incl.desacti
FX Volume MT5
Daniel Stein
4.94 (17)
Obtenga su actualización diaria del mercado con detalles y capturas de pantalla a través de nuestro Morning Briefing aquí en mql5 y en Telegram ! FX Volume es el PRIMER y ÚNICO indicador de volumen que proporciona una visión REAL del sentimiento del mercado desde el punto de vista de un bróker. Proporciona una visión impresionante de cómo los participantes institucionales del mercado, como los brokers, están posicionados en el mercado Forex, mucho más rápido que los informes COT. Ver esta info
Reversal First Impulse levels (RFI)      INSTRUCTIONS        RUS       -       ENG              R ecommended to use with an indicator   -   TREND PRO -  Version MT4                 A key element in trading is zones or levels from which decisions to buy or sell a trading instrument are made. Despite attempts by major players to conceal their presence in the market, they inevitably leave traces. Our task was to learn how to identify these traces and interpret them correctly. Main functions:: Di
Trend Screener Pro MT5
STE S.S.COMPANY
4.87 (63)
Desbloquee el poder del comercio de tendencias con el indicador Trend Screener: ¡su solución definitiva para el comercio de tendencias impulsada por lógica difusa y un sistema multidivisa!Mejore su comercio de tendencias con Trend Screener, el revolucionario indicador de tendencias impulsado por lógica difusa. Es un poderoso indicador de seguimiento de tendencias que combina más de 13 herramientas y funciones premium y 3 estrategias comerciales, lo que lo convierte en una opción versátil para co
TPSproTREND PrO MT5
Roman Podpora
4.86 (7)
TPSpro TRENDPRO  - is a trend indicator that automatically analyzes the market and provides information about the trend and each of its changes, as well as giving signals for entering trades without redrawing! The indicator uses each candle, analyzing them separately. referring to different impulses - up or down impulse. Exact entry points into transactions for currencies, crypto, metals, stocks, indices!  -  Version MT4               DETAILED DESCRIPTION               R ecommended to use with
Quantum Trend Sniper
Bogdan Ion Puscasu
5 (41)
Introduciendo       Indicador Quantum Trend Sniper   , el innovador indicador MQL5 que está transformando la forma en que identificas y negocias los cambios de tendencia. Desarrollado por un equipo de comerciantes experimentados con experiencia comercial de más de 13 años,       Indicador de francotirador de tendencia cuántica       está diseñado para impulsar su viaje comercial a nuevas alturas con su forma innovadora de identificar cambios de tendencia con una precisión extremadamente alta.
Ante todo, vale la pena enfatizar que esta Herramienta de Trading es un Indicador No Repintado, No Redibujado y No Retrasado, lo que la hace ideal para el trading profesional. Curso en línea, manual del usuario y demostración. El Indicador de Conceptos de Acción del Precio Inteligente es una herramienta muy potente tanto para traders nuevos como experimentados. Combina más de 20 indicadores útiles en uno solo, combinando ideas avanzadas de trading como el Análisis del Trader del Círculo Inte
RelicusRoad Pro MT5
Relicus LLC
4.82 (22)
Ahora $ 147 (aumentando a $ 499 después de algunas actualizaciones) - Cuentas ilimitadas (PC o Mac) Manual de usuario de RelicusRoad + Videos de capacitación + Acceso al grupo privado de Discord + Estado VIP UNA NUEVA MANERA DE VER EL MERCADO RelicusRoad es el indicador comercial más poderoso del mundo para divisas, futuros, criptomonedas, acciones e índices, y brinda a los comerciantes toda la información y las herramientas que necesitan para mantenerse rentables. Brindamos análisis téc
ICT, SMC, SMART MONEY CONCEPTS, SMART MONEY, Smart Money Concept, Support and Resistance, Trend Analysis, Price Action, Market Structure, Order Blocks, BOS/CHoCH,   Breaker Blocks ,  Momentum Shift,   Supply&Demand Zone/Order Blocks , Strong Imbalance,   HH/LL/HL/LH,    Fair Value Gap, FVG,  Premium  &   Discount   Zones, Fibonacci Retracement, OTE, Buy Side Liquidity, Sell Side Liquidity, BSL/SSL Taken, Equal Highs & Lows, MTF Dashboard, Multiple Time Frame, BigBar, HTF OB, HTF Market Structure
AW Trend Predictor MT5
AW Trading Software Limited
4.78 (58)
La combinación de niveles de tendencia y ruptura en un sistema. Un algoritmo de indicador avanzado filtra el ruido del mercado, determina la tendencia, los puntos de entrada y los posibles niveles de salida. Las señales indicadoras se registran en un módulo estadístico, que le permite seleccionar las herramientas más adecuadas, mostrando la efectividad del historial de señales. El indicador calcula las marcas Take Profit y Stop Loss. Manual e instrucciones ->   AQUÍ   / Versión MT4 ->   AQUÍ Có
XQ Indicator MetaTrader 5
Marzena Maria Szmit
5 (1)
Step into the realm of Forex trading with confidence and precision using XQ, a cutting-edge Forex indicator designed to elevate your trading game to unprecedented heights. Whether you're a seasoned trader or just stepping into the world of currency exchange, XQ Forex Indicator empowers you with the insights and signals needed to make informed trading decisions. The signal conditions are a combination of three indicators, and XQ Forex Indicator only display  medium and long-term trends . The ind
Quantum Heiken Ashi PRO MT5
Bogdan Ion Puscasu
4.5 (8)
Presentamos el   Quantum Heiken Ashi PRO Diseñadas para brindar información clara sobre las tendencias del mercado, las velas Heiken Ashi son reconocidas por su capacidad para filtrar el ruido y eliminar las señales falsas. Diga adiós a las confusas fluctuaciones de precios y dé la bienvenida a una representación gráfica más fluida y confiable. Lo que hace que Quantum Heiken Ashi PRO sea realmente único es su fórmula innovadora, que transforma los datos de velas tradicionales en barras de colore
Bill Williams Advanced
Siarhei Vashchylka
5 (5)
Bill Williams Advanced is designed for automatic chart analysis using Bill Williams' "Profitunity" system. The indicator analyzes four timeframes at once. Manual (Be sure to read before purchasing) Advantages 1. Automatically analyzes the chart using the "Profitunity" system of Bill Williams. The found signals are placed in a table in the corner of the screen. 2. Equipped with a trend filter based on the Alligator indicator. Most of the system signals are recommended to be used only accordi
FX Power MT5 NG
Daniel Stein
5 (5)
Obtenga su actualización diaria del mercado con detalles y capturas de pantalla a través de nuestro Morning Briefing aquí en mql5 y en Telegram ! FX Power MT5 NG es la nueva generación de nuestro popular medidor de fuerza de divisas, FX Power. ¿Y qué ofrece este medidor de fuerza de nueva generación? Todo lo que le encantaba del FX Power original PLUS Análisis de fuerza de ORO/XAU Resultados de cálculo aún más precisos Períodos de análisis configurables individualmente Límite de cálculo persona
Dragon Multi Indicator MT5
Mansour Babasafary
5 (4)
3 Indicators in 1 indicator Strategy based on price action Made specifically for the best forex currency pairs Can be used in the best time frame of the market at a very reasonable price This indicator is basically 3 different indicatos . But we have combined these 3 indicators in 1 indicator so that you can use 3 indicators at the lowest price. All three strategies are based on price action. But based on different trends. Long term, medium term and short term Attributes : No repaintin
Matrix Arrow Indicator MT5
Juvenille Emperor Limited
5 (14)
Matrix Arrow Indicator MT5   es una tendencia única 10 en 1 que sigue un indicador   100% sin repintado   de marcos temporales múltiples que se puede usar en todos los símbolos/instrumentos:   divisas ,   materias primas ,   criptomonedas ,   índices ,   acciones .  Matrix Arrow Indicator MT5  determinará la tendencia actual en sus primeras etapas, recopilando información y datos de hasta 10 indicadores estándar, que son: Índice de movimiento direccional promedio (ADX) Índice de canales de prod
Conviértase en un Breaker Trader y obtenga beneficios de los cambios en la estructura del mercado a medida que se invierte el precio. El indicador de ruptura de bloque de órdenes identifica cuándo una tendencia o movimiento de precio se acerca al agotamiento y está listo para revertirse. Le alerta sobre cambios en la estructura del mercado que generalmente ocurren cuando una reversión o un retroceso importante están a punto de suceder. El indicador utiliza un cálculo patentado que identific
Introduciendo       Quantum Breakout PRO   , el innovador indicador MQL5 que está transformando la forma en que comercia con Breakout Zones. Desarrollado por un equipo de comerciantes experimentados con experiencia comercial de más de 13 años,       Desglose cuántico PRO       está diseñado para impulsar su viaje comercial a nuevas alturas con su innovadora y dinámica estrategia de zona de ruptura. El indicador de ruptura cuántica le dará flechas de señal en las zonas de ruptura con 5 zonas
"Piranha" - an autonomous trading system that determines overbought and oversold levels on the chart. Red and blue zones represent overbought and oversold levels respectively. Entry points are marked with arrows: a downward arrow in the red zone for "sell" and an upward arrow in the blue zone for "buy". The Take profit level is indicated by the green moving average. Key features: Adjusting the Take profit level as the green moving average changes position. Averaging ability when a new market e
Auto Order Block with break of structure based on ICT and Smart Money Concepts (SMC) Futures Break of Structure ( BoS )             Order block ( OB )            Higher time frame Order block / Point of Interest ( POI )    shown on current chart           Fair value Gap ( FVG ) / Imbalance   -  MTF      ( Multi Time Frame )    HH/LL/HL/LH  -  MTF      ( Multi Time Frame )  Choch  MTF      ( Multi Time Frame )  Volume Imbalance     ,  MTF          vIMB Gap’s Equal High / Low’s     ,
Advanced Supply Demand MT5
Bernhard Schweigert
4.53 (15)
¡Actualmente con 33% de descuento! ¡La mejor solución para cualquier tráder principiante o experto! Este indicador es una herramienta comercial única, de alta calidad y asequible, porque incorpora una serie de características patentadas y una nueva fórmula. Con esta actualización, podrá mostrar zonas de doble marco temporal. No solo podrá mostrar un marco temporal más alto, sino también mostrar ambos, el marco temporal del gráfico MÁS el marco temporal más alto: MOSTRANDO ZONAS ANIDADAS. A todos
El indicador de reversión de ADR le muestra de un vistazo dónde se cotiza actualmente el precio en relación con su rango diario promedio normal. Recibirá alertas instantáneas a través de una ventana emergente, correo electrónico o push cuando el precio exceda su rango promedio y los niveles por encima de su elección para que pueda saltar rápidamente a retrocesos y reversiones. El indicador dibuja líneas horizontales en el gráfico en los extremos del rango promedio diario y también extensiones p
Introducing the South African Sniper indicator created by a small group of traders with a few years trading trading the financial market profitably . This is a plug and play indicator that provides you with  BUY and SELL (SNIPER ENTRY) signals with TARGET and trail stops. The indicator Works with all MT5 trading instruments. The indicator uses previous  chart data as receipt to speculate on future market moves.  "The South African Sniper indicator community are very happy with the indicator an
FX Trend MT5
Daniel Stein
4.67 (36)
¿Quieres convertirte en un trader de 5 estrellas constantemente rentable? 1. Lee la descripción básica de nuestro sencillo trading sistema y y su mayor actualización de estrategia en 2020 2. Envíe una captura de pantalla de su compra para obtener su invitación personal a nuestro exclusivo chat de trading Tendencia Forex Muestra la dirección de la tendencia, la duración, la intensidad y la calificación de la tendencia resultante para todos los marcos temporales en tiempo real. De un solo vist
TrendLine PRO MT5
Evgenii Aksenov
4.78 (50)
El indicador Trend Line PRO es una estrategia comercial independiente. Muestra el cambio de tendencia, el punto de entrada a la transacción, así como calcula automáticamente tres niveles de Take Profit y la protección contra la pérdida de Stop Loss Trend Line PRO es perfecto para todos los símbolos de Meta Trader: monedas, metales, criptomonedas, acciones e índices Ventajas de Trend Line PRO: Nunca vuelve a dibujar sus señales Posibilidad de utilizar como estrategia independiente Tiene tres niv
The Price Action Finder Multi indicator is an indicator of entry points that searches for and displays Price Action system patterns on dozens of trading instruments and on all standard time frames: (m1, m5, m15, m30, H1, H4, D1, Wk, Mn). The indicator places the found patterns in a table at the bottom of the screen. By clicking on the pattern names in the table, you can move to the chart where this pattern is located. Manual (Be sure to read before purchasing) | Version for MT4 Advantages 1. Pa
TPA True Price Action indicator reveals the true price action of the market makers through 100% non-repainting signals strictly at the close of a candle! TPA shows entries and re-entries, every time the bulls are definitely stronger than the bears and vice versa. Not to confuse with red/green candles. The shift of power gets confirmed at the earliest stage and is ONE exit strategy of several. There are available now two free parts of the TPA User Guide for our customers. The first "The Basics"
Fractal Advanced MT5
Siarhei Vashchylka
5 (3)
Fractal Advanced - displays Fractal and Alligator indicators on the price chart. Has wide options for settings and customization. It is also equipped with alerts and a hotkey system. Manual (Be sure to read before purchasing) | Version for MT4 Advantages 1. The indicator does not fill the entire chart with fractals, but allows you to display only relevant signals. 2. The number of fractals is adjusted by scrolling the mouse while holding down the Shift key. 3. Instantly show/hide the Alligator
Otros productos de este autor
ZigZag Lines MTF
Taras Slobodyanik
4.27 (11)
Indicador ZigZag de múltiples marcos temporales. Muestra las líneas horizontales de soporte/resistencia y sus rupturas, además de dibujar los objetivos actuales del mercado. También puede mostrar líneas del indicador Fractales y velas de otros períodos (hasta Trimestral). El indicador vuelve a dibujar el último punto (actual) y, en algunos casos, puede cambiar los últimos 2 o 3 puntos. Todas las líneas están dibujadas como objetos (no como buffers de indicadores, pero existe la posibilidad
Pro Sessions MT5
Taras Slobodyanik
5 (1)
Este es un indicador de sesiones de negociación que puede mostrar todos los niveles (Apertura-Alto-Bajo-Cierre) durante cuatro sesiones. El indicador también puede predecir los niveles de sesión. Las sesiones se pueden dibujar con líneas o rectángulos (vacíos o rellenos), las líneas se pueden extender a la siguiente sesión. Puede ocultar/mostrar fácilmente cada sesión presionando las teclas de acceso rápido (de forma predeterminada, '1', '2', '3', '4'). Puede ver líneas   ASR (rango de sesión
ZigZag Lines MTF for MT5
Taras Slobodyanik
5 (7)
Indicador ZigZag de múltiples marcos temporales. Muestra las líneas horizontales de soporte/resistencia y sus rupturas, además de dibujar los objetivos actuales del mercado. También puede mostrar líneas del indicador Fractales y velas de otros períodos (hasta Trimestral). El indicador vuelve a dibujar el último punto (actual) y, en algunos casos, puede cambiar los últimos 2 o 3 puntos. Todas las líneas están dibujadas como objetos (no como buffers de indicadores, pero existe la posibilidad
Modificación multidivisa y multitemporal del Oscilador Estocástico. Puede especificar las monedas y plazos que desee en los parámetros. El panel muestra los valores actuales y las intersecciones de las líneas - Señal y Principal (cruce estocástico). Además, el indicador puede enviar notificaciones cuando se cruzan niveles de sobrecompra y sobreventa. Al hacer clic en una celda con un punto, se abrirá este símbolo y punto. Este es el escáner MTF. De manera similar al medidor de fortaleza de la m
ZigZag Dashboard for MT5
Taras Slobodyanik
5 (3)
Modificación multidivisa y multitemporal del indicador ZigZag. Muestra la dirección actual del mercado, la altura del último movimiento, el número de barras de este movimiento y la ruptura del punto anterior del ZigZag (línea horizontal). Este es el escáner MTF. Puede especifcar las monedas y plazos que desee en los parámetros. Además, el panel puede enviar notificaciones cuando el ZigZag cambia de dirección o cuando se produce un avance en el punto anterior. Al hacer clic en una celda con un
Modificación multidivisa y multitemporal del indicador Índice de Fuerza Relativa (RSI). Puede especificar las monedas y plazos que desee en los parámetros. Además, el panel puede enviar notificaciones cuando se cruzan niveles de sobrecompra y sobreventa. Al hacer clic en una celda con un punto, se abrirá este símbolo y punto. Este es el escáner MTF. La clave para ocultar el panel del gráfico es "D" de forma predeterminada. De manera similar al medidor de fortaleza de la moneda, el Panel pue
MACD Dashboard
Taras Slobodyanik
Indicador MACD multidivisa y multiplazo. El panel puede mostrar tanto el MACD tradicional (verdadero) como el MACD integrado en MetaTrader. En el panel puede ver el estado actual del indicador: la dirección del movimiento de las líneas MACD, su intersección y una ventana emergente con el gráfico del indicador. En los parámetros puede especificar los pares-símbolos y plazos que desee. El escáner también puede enviar notificaciones sobre líneas que se cruzan entre sí y sobre líneas que cruzan e
Modificación multidivisa y multitemporal del indicador Bandas de Bollinger. En el tablero puedes ver rupturas y toques de las Bandas de Bollinger. En los parámetros puede especificar las monedas y plazos que desee. El indicador también puede enviar notificaciones cuando el precio toca las Bandas de Bollinger, cuando la volatilidad actual cambia (se expande o cae) y cuando el precio toca todas las bandas. Al hacer clic en una celda con un punto, se abrirá este símbolo y punto. Este es el escáner
Este panel muestra noticias actuales de tres fuentes: del sitio web ForexFactory.com (calendario FFC), del sitio web Investing.com y del calendario económico de mql5.com. Puede ordenar las noticias por impacto y por país y mostrarlas en el gráfico con un solo clic. Al mantener presionada la tecla 'Ctrl', puede seleccionar varias 'monedas' o 'impactos' diferentes para ordenar. Además, esta utilidad muestra no solo el pronóstico, sino también los valores reales después de que aparecen en el sitio
Time Scale for MT5
Taras Slobodyanik
4.88 (17)
The indicator draws the time scale on the chart. You can specify the time offset, adjust the size and font to display on the chart ( it is displaying your local time on your chart instead of MT time ). You can also select the desired format for displaying the date and time. You may be interested in my other product , which contains a more advanced version of the Time Scale . Parameters Hours (time shift) — time shift (hours); Minutes (time shift) — time shift (minutes); Show time on mouse — sh
FREE
Symbol Manager for MT5
Taras Slobodyanik
5 (1)
Symbol Manager or Grid Manager, designed to group orders into one position (by symbol and by direction). This utility will be useful to multi-currency traders, who can have multiple orders on several pairs. You will be able to see the total number of lots, the total profit, and set virtual stop loss and virtual take profit. To set a real TP (or SL), you must first set the virtual value, and then enter the command in this cell: "set". If you want to set real TP/SL for all orders at once, then en
ADX Dashboard MT5
Taras Slobodyanik
5 (3)
El indicador ADX se utiliza para determinar la tendencia y su fuerza. La dirección del precio se muestra mediante los valores +DI y -DI, y el valor ADX muestra la fuerza de la tendencia. Si +DI está por encima de -DI, entonces el mercado está en una tendencia alcista, si por el contrario, está en una tendencia bajista. Si ADX está por debajo de 20, entonces no hay una dirección definida. Tan pronto como el indicador supera este nivel, comienza una tendencia de fuerza media. Los valores superior
MA Dashboard
Taras Slobodyanik
4.5 (2)
Modificación multidivisa y multitemporal del indicador Media Móvil (MA). En el tablero puede ver el estado actual del indicador: rupturas y toques (por precio) de Fast MA y Slow MA, así como la intersección de las líneas MA entre sí (cruce de media móvil). En los parámetros puede especificar las monedas y plazos que desee. Además, el indicador puede enviar notificaciones sobre el precio que toca las líneas y sobre su cruce. Al hacer clic en una celda con un punto, se abrirá este símbolo y punto
Lines Profit Loss
Taras Slobodyanik
4.82 (22)
El indicador muestra ganancias (pérdidas) en el símbolo actual. Puede arrastrar y soltar libremente la línea para mostrar la ganancia o pérdida actual. Parámetros Calculation in money or in points — calcula la ganancia/pérdida en puntos o en dinero. Add pending orders to calculate — tenga en cuenta las órdenes pendientes en los cálculos. Magic Number (0 - all orders on symbol) — número mágico, si es necesario evaluar órdenes específicas. Offset for first drawing (points from the average p
FREE
Lines Profit Loss MT5
Taras Slobodyanik
4.53 (15)
El indicador muestra ganancias (pérdidas) en el símbolo actual. Puede arrastrar y soltar libremente la línea para mostrar la ganancia o pérdida actual. Parámetros Calculation in money or in points — calcula la ganancia/pérdida en puntos o en dinero. Add pending orders to calculate — tenga en cuenta las órdenes pendientes en los cálculos. Magic Number (0 - all orders on symbol) — número mágico, si es necesario evaluar órdenes específicas. Offset for first drawing (points from the average p
FREE
Modificación multidivisa y multitemporal del Oscilador Estocástico. Puede especificar las monedas y plazos que desee en los parámetros. El panel muestra los valores actuales y las intersecciones de las líneas - Señal y Principal (cruce estocástico). Además, el indicador puede enviar notificaciones cuando se cruzan niveles de sobrecompra y sobreventa. Al hacer clic en una celda con un punto, se abrirá este símbolo y punto. Este es el escáner MTF. De manera similar al medidor de fortaleza de la m
MA Dashboard MT5
Taras Slobodyanik
5 (4)
Modificación multidivisa y multitemporal del indicador Media Móvil (MA). En el tablero puede ver el estado actual del indicador: rupturas y toques (por precio) de Fast MA y Slow MA, así como la intersección de las líneas MA entre sí (cruce de media móvil). En los parámetros puede especificar las monedas y plazos que desee. Además, el indicador puede enviar notificaciones sobre el precio que toca las líneas y sobre su cruce. Al hacer clic en una celda con un punto, se abrirá este símbolo y punto
El indicador dibuja automáticamente los niveles de Fibonacci basándose en el indicador ZigZag, sesiones de negociación, fractales o velas (incluidos períodos de tiempo no estándar: año, 6 meses, 4 meses, 3 meses, 2 meses) (retroceso automático de Fibo). Puede elegir cualquier período de tiempo superior para el cálculo de Fibonachi. Los niveles se vuelven a dibujar cada vez que se cierra la barra actual. Es posible habilitar alertas al cruzar los niveles especificados. También puedes analizar
CCI Dashboard for MT4
Taras Slobodyanik
5 (3)
Modificación multidivisa y multitemporal del indicador Commodity Channel Index (CCI). Puede especificar las monedas y plazos que desee en los parámetros. Además, el panel puede enviar notificaciones cuando se cruzan niveles de sobrecompra y sobreventa. Al hacer clic en una celda con un punto, se abrirá este símbolo y punto. Este es el escáner MTF. La clave para ocultar el panel del gráfico es "D" de forma predeterminada. Parámetros CCI Period — período promedio. CCI Applied price — tipo
ADX Dashboard
Taras Slobodyanik
5 (3)
El indicador ADX se utiliza para determinar la tendencia y su fuerza. La dirección del precio se muestra mediante los valores +DI y -DI, y el valor ADX muestra la fuerza de la tendencia. Si +DI está por encima de -DI, entonces el mercado está en una tendencia alcista, si por el contrario, está en una tendencia bajista. Si ADX está por debajo de 20, entonces no hay una dirección definida. Tan pronto como el indicador supera este nivel, comienza una tendencia de fuerza media. Los valores superior
Heikin Ashi Dashboard
Taras Slobodyanik
5 (3)
Indicador Heikin Ashi multidivisa y multiplazo. Muestra el estado actual del mercado. En el panel del escáner puede ver la dirección, la fuerza y el número de barras de la tendencia actual. Las velas de Consolidación/Reversión también se muestran usando colores. Puede especificar las monedas y períodos que desee en los parámetros. Además, el indicador puede enviar notificaciones cuando cambia la tendencia o cuando aparecen velas de reversión y consolidación (dojis). Al hacer clic en una celda,
Indicador multidivisa y multitemporal del Canal de Desviación Estándar. Muestra la dirección actual del mercado. En el panel se pueden ver rupturas y toques (por precio) de los niveles del canal de regresión lineal. En los parámetros, puede especificar las monedas y plazos que desee. Además, el indicador puede enviar notificaciones cuando se tocan niveles. Al hacer clic en una celda, se abrirá este símbolo y punto. Este es el escáner MTF. La clave para ocultar el panel del gráfico es "D" de f
Time Scale
Taras Slobodyanik
4.8 (10)
The indicator draws the time scale on the chart. You can specify the time offset, adjust the size and font to display on the chart (it is displaying your local time on your chart instead of MT time). You can also select the desired format for displaying the date and time. While holding down the middle mouse button, and moving the cursor, a slider will appear on the scale. You may be interested in my other product , which contains a more advanced version of the Time Scale. Parameters Hours (tim
FREE
MACD Dashboard MT5
Taras Slobodyanik
5 (1)
Indicador MACD multidivisa y multiplazo. El panel puede mostrar tanto el MACD tradicional (verdadero) como el MACD integrado en MetaTrader. En el panel puede ver el estado actual del indicador: la dirección del movimiento de las líneas MACD, su intersección y una ventana emergente con el gráfico del indicador. En los parámetros puede especificar los pares-símbolos y plazos que desee. El escáner también puede enviar notificaciones sobre líneas que se cruzan entre sí y sobre líneas que cruzan e
ZigZag Dashboard for MT4
Taras Slobodyanik
4.75 (4)
Modificación multidivisa y multitemporal del indicador ZigZag. Muestra la dirección actual del mercado, la altura del último movimiento, el número de barras de este movimiento y la ruptura del punto anterior del ZigZag (línea horizontal). Este es el escáner MTF. Puede especificar las monedas y plazos que desee en los parámetros. Además, el panel puede enviar notificaciones cuando el ZigZag cambia de dirección o cuando se produce un avance en el punto anterior. Al hacer clic en una celda con u
Indicador Heikin Ashi multidivisa y multiplazo. Muestra el estado actual del mercado. En el panel del escáner puede ver la dirección, la fuerza y el número de barras de la tendencia actual. Las velas de Consolidación/Reversión también se muestran usando colores. Puede especificar las monedas y períodos que desee en los parámetros. Además, el indicador puede enviar notificaciones cuando cambia la tendencia o cuando aparecen velas de reversión y consolidación (dojis). Al hacer clic en una celda,
Pro Sessions MT4
Taras Slobodyanik
4 (3)
Este es un indicador de sesiones de negociación que puede mostrar todos los niveles (Apertura-Alto-Bajo-Cierre) durante cuatro sesiones. El indicador también puede predecir los niveles de sesión. Las sesiones se pueden dibujar con líneas o rectángulos (vacíos o rellenos), las líneas se pueden extender a la siguiente sesión. Puede ocultar/mostrar fácilmente cada sesión presionando las teclas de acceso rápido (de forma predeterminada, '1', '2', '3', '4'). Puede ver líneas ASR (rango de sesión p
Modificación multidivisa y multitemporal del indicador Índice de Fuerza Relativa (RSI). Puede especificar las monedas y plazos que desee en los parámetros. Además, el panel puede enviar notificaciones cuando se cruzan niveles de sobrecompra y sobreventa. Al hacer clic en una celda con un punto, se abrirá este símbolo y punto. Este es el escáner MTF. La clave para ocultar el panel del gráfico es "D" de forma predeterminada. De manera similar al medidor de fortaleza de la moneda, el Panel pue
Gann Box (o Gann Square) es un método de análisis de mercado basado en el artículo "Fórmula matemática para predicciones de mercado" de W.D. Gann. Este indicador puede trazar tres modelos de cuadrados: 90, 52 (104), 144. Hay seis variantes de cuadrículas y dos variantes de arcos. Puede trazar varios cuadrados en un gráfico simultáneamente. Parámetros Square — selección de un modelo cuadrado: 90 — cuadrado de 90 (o cuadrado de nueve); 52 (104) — cuadrado de 52 (o 104); 144 — cuadrado univer
The indicator calculates the inclination angle between the Highs, Lows and Closes of adjacent bars. The angle can be measured in degrees or radians. A linear graph or a histogram is drawn in a subwindow. You can set the scale for the calculation — floating or fixed. For use in Expert Advisors or indicators, you need to specify a fixed scale. Parameters Angular measure — degrees or radians. Scale mode for calculation — scaling mode. Free scale — free transformation, the indicator will calculate
FREE
Filtro:
Devonish
2950
Devonish 2020.11.06 12:57 
 

I don't know why no one has given this a positive review before? I guess that depends on wether you like using RSI? I use this indicator set one time frame above, and one below the current tf. I like it.

immortalalex
21
immortalalex 2020.01.13 20:00 
 

вот и весь ваш индикатор так https://charts.mql5.com/23/262/ed-3-20-m1-ao-otkritie-broker.png

Respuesta al comentario
Versión 1.20 2021.12.01
1) Recompilation and algorithm improvement.
Versión 1.1 2016.12.21
Fixed bug removing objects at startup.