• Información general
  • Comentarios (14)
  • Discusión (102)
  • Novedades

ZigZag Lines MTF

4.33
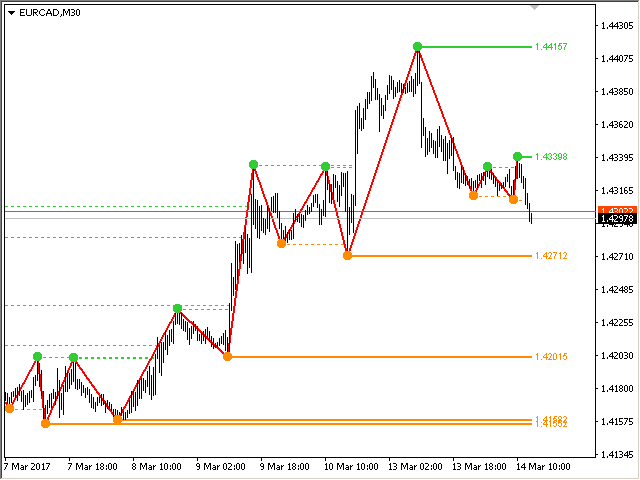
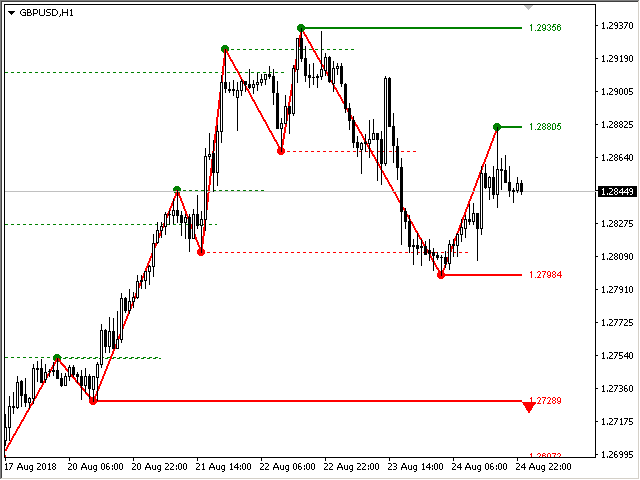
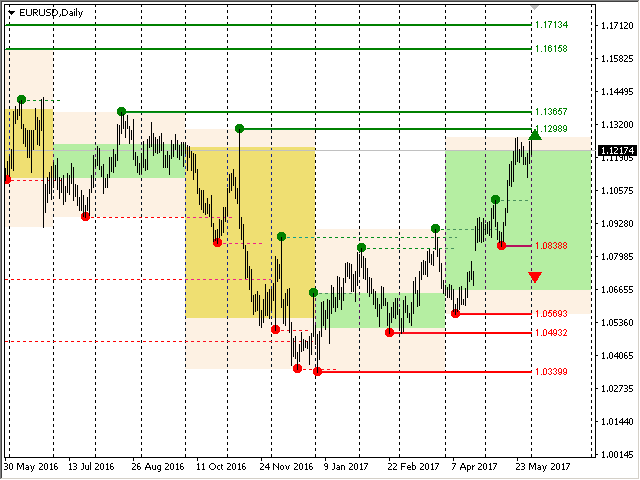
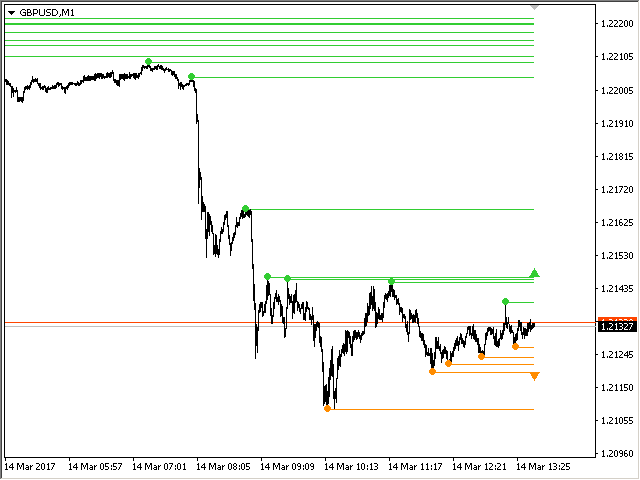
Indicador ZigZag de múltiples marcos temporales. Muestra las líneas horizontales de soporte/resistencia y sus rupturas, además de dibujar los objetivos actuales del mercado. También puede mostrar líneas del indicador Fractales y velas de otros períodos (hasta Trimestral).

El indicador vuelve a dibujar el último punto (actual) y, en algunos casos, puede cambiar los últimos 2 o 3 puntos.

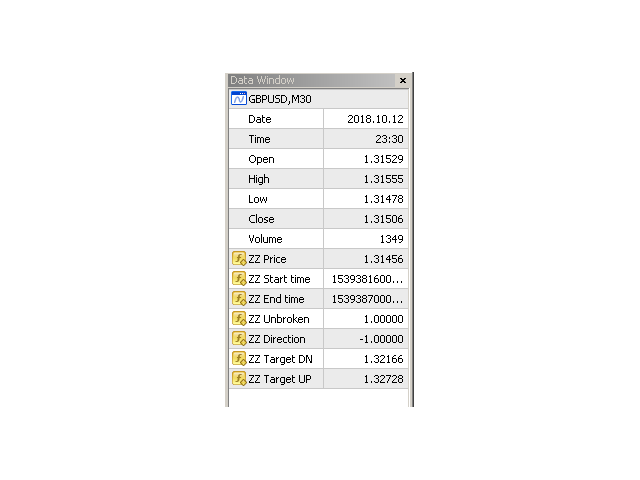
Todas las líneas están dibujadas como objetos (no como buffers de indicadores, pero existe la posibilidad de recibir los datos para el EA).
Cuando se utiliza en un Asesor Experto, puede leer puntos ZigZag usando iCustom.

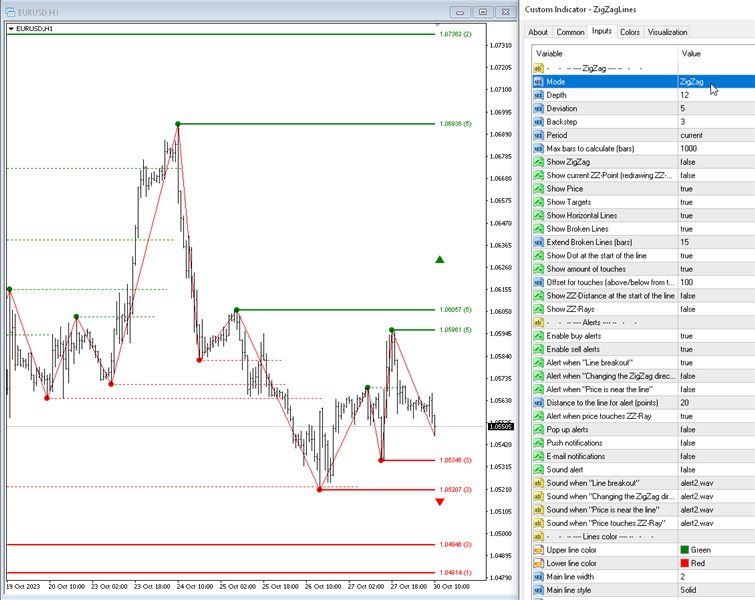
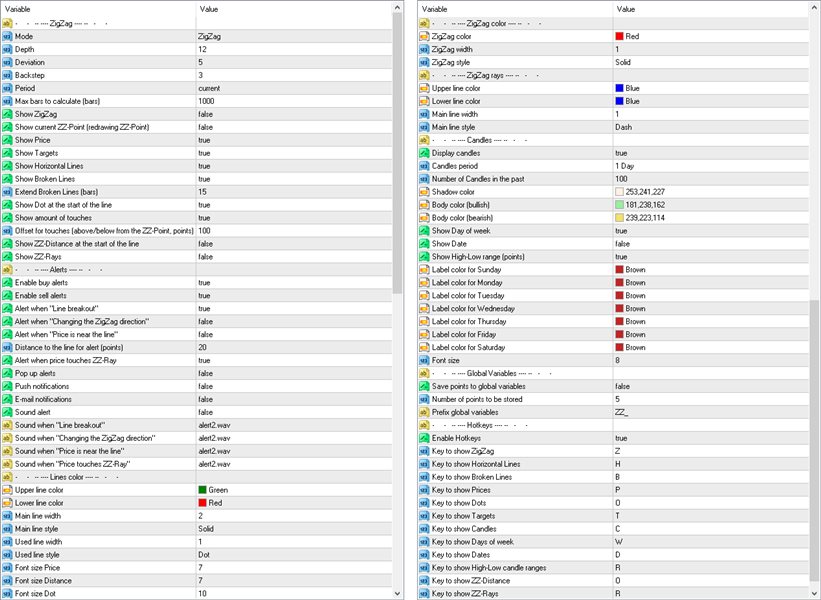
Ajustes

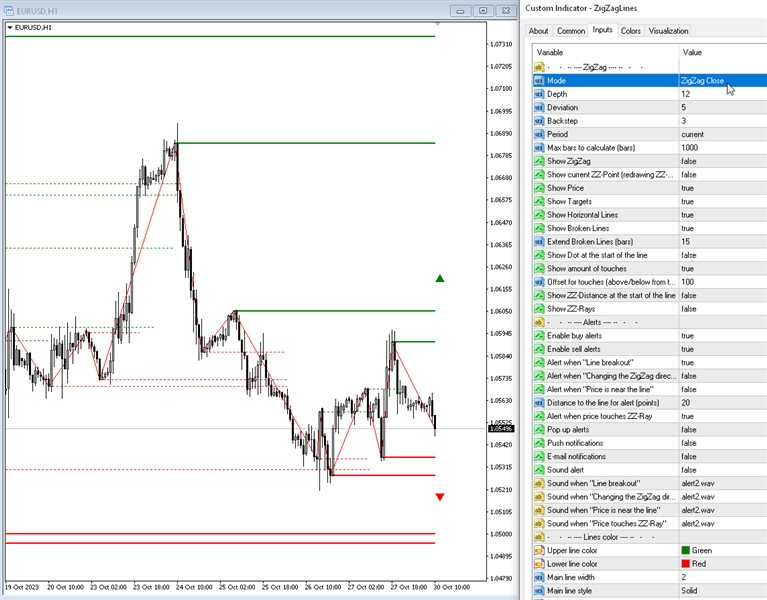
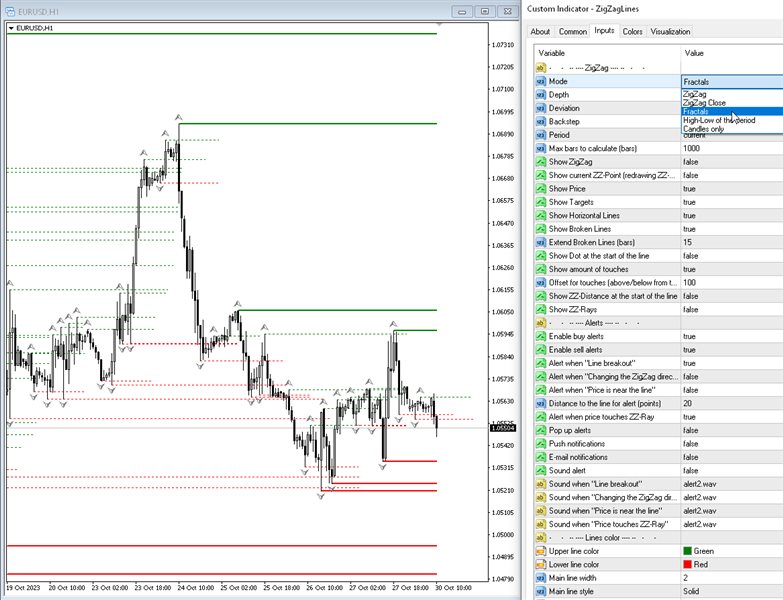
Modo: dibuja niveles de soporte y resistencia basados en:
—  Zig Zag — el indicador ZigZag;
—  ZigZag Close — el indicador de cierre de ZigZag;
—  Fractals — el indicador Fractales;
—  High-Low of the period — construcción del indicador por niveles alto-bajo. El período de tiempo se especifica en el parámetro Período;
—  Candles only — sacar sólo velas;
Depth — el número mínimo de velas para las cuales Zigzag no dibujará el segundo máximo (o mínimo), si la última tiene una Desviación menor (o mayor) que la anterior;
Deviation — el número mínimo de puntos entre los máximos y mínimos de dos velas adyacentes para que el Zigzag forme un máximo o mínimo local;
Backstep — el número mínimo de velas entre los máximos y mínimos locales;
Period — período para el cálculo del ZigZag de Fractales;
Max bars to calculate (bars) — el número máximo de barras para el cálculo. Esta limitación se introduce para acelerar los cálculos;

Mostrar en el gráfico

Show Zigzag — muestra el ZigZag;
Show current ZZ-point (redrawing point) — muestra el (último) punto actual;
Show Price — muestra el precio de los niveles;
Show Targets — muestra los objetivos actuales (hacia dónde se dirige el mercado);
Show broken lines) — muestra los niveles discontinuos;

Check the breakout of the Lines by price: — Consulta el desglose de las Líneas por precio:
  • High-Low (current bar) — Alto-Bajo (barra actual)
  • High-Low (previous bar) — Alto-Bajo (barra anterior)
  • Close (previous bar) — Cerrar (barra anterior)
  • Open (current bar) — Abrir (barra actual)
Extend broken lines (bars) — extiende las líneas discontinuas hacia la derecha el número de barras especificado;
Show Dot at the start of the line — muestra puntos en los puntos de giro del indicador;
Show amount of touches — muestra la cantidad de toques cerca del precio de la línea;
Offset for touches (above/below from the ZZ-point, points) — el rango en el que se considerará que el punto ZZ toca el nivel.

Alertas

Pop up alerts — alerta emergente al tocar un nivel;
Push notifications — notificación push;
E-mail notifications — notificación por correo electrónico;
Sound alert — alerta sonora al tocar un nivel;
Alert when "Line breakout" — alerta cuando se rompe el nivel de ZigZag;
Alert when "Changing the ZigZag direction" — alerta al cambiar la dirección del ZigZag;
Alert when "Price is near the line" — alerta si el precio está cerca del nivel (una vez que hay una barra, el punto actual del ZigZag no está marcado);
Distance to the line for alert (points) — distancia de alerta (en puntos);

Colores

Upper line color — color de las líneas superiores;
Lower line color — color de las líneas inferiores;
Main line width — ancho de la línea principal;
Main line style — estilo de la línea principal;
Used line width — ancho de la línea utilizada;
Used line style — estilo de la línea usada;
Font size price — tamaño de fuente para los Precios;
Font size dot — tamaño de fuente para los puntos;
ZigZag color — color del ZigZagа;
ZigZag width — ancho de las líneas de ZigZag;
ZigZag style — estilo de las líneas ZigZag;

Velas

Display candles — habilite la exhibición de velas de otros períodos;
Candles period — periodo para las velas, todas las estándar más Trimestral;
Number of Candles in the past — el número de velas en el gráfico;
Shadow color — vela de las mechas de las velas;
Body color (bullish) — vela del cuerpo de una vela alcista;
Body color (bearish) —  color del cuerpo de una vela bajista;
Save points to global variables — almacene puntos en las Variables globales del terminal;
Number of points to be stored — número de puntos que se almacenarán (el punto actual es cero);
Prefix global variables — prefijo para nombres de variables globales.
Comentarios 14
Nicolas Dobrovsky
789
Nicolas Dobrovsky 2024.08.11 09:46 
 

Truly one of the best indicators you can find for finding liquidity. Great support.

John Mlay
181
John Mlay 2024.03.26 21:26 
 

Good support

GoodMorningg
529
GoodMorningg 2023.08.26 21:22 
 

Лучшие продукты на маркете! Лучшая поддержка от разработчика!

Productos recomendados
Introduction to Smart Renko The main characteristics of Renko Charting concern price movement. To give you some idea on its working principle, Renko chart is constructed by placing a brick over or below when the price make the movement beyond a predefined range, called brick height. Therefore, naturally one can see clear price movement with less noise than other charting type. Renko charting can provide much clearer trend direction and it helps to identify important support and resistance level
Power Renko is an indicator which plots Renko bricks underneath the chart using a histogram. You can select the brick size and the timeframe of the Renko bricks as well as whether or not to use the close price or the high/low price of the candles. Renko bricks are based on price alone, not time, therefor the Renko bricks will not be aligned with the chart's time. They are extremely useful for trend trading and many different strategies can be formed from them. Buffers are provided allowing you t
FRB Time MT4
Fernando Baratieri
FRB Time - FRB Trader Indicator that shows the server's time of operation. You can edit the font color and size of the timetable. Settings font color Font size Background color To move the Timetable, just click on it and move the mouse to where you want to leave it. After placing the Time where you want it, click again or press "ESC" and the time will stay where you left it.
FREE
Median Renko Terminator works best with renko charts if you do not have a renko chart generator I will email it to you for free and give you the correct settings for scalping or to swing trade NON-REPAINT  COMES WITH ALERTS WHEN THERE IS A SIGNAL Conditions to sell: big purple arrow shows you the direction first then you take the small purple arrow to enter the same direction of the purple arrow. Conditions to buy: big white arrow shows you the up direction first then you take small white arrow
The indicator displays Renko bars on the chart, uses their data to calculate and display the moving average, PriceChannel and generates buy/sell signals. Renko is a non-trivial price display method. Instead of displaying each bar within a time interval, only the bars where the price moved a certain number of points are shown. Renko bars do not depend on a time interval, therefore the indicator works on any timeframe without losing its efficiency. The PriceChannel indicator displays the upper, lo
Identify Take
Oleksii Ferbei
4.5 (2)
Identify Take - trend trading strategy, market noise filtering and all necessary functions built into one tool! The system itself shows in the form of arrows when to buy and when to sell. Uses only one setting parameter. Simple, visual and effective trend detection. The intelligent algorithm of the Identify Take indicator shows the points of a potential market reversal. Most often, a good trend can be seen visually on the price chart. But an experienced trader must clearly understand the curr
Holy Renko PRO
Bianca Seara
3.5 (2)
About  Holy Renko is a trend identifier capable of identify small and long market movements. This indicator should be use in Renko Charts. VIDEO (information and tips) [HERE] How to install Renko Charts [HERE] Features Developed for Renko Charts Easy to analyze Fast signals Not repaint (when candle close)  Statistics panel Filters false signals Alerts, emails and push notifications  Advantages of Renko Chart Easy to install Easy to analyze Filter out the noise of wicks  Easy ide
Rira Renko
Vitor Palmeira Abbehusen
RENKO on Time Chart This indicator is an enhanced Renko, so you can watch the Renko bricks on the chart to understand price movement more clearly the other improvement is automated box size according to ATR (Average True Range) period you can set the ATR number as you want and the box size of Renko changes automatically based on price movement Inputs Mode: Box size is the input to specify the size of the Renko box you want to print on the chart. This input lets you choose the fixed b
This indicator displays the ZigZag Pointer Fibonacci Expansion Triangle movements timeframes only M1-W1. Parameters InDepth: Displays the Depth movements. InDeviation: Displays the Deviation movements. InBackstep: Displays the Backstep movements. Fibonacci Expansion: Displays the Fibonacci Expansion movements. Fibonacci Expansion true.(false) Triangle: Displays the Triangle movements. Triangle true.(false) How to understand the status: If the Triangle is green, trend is up. If the Triangle is
CyberZingFx Volume
Afsal Meerankutty
4.74 (35)
CyberZingFx Volume Indicator is designed to help traders find market reversals with ease. This powerful tool uses a unique strategy that combines both volume and historical price to provide accurate signals for potential market reversals. The indicator displays volume BUY and SELL power values on the right side of the chart for both BUY and SELL. With customizable settings, you can set alerts at different levels to suit your trading style. The most recent alert value is displayed as Alert High,
FREE
The Renko indicator is a technical analysis tool used in the forex market to visualize price movements and trends by eliminating market "noise." Unlike traditional candlestick or bar charts, Renko is built based on price changes of a specified number of points, called the "brick size." When the price moves by this amount of points, a new "brick" is added to the chart. This indicator ignores time and volume, focusing exclusively on price changes. The main features of the Renko indicator include:
This is an indicator for additional signal filtering. It can be used as an additional filter in a trading system. The indicator does not redraw its data and can be used both in forex trading and with binary options. It has 3 operation modes and flexible sensitivity settings. The indicator uses multiple buffers, therefore it can be easily used in various Expert Advisors.
极大的提升了交易感官,一目了然的走势展示,简洁高效。 极大的突出展示了行情的趋势脉络,跟随时间周期适应变化,替用户交易者研判了行情走势,简洁高效 同时我们还提供了主窗口和副窗口的展现,有需要可以联系我作者本人,感谢支持。 像传统的renko,又不是传统的renko,技术在发展,同样的砖图可以有不一样的绘制和计算展现。 希望可以帮到大家的交易,再次感谢。 极大的提升了交易感官,一目了然的走势展示,简洁高效。 极大的突出展示了行情的趋势脉络,跟随时间周期适应变化,替用户交易者研判了行情走势,简洁高效 同时我们还提供了主窗口和副窗口的展现,有需要可以联系我作者本人,感谢支持。 像传统的renko,又不是传统的renko,技术在发展,同样的砖图可以有不一样的绘制和计算展现。 希望可以帮到大家的交易,再次感谢。
Chaos Trader Lite attempts to use aspects of chaos theory to place trades in the marketplace. This Expert Advisor, in particular, draws upon theories made by Bill Williams. Every version of MetaTrader contains the Bill Williams indicators. I wondered why was he deemed so important as to have his own set of indicators added to MetaTrader with name attribution. Conducting research I found that Bill Williams wrote a book using chaos theory to trade the markets. The Bill Williams indicators are usef
FREE
Velas RENKO
Ramon Sobrevals Arce
Immediately plots renko bars in an external/indicator window.  One of the distinctive advantages Renko charts offer is the fact that they are not time dependent. Therefore, the new Renko blocks are only traced when the price moves higher or lower by the specified number of points.  For example, a 10 pip (100 points) Renko chart would plot the blocks when price moves 10 pips higher in an uptrend or 10 pips lower in a downtrend. Renko charts removes "noises" from the Market and i t helps to ident
Trade Direction
Gevorg Hakobyan
5 (1)
The oscillator shows trend direction using its own algorithm, which is based on calculating price values ​​by analyzing prices of separate currencies (original valuation of currencies). The histogram shows the average value of physical price change over the selected period. When the histogram has a positive value, the trend is rising, if negative - the trend id falling. The indicator uses standard RSI to determine the current market direction on a selected period as follows: the default value of
Bigger chart labels would allow the user to be entirely aware of which chart he/she is on. Each chart window is unique, containing different patterns and economic motives so acknowledging the chart window would be absolutely essential! There are well known Economic Time Zones included in clear view, by choice!    Simple does it! Use your computing mouse scroller, clicking with the right finger on the label, in order to customize the label properties. From there, choose your preferred color, fon
FREE
Market Imbalance
Scott Edward Merritt
4.71 (14)
What Is Market Imbalance? Market Imbalance, also known as "IPA" or Improper Price Action, is when price moves so quick in one direction with no orders on the other side of the market to mitigate the price movement. We all know Big Banks, or "Smart Money", can move the market by placing huge orders which in turn can move price significantly. They can do this because Big Banks are the top 10 Forex traders in the world . But unfortunately, the Big Banks cannot leave these orders in drawdown and mus
Auto Order Block with break of structure based on ICT and Smart Money Concepts (SMC) Futures Break of Structure ( BoS )             Order block ( OB )            Higher time frame Order block / Point of Interest ( POI )    shown on current chart           Fair value Gap ( FVG ) / Imbalance   -  MTF      ( Multi Time Frame )    HH/LL/HL/LH  -  MTF      ( Multi Time Frame )  Choch  MTF      ( Multi Time Frame )  Volume Imbalance     ,  MTF          vIMB Gap’s Power of 3 Equal High
The Penta-O is a 6-point retracement harmonacci pattern which usually precedes big market movements. Penta-O patterns can expand and repaint quite a bit. To make things easier this indicator implements a twist: it waits for a donchian breakout in the right direction before signaling the trade. The end result is an otherwise repainting indicator with a very reliable trading signal. The donchian breakout period is entered as an input. [ Installation Guide | Update Guide | Troubleshooting | FAQ | A
MultiFiboDynamicMT4 is a powerful, professional indicator for estimating the most important support and resistance levels. The main advantage is that it plots the Fibonacci levels at all timeframes simultaneously, which allows the trader to see the full picture of the possible price movement of the trading instrument! Advantages of the indicator The indicator is perfect for scalping and trading binary options. Suitable for beginners and experienced traders. Works on all timeframes. Works on an
FREE
MASi Three Screens
Aleksey Terentev
5 (2)
MASi Three Screens is based on the trading strategy by Dr. Alexander Elder. This indicator is a collection of algorithms. Algorithms are based on the analysis of charts of several timeframes. You can apply any of the provided algorithms. List of versions of algorithms:     ThreeScreens v1.0 - A simple implementation, with analysis of the MACD line;     ThreeScreens v1.1 - A simple implementation, with analysis of the MACD histogram;     ThreeScreens v1.2 - Combines the first two algorithms
FREE
Smart ZigZag
Nikolay Likhovid
Smart ZigZag indicator is a ZigZag, for which the market is actually not accidental. This is not mere words, as this can be confirmed by displayed charts comparing Smart ZigZag and HZZ parameters. But before I describe the screenshots, let's examine a few details concerning Smart ZigZag. This indicator analyzes the chart and identifies certain activity horizons assigning numbers to them. This can be called ranking. For example, M1 EURUSD chart from 4.01.1999 to 3.12.2013 has the average segment
Master Scalping M1 es un indicador innovador que utiliza un algoritmo para determinar la tendencia de forma rápida y precisa. El indicador calcula el tiempo de apertura y cierre de posiciones, los algoritmos del indicador le permiten encontrar los momentos ideales para ingresar a una operación (comprar o vender un activo), lo que aumenta el éxito de las transacciones para la mayoría de los comerciantes. Beneficios del indicador: Fácil de usar, no sobrecarga el gráfico con información innecesari
Renko Bars 3in1
Yuriy Shatsckiy
5 (2)
The Renko_Bars_3in1 is designed for plotting 3 types of Offline Renko charts. Standard Renko Bar (the reversal bar is twice the size of the bar). Renko Range Bar (the size of all bars is the same). Renko Bars with the ability to adjust the size of the reversal bar. Attention : The demo version for review and testing can be downloaded here . Note . A chart with the M1 period is necessary to build an offline chart. When the indicator is attached to a chart, the offline chart is opened automaticall
Ultimate Renko
Artur Zas
4.58 (12)
Ultimate Renko is a full implementation of a robust Renko style charting solution for MT4. It enables creating custom live charts resembling Median Renko , Mean Renko , Turbo Renko , and Better Renko candles as well as Vanilla Renko and Renko with wicks , PointO charts, and many more. This all-in-one package provides all of the signals needed by day traders, scalpers, and even long-term traders. You can apply all of the standard and custom indicators and technical studies as well as templates to
MAMA macd AM
Andriy Matviyevs'kyy
This indicator is a classic indicator of technical analysis - MACD. Unlike the classic MACD indicator, the presented indicator is calculated as follows: - the first smoothing signal is one of the standard methods used to create moving averages. - secondary smoothing method used in MAMA/FAMA indicators. - calculation of the difference between MAMA/FAMA values. The indicator gives signals about a change in trend direction, as well as signals about weakening or strengthening of the trend. The ind
Renko, Heiken Ashi, Ticks Bar, Range Bar.    Easy switching, easy setup, all in one window.        Place the Custom Chart indicator and view Renko, Heiken Ashi, Tick bar, Range bar charts in real time at real chart.    Position the offline chart window so that the indicator control panel is visible.    Switch the chart mode by click of a button.    Connect to the output chart any indicator, expert advisor without any restrictions.    No, it doesn't work in the tester.    Yes, you can use an
Chaser
Thebo Junior Mahlangu
Introduction  This Indicator Is Based On Average Price/Maximum Price Moves, And Using Moving Bollinger Bands And Moving Averages. The Advantage Of Using It With YOUR own Analysis Will Confirm Potential Supports And Resistances While it Compliments With Your Analysis  The Indicator Is Non-Repainting AND Along With Our Special Trend METRE that Changes With The Conditions OF A Bullish Or Bearish Trend....  Recommend Time-Frames: H1  H4 M15 Usage: The Indicator Is Very Profitable I
FREE
MetaWaves
Stanislav Korotky
This indicator was inspired by М & W Wave Patterns by A. Merrill. 5 extremums or 4 edges of ZigZag are enough to build M or W pattern at arbitrary offset in the history. The classical approach includes a table of predefined figures of ZigZag waves, which can transform into each other under special rules—so that next edge can be forecasted based on these rules. Unlike to this approach, the indicator analyses available history and builds statistics for all M and W patterns, which differ in their c
Los compradores de este producto también adquieren
Gann Made Easy
Oleg Rodin
4.85 (82)
Gann Made Easy es un sistema de comercio de Forex profesional y fácil de usar que se basa en los mejores principios de comercio utilizando la teoría del Sr. W. D. Gann. El indicador proporciona señales precisas de COMPRA y VENTA, incluidos los niveles de Stop Loss y Take Profit. Puede comerciar incluso sobre la marcha utilizando notificaciones PUSH. ¡Por favor, póngase en contacto conmigo después de la compra! ¡Compartiré mis consejos comerciales con usted y excelentes indicadores de bonificació
TPSpro RFI Levels
Roman Podpora
4.82 (22)
反转第一脉冲水平 (RFI)     指示     俄羅斯     -        ESP   Recomendamos utilizar con   el indicador -   TPSpro 趋势专业版 -   MT5版本 Un elemento clave importante en el comercio son las zonas o niveles a partir de los cuales se toman decisiones para comprar o vender un instrumento comercial. A pesar de los intentos de los grandes actores de ocultar su presencia en el mercado, inevitablemente dejan rastros. Nuestra tarea era aprender a encontrar estos rastros e interpretarlos correctamente. Funciones principales:
Atomic Analyst
Issam Kassas
5 (2)
En primer lugar, vale la pena enfatizar que este Indicador de Trading no repinta, no redibuja y no se retrasa, lo que lo hace ideal tanto para el trading manual como para el automatizado. Manual del usuario: configuraciones, entradas y estrategia. El Analista Atómico es un Indicador de Acción del Precio PA que utiliza la fuerza y el impulso del precio para encontrar una mejor ventaja en el mercado. Equipado con filtros avanzados que ayudan a eliminar ruidos y señales falsas, y aumentan el poten
Gold Stuff
Vasiliy Strukov
4.89 (238)
Gold Stuff: un indicador de tendencia diseñado específicamente para el oro, también se puede usar en cualquier instrumento financiero. El indicador no se vuelve a dibujar ni se retrasa. El marco de tiempo recomendado es H1. Este indicador está escrito por EA Gold Stuff Advisor, puede encontrarlo en mi perfil.  Puede obtener una copia gratuita de nuestro indicador Strong Support y Trend Scanner, por favor envíe un mensaje privado. ¡a mí! IMPORTANTE! Póngase en contacto conmigo inmediatamente d
Trend Punch
Mohamed Hassan
4.95 (19)
This indicator is unstoppable when combined with our other indicator called  Support & Resistance . After purchase, send us a message and you will get it   for  FREE as a BONUS! Introducing Trend Punch , the revolutionary forex trend indicator that will transform the way you trade! Trend Punch is uniquely designed to provide precise buy and sell arrows during strong market trends, making your trading decisions clearer and more confident. Whether you're trading major currency pairs or exotic sym
TPSproTREND PrO
Roman Podpora
4.79 (19)
TPSpro TREND PRO   es un indicador de tendencia que analiza automáticamente el mercado y proporciona información sobre la tendencia y cada uno de sus cambios, además de dar señales para ingresar operaciones sin volver a dibujar. El indicador utiliza cada vela, analizándolas por separado. refiriéndose a diferentes impulsos: impulso hacia arriba o hacia abajo. ¡Puntos de entrada exactos a transacciones de divisas, criptomonedas, metales, acciones e índices! Versión MT5                   DESCRIPCI
Scalper Inside PRO
Alexey Minkov
4.73 (56)
An exclusive indicator that utilizes an innovative algorithm to swiftly and accurately determine the market trend. The indicator automatically calculates opening, closing, and profit levels, providing detailed trading statistics. With these features, you can choose the most appropriate trading instrument for the current market conditions. Additionally, you can easily integrate your own arrow indicators into Scalper Inside Pro to quickly evaluate their statistics and profitability. Scalper Inside
FX Power MT4 NG
Daniel Stein
5 (12)
Obtenga su actualización diaria del mercado con detalles y capturas de pantalla a través de nuestro Morning Briefing aquí en mql5 y en Telegram ! FX Power MT4 NG es la nueva generación de nuestro popular medidor de fuerza de divisas, FX Power. ¿Y qué ofrece este medidor de fuerza de nueva generación? Todo lo que le encantaba del FX Power original PLUS Análisis de fuerza de ORO/XAU Resultados de cálculo aún más precisos Períodos de análisis configurables individualmente Límite de cálculo persona
Trend Screener
STE S.S.COMPANY
4.8 (87)
Indicador de tendencia, solución única e innovadora para el comercio y filtrado de tendencias con todas las funciones de tendencias importantes integradas en una sola herramienta. Es un indicador 100% sin repintar de marcos temporales y monedas múltiples que se puede usar en todos los símbolos/instrumentos: divisas, materias primas, criptomonedas, índices y acciones. OFERTA POR TIEMPO LIMITADO: El indicador de detección de soporte y resistencia está disponible por solo 50$ y de por vida. (Precio
¡Actualmente 20% OFF ! ¡La mejor solución para cualquier novato o trader experto! Este software funciona con 28 pares de divisas. Se basa en 2 de nuestros principales indicadores (Advanced Currency Strength 28 y Advanced Currency Impulse). Proporciona una gran visión general de todo el mercado de divisas. Muestra los valores de Advanced Currency Strength, la velocidad de movimiento de las divisas y las señales para 28 pares de divisas en todos los (9) marcos temporales. Imagine cómo mejorar
FX Volume
Daniel Stein
4.58 (33)
Obtenga su actualización diaria del mercado con detalles y capturas de pantalla a través de nuestro Morning Briefing aquí en mql5 y en Telegram ! FX Volume es el PRIMER y ÚNICO indicador de volumen que proporciona una visión REAL del sentimiento del mercado desde el punto de vista de un bróker. Proporciona una visión impresionante de cómo los participantes institucionales del mercado, como los brokers, están posicionados en el mercado Forex, mucho más rápido que los informes COT. Ver esta info
ACTUALMENTE 31% DE DESCUENTO Este indicador es una herramienta de transacción única, de alta calidad y asequible porque hemos incorporado una serie de características propias y una fórmula secreta. Con solo un gráfico, da Alertas para los 28 pares de divisas. ¡Imagina cómo mejorarás porque puedes identificar el punto de activación exacto de una nueva tendencia u oportunidad de crecimiento! Basado en nuevos algoritmos subyacentes , hace que sea aún más fácil identificar y confirmar operaciones po
Enigmera
Ivan Stefanov
5 (3)
ENIGMERA: El núcleo del mercado https://www.enigmera.com Introducción Este indicador y sistema de negociación es un enfoque extraordinario de los mercados financieros. ENIGMERA utiliza los ciclos fractales para calcular con precisión los niveles de soporte y resistencia. Muestra la auténtica fase de acumulación y proporciona dirección y objetivos.  Un sistema que funciona tanto si estamos en una tendencia como en una corrección.  ¿Cómo funciona? ENIGMERA consta de tres líneas: la línea de s
- Real price is 80$ - 40% Discount ( It is 49$ now ) Contact me for instruction, add group and any questions! Related EA Product: Bitcoin Expert Introduction The breakout and retest strategy is traded support and resistance levels. it involves price breaking through a previous level.  The break and retest strategy is designed to help traders do two main things, the first is to avoid false breakouts. Many false breakouts start with a candlestick that breaks out of a level but ends with an immedi
El indicador Chart Patterns All-in-One ayuda a los traders a visualizar varios patrones de gráficos comúnmente utilizados en el análisis técnico. Este indicador apoya la identificación de posibles comportamientos del mercado, pero no garantiza rentabilidad. Se recomienda probar el indicador en modo demo antes de comprar. Oferta actual : Descuento del 50% en el indicador "Chart Patterns All in One". Patrones incluidos : Patrón 1-2-3 : Detecta reversiones del mercado utilizando tres puntos clave (
ACTUALMENTE 26% DE DESCUENTO ¡La mejor solución para cualquier operador novato o experto! Este indicador es una herramienta única, de alta calidad y asequible porque hemos incorporado una serie de características propias y una nueva fórmula. ¡Con sólo UN gráfico puede leer la Fuerza de la Divisa para 28 pares de Divisas! Imagínese cómo mejorará su operativa porque podrá señalar el punto exacto de activación de una nueva tendencia o de una oportunidad de scalping. Manual del usuario: haga
Conviértase en un Breaker Trader y obtenga beneficios de los cambios en la estructura del mercado a medida que se invierte el precio. El indicador de ruptura de bloque de órdenes identifica cuándo una tendencia o movimiento de precio se acerca al agotamiento y está listo para revertirse. Le alerta sobre cambios en la estructura del mercado que generalmente ocurren cuando una reversión o un retroceso importante están a punto de suceder. El indicador utiliza un cálculo patentado que identific
Bomb Bank Signal
Igor Pereira Calil
5 (1)
Señal de Bomb Bank: su indicador de confianza en MetaTrader 4 Bomb Bank Signal es un poderoso indicador para MetaTrader 4, diseñado para identificar las tendencias más relevantes en el mercado financiero. Si buscas una herramienta que anticipe los movimientos con precisión, el Bomb Bank es el aliado que necesitas. Cómo funciona: Este indicador combina tres métodos distintos (análisis de volumen, cierre de velas y tendencia simétrica) para detectar y señalar oportunidades de compra y venta
Trend Cutter
Oleg Rodin
5 (2)
Trend Cutter es un indicador de tendencia que se puede utilizar con cualquier período de tiempo, incluidos los períodos de tiempo más bajos como M1 y M5. El indicador es ideal para los operadores que prefieren el comercio intradiario y también será útil para aquellos que prefieren el comercio a largo plazo. Puede utilizar este indicador como base para su sistema comercial o como una solución comercial independiente. El indicador proporciona todo tipo de alertas, incluidas notificaciones PUSH. El
TakePropips Donchian Trend Pro
Eric John Pajarillaga Aldana
4.44 (16)
¡TakePropips Donchian Trend Pro   (MT4) es una herramienta poderosa y efectiva que detecta automáticamente la dirección de la tendencia utilizando el Canal Donchian y le proporciona señales comerciales de entrada y salida! Este indicador multifunción incluye un escáner de tendencias, señales comerciales, panel estadístico, filtro, sesiones comerciales y panel de historial de alertas. ¡Está diseñado para proporcionarle señales comerciales y ahorrarle horas analizando los gráficos! Puede descargar
IX Power MT4
Daniel Stein
5 (5)
IX Power lleva por fin la insuperable precisión de FX Power a los símbolos que no son de Forex. Determina con exactitud la intensidad de las tendencias a corto, medio y largo plazo de tus índices, acciones, materias primas, ETF e incluso criptodivisas favoritas. Puede analizar todo lo que su terminal le ofrece. Pruébalo y experimenta cómo tu timing mejora significativamente a la hora de operar. Características principales de IX Power Resultados de cálculo 100% precisos y sin repintado -
Stratos Pali Indicator   is a revolutionary tool designed to enhance your trading strategy by accurately identifying market trends. This sophisticated indicator uses a unique algorithm to generate a complete histogram, which records when the trend is Long or Short. When a trend reversal occurs, an arrow appears, indicating the new direction of the trend. Important Information Revealed Leave a review and contact me via mql5 message to receive My Top 5 set files for Stratos Pali at no cost! D
Gold Channel is a volatility-based indicator, developed with a specific timing algorithm for the XAUUSD pair, which consists of finding possible corrections in the market. This indicator shows two outer lines, an inner line (retracement line) and an arrow sign, where the theory of the channel is to help identify overbought and oversold conditions in the market. The market price will generally fall between the boundaries of the channel. If prices touch or move outside the channel it is a tra
Advanced Supply Demand
Bernhard Schweigert
4.91 (294)
¡Actualmente con 33% de descuento! ¡La mejor solución para cualquier tráder principiante o experto! Este indicador es una herramienta comercial única, de alta calidad y asequible, porque incorpora una serie de características patentadas y una nueva fórmula. Con esta actualización, podrá mostrar zonas de doble marco temporal. No solo podrá mostrar un marco temporal más alto, sino también mostrar ambos, el marco temporal del gráfico MÁS el marco temporal más alto: MOSTRANDO ZONAS ANIDADAS. A todos
Dibuja automáticamente los niveles de soporte y resistencia MÁS los gaps de las velas de propulsión en su gráfico, para que pueda ver hacia dónde es probable que el precio se dirija a continuación y/o potencialmente retroceda. Este indicador está diseñado para ser utilizado como parte de la metodología de negociación de posiciones que se enseña en mi sitio web (The Market Structure Trader) y muestra información clave para la orientación y entradas potenciales. Hay 2 características PRINCIPA
Currency Strength Wizard es un indicador muy poderoso que le proporciona una solución todo en uno para operar con éxito. El indicador calcula el poder de este o aquel par de divisas utilizando los datos de todas las monedas en múltiples marcos de tiempo. Estos datos se representan en forma de índice de moneda fácil de usar y líneas eléctricas de moneda que puede usar para ver el poder de esta o aquella moneda. Todo lo que necesita es adjuntar el indicador al gráfico que desea operar y el indicad
Order Block Hunter
Noha Mohamed Fathy Younes Badr
5 (4)
Order block hunter indicator is the best indicator for  hunt the order blocks that area where there has been a large concentration of limit orders waiting to be executed Order blocks are identified on a chart by observing previous price action and looking for areas where the price experienced significant movement or sudden changes in direction .This indicator does that for you by using very complicated codes and helps you to take the best areas To buy and sell because it make marks at the best a
Este tablero es una herramienta de alerta para usar con el indicador de reversión de la estructura del mercado. Su propósito principal es alertarlo sobre oportunidades de reversión en marcos de tiempo específicos y también para volver a probar las alertas (confirmación) como lo hace el indicador. El tablero está diseñado para ubicarse en un gráfico por sí solo y funcionar en segundo plano para enviarle alertas sobre los pares y marcos de tiempo elegidos. Fue desarrollado después de que muchas p
El sistema PRO Renko es un sistema de trading de alta precisión especialmente diseñado para operar gráficos RENKO. Se trata de un sistema universal que se puede aplicar a diversos instrumentos de negociación. El sistema neutraliza eficazmente el llamado ruido de mercado, lo que le brinda acceso a señales de reversión precisas. El indicador es muy fácil de usar y solo tiene un parámetro responsable de la generación de señales. Puede adaptar fácilmente la herramienta a cualquier instrumento com
Trend Pulse
Mohamed Hassan
5 (4)
Please contact me after purchase to immediately get your PDF strategy + documentation for Trend Pulse !  Introducing Trend Pulse , a unique and robust indicator capable of detecting bullish, bearish, and even ranging trends! Trend Pulse uses a special algorithm to filter out market noise with real precision. If the current symbol is moving sideways, Trend Pulse will send you a ranging signal, letting you know that it's not a good time to enter a trade. This excellent system makes Trend Pulse
Otros productos de este autor
ADX Dashboard MT5
Taras Slobodyanik
5 (4)
El indicador ADX se utiliza para determinar la tendencia y su fuerza. La dirección del precio se muestra mediante los valores +DI y -DI, y el valor ADX muestra la fuerza de la tendencia. Si +DI está por encima de -DI, entonces el mercado está en una tendencia alcista, si por el contrario, está en una tendencia bajista. Si ADX está por debajo de 20, entonces no hay una dirección definida. Tan pronto como el indicador supera este nivel, comienza una tendencia de fuerza media. Los valores superior
Time Scale for MT5
Taras Slobodyanik
4.68 (19)
The indicator draws the time scale on the chart. You can specify the time offset, adjust the size and font to display on the chart ( it is displaying your local time on your chart instead of MT time ). You can also select the desired format for displaying the date and time. You may be interested in my other product , which contains a more advanced version of the Time Scale . Parameters Hours (time shift) — time shift (hours); Minutes (time shift) — time shift (minutes); Show time on mouse — sh
FREE
Modificación multidivisa y multitemporal del Oscilador Estocástico. Puede especificar las monedas y plazos que desee en los parámetros. El panel muestra los valores actuales y las intersecciones de las líneas - Señal y Principal (cruce estocástico). Además, el indicador puede enviar notificaciones cuando se cruzan niveles de sobrecompra y sobreventa. Al hacer clic en una celda con un punto, se abrirá este símbolo y punto. Este es el escáner MTF. De manera similar al medidor de fortaleza de la m
Modificación multidivisa y multitemporal del indicador Índice de Fuerza Relativa (RSI). Puede especificar las monedas y plazos que desee en los parámetros. Además, el panel puede enviar notificaciones cuando se cruzan niveles de sobrecompra y sobreventa. Al hacer clic en una celda con un punto, se abrirá este símbolo y punto. Este es el escáner MTF. La clave para ocultar el panel del gráfico es "D" de forma predeterminada. De manera similar al medidor de fortaleza de la moneda, el Panel pue
Indicador Heikin Ashi multidivisa y multiplazo. Muestra el estado actual del mercado. En el panel del escáner puede ver la dirección, la fuerza y el número de barras de la tendencia actual. Las velas de Consolidación/Reversión también se muestran usando colores. Puede especificar las monedas y períodos que desee en los parámetros. Además, el indicador puede enviar notificaciones cuando cambia la tendencia o cuando aparecen velas de reversión y consolidación (dojis). Al hacer clic en una celda,
Angle Dashboard for MT5
Taras Slobodyanik
5 (1)
This is a multicurrency and multitimeframe indicator that calculates the angle between two points. Points for measuring the angle can be taken from the ZigZag (the last two points), or from the Moving Average (between two given bars), or it can be the closing prices of bars. Angle measurement is possible in degrees or in radians. You can select the scale for the calculation. For a better understanding of the indicator, you can study the free Angle High Low indicator. In the parameters you can
Modificación multidivisa y multitemporal del indicador Bandas de Bollinger. En el tablero puedes ver rupturas y toques de las Bandas de Bollinger. En los parámetros puede especificar las monedas y plazos que desee. El indicador también puede enviar notificaciones cuando el precio toca las Bandas de Bollinger, cuando la volatilidad actual cambia (se expande o cae) y cuando el precio toca todas las bandas. Al hacer clic en una celda con un punto, se abrirá este símbolo y punto. Este es el escáner
ZigZag Lines MTF for MT5
Taras Slobodyanik
5 (8)
Indicador ZigZag de múltiples marcos temporales. Muestra las líneas horizontales de soporte/resistencia y sus rupturas, además de dibujar los objetivos actuales del mercado. También puede mostrar líneas del indicador Fractales y velas de otros períodos (hasta Trimestral). El indicador vuelve a dibujar el último punto (actual) y, en algunos casos, puede cambiar los últimos 2 o 3 puntos. Todas las líneas están dibujadas como objetos (no como buffers de indicadores, pero existe la posibilidad
Heikin Ashi Dashboard
Taras Slobodyanik
5 (4)
Indicador Heikin Ashi multidivisa y multiplazo. Muestra el estado actual del mercado. En el panel del escáner puede ver la dirección, la fuerza y el número de barras de la tendencia actual. Las velas de Consolidación/Reversión también se muestran usando colores. Puede especificar las monedas y períodos que desee en los parámetros. Además, el indicador puede enviar notificaciones cuando cambia la tendencia o cuando aparecen velas de reversión y consolidación (dojis). Al hacer clic en una celda,
Lines Profit Loss MT5
Taras Slobodyanik
4.58 (12)
El indicador muestra ganancias (pérdidas) en el símbolo actual. Puede arrastrar y soltar libremente la línea para mostrar la ganancia o pérdida actual. Parámetros Calculation in money or in points — calcula la ganancia/pérdida en puntos o en dinero. Add pending orders to calculate — tenga en cuenta las órdenes pendientes en los cálculos. Magic Number (0 - all orders on symbol) — número mágico, si es necesario evaluar órdenes específicas. Offset for first drawing (points from the average p
FREE
MACD Dashboard
Taras Slobodyanik
Indicador MACD multidivisa y multiplazo. El panel puede mostrar tanto el MACD tradicional (verdadero) como el MACD integrado en MetaTrader. En el panel puede ver el estado actual del indicador: la dirección del movimiento de las líneas MACD, su intersección y una ventana emergente con el gráfico del indicador. En los parámetros puede especificar los pares-símbolos y plazos que desee. El escáner también puede enviar notificaciones sobre líneas que se cruzan entre sí y sobre líneas que cruzan e
ZigZag Dashboard for MT4
Taras Slobodyanik
4.75 (4)
Modificación multidivisa y multitemporal del indicador ZigZag. Muestra la dirección actual del mercado, la altura del último movimiento, el número de barras de este movimiento y la ruptura del punto anterior del ZigZag (línea horizontal). Este es el escáner MTF. Puede especificar las monedas y plazos que desee en los parámetros. Además, el panel puede enviar notificaciones cuando el ZigZag cambia de dirección o cuando se produce un avance en el punto anterior. Al hacer clic en una celda con u
Pro Sessions MT4
Taras Slobodyanik
4.67 (3)
Este es un indicador de sesiones de negociación que puede mostrar todos los niveles (Apertura-Alto-Bajo-Cierre) durante cuatro sesiones. El indicador también puede predecir los niveles de sesión. Las sesiones se pueden dibujar con líneas o rectángulos (vacíos o rellenos), las líneas se pueden extender a la siguiente sesión. Puede ocultar/mostrar fácilmente cada sesión presionando las teclas de acceso rápido (de forma predeterminada, '1', '2', '3', '4'). Puede ver líneas ASR (rango de sesión p
Magnifier Ruler Crosshair
Taras Slobodyanik
5 (1)
El indicador tiene tres herramientas principales: lupa (gráfico con zoom), regla (escalas de tiempo y precio) y punto de mira. Puedes moverlo con el mouse y personalizar diferentes formatos de visualización, personalizar el tamaño y el color de cada elemento. La Lupa (gráfico de zoom) le permite mostrar velas de cualquier período de tiempo y en diferentes escalas. Teclas de acceso rápido predeterminadas: 'Q' - período de tiempo más alto, 'A' - período de tiempo más bajo, 'W' - disminuir el ta
Indicador multidivisa y multitemporal del Canal de Desviación Estándar. Muestra la dirección actual del mercado. En el panel se pueden ver rupturas y toques (por precio) de los niveles del canal de regresión lineal. En los parámetros, puede especificar las monedas y plazos que desee. Además, el indicador puede enviar notificaciones cuando se tocan niveles. Al hacer clic en una celda, se abrirá este símbolo y punto. Este es el escáner MTF. La clave para ocultar el panel del gráfico es "D" de f
Lines Profit Loss
Taras Slobodyanik
4.93 (14)
El indicador muestra ganancias (pérdidas) en el símbolo actual. Puede arrastrar y soltar libremente la línea para mostrar la ganancia o pérdida actual. Parámetros Calculation in money or in points — calcula la ganancia/pérdida en puntos o en dinero. Add pending orders to calculate — tenga en cuenta las órdenes pendientes en los cálculos. Magic Number (0 - all orders on symbol) — número mágico, si es necesario evaluar órdenes específicas. Offset for first drawing (points from the average p
FREE
MA Dashboard
Taras Slobodyanik
4 (1)
Modificación multidivisa y multitemporal del indicador Media Móvil (MA). En el tablero puede ver el estado actual del indicador: rupturas y toques (por precio) de Fast MA y Slow MA, así como la intersección de las líneas MA entre sí (cruce de media móvil). En los parámetros puede especificar las monedas y plazos que desee. Además, el indicador puede enviar notificaciones sobre el precio que toca las líneas y sobre su cruce. Al hacer clic en una celda con un punto, se abrirá este símbolo y punto
MA Dashboard MT5
Taras Slobodyanik
5 (4)
Modificación multidivisa y multitemporal del indicador Media Móvil (MA). En el tablero puede ver el estado actual del indicador: rupturas y toques (por precio) de Fast MA y Slow MA, así como la intersección de las líneas MA entre sí (cruce de media móvil). En los parámetros puede especificar las monedas y plazos que desee. Además, el indicador puede enviar notificaciones sobre el precio que toca las líneas y sobre su cruce. Al hacer clic en una celda con un punto, se abrirá este símbolo y punto
ADX Dashboard
Taras Slobodyanik
5 (3)
El indicador ADX se utiliza para determinar la tendencia y su fuerza. La dirección del precio se muestra mediante los valores +DI y -DI, y el valor ADX muestra la fuerza de la tendencia. Si +DI está por encima de -DI, entonces el mercado está en una tendencia alcista, si por el contrario, está en una tendencia bajista. Si ADX está por debajo de 20, entonces no hay una dirección definida. Tan pronto como el indicador supera este nivel, comienza una tendencia de fuerza media. Los valores superior
Inside Bar Dashboard
Taras Slobodyanik
5 (2)
Indicador multidivisa y multitemporal Inside Bar (IB). En los parámetros, puede especificar las monedas y plazos que desee. El panel muestra el último patrón de barra interior (y barra madre) encontrado, la posición actual del precio y la ruptura de los niveles de las barras madre e interior. Puede establecer el tamaño y el color de las barras y el texto de las celdas. El indicador también puede enviar notificaciones cuando se superan los niveles. Al hacer clic en una celda con un punto, se abr
News Dashboard MT4
Taras Slobodyanik
4.43 (7)
Este panel muestra noticias actuales de tres fuentes: del sitio web ForexFactory.com (calendario FFC), del sitio web Investing.com y del calendario económico de mql5.com. Puede ordenar las noticias por impacto y por país y mostrarlas en el gráfico con un solo clic. Al mantener presionada la tecla 'Ctrl', puede seleccionar varias 'monedas' o 'impactos' diferentes para ordenar. Además, esta utilidad muestra no solo el pronóstico, sino también los valores reales después de que aparecen en el sitio
ZigZag Dashboard for MT5
Taras Slobodyanik
5 (3)
Modificación multidivisa y multitemporal del indicador ZigZag. Muestra la dirección actual del mercado, la altura del último movimiento, el número de barras de este movimiento y la ruptura del punto anterior del ZigZag (línea horizontal). Este es el escáner MTF. Puede especifcar las monedas y plazos que desee en los parámetros. Además, el panel puede enviar notificaciones cuando el ZigZag cambia de dirección o cuando se produce un avance en el punto anterior. Al hacer clic en una celda con un
Time Scale
Taras Slobodyanik
4.8 (10)
The indicator draws the time scale on the chart. You can specify the time offset, adjust the size and font to display on the chart (it is displaying your local time on your chart instead of MT time). You can also select the desired format for displaying the date and time. While holding down the middle mouse button, and moving the cursor, a slider will appear on the scale. You may be interested in my other product , which contains a more advanced version of the Time Scale. Parameters Hours (tim
FREE
Modificación multidivisa y multitemporal del Oscilador Estocástico. Puede especificar las monedas y plazos que desee en los parámetros. El panel muestra los valores actuales y las intersecciones de las líneas - Señal y Principal (cruce estocástico). Además, el indicador puede enviar notificaciones cuando se cruzan niveles de sobrecompra y sobreventa. Al hacer clic en una celda con un punto, se abrirá este símbolo y punto. Este es el escáner MTF. De manera similar al medidor de fortaleza de la m
Modificación multidivisa y multitemporal del indicador Índice de Fuerza Relativa (RSI). Puede especificar las monedas y plazos que desee en los parámetros. Además, el panel puede enviar notificaciones cuando se cruzan niveles de sobrecompra y sobreventa. Al hacer clic en una celda con un punto, se abrirá este símbolo y punto. Este es el escáner MTF. La clave para ocultar el panel del gráfico es "D" de forma predeterminada. De manera similar al medidor de fortaleza de la moneda, el Panel pue
Fractals Dashboard MT4
Taras Slobodyanik
5 (3)
Modificación multidivisa y multitemporal del indicador Fractales. Muestra los dos últimos fractales: su secuencia (y cuál está roto) o la distancia entre ellos. Puede especificar las monedas y plazos que desee en los parámetros. Además, el panel puede enviar notificaciones sobre la ruptura de un fractal. Al hacer clic en una celda con un punto, se abrirá este símbolo y punto. Este es el escáner MTF. La clave para ocultar el panel del gráfico es "D" de forma predeterminada. Parámetros Cal
Fractals Dashboard MT5
Taras Slobodyanik
5 (3)
Modificación multidivisa y multitemporal del indicador Fractales. Muestra los dos últimos fractales: su secuencia (y cuál está roto) o la distancia entre ellos. Puede especificar las monedas y plazos que desee en los parámetros. Además, el panel puede enviar notificaciones sobre la ruptura de un fractal. Al hacer clic en una celda con un punto, se abrirá este símbolo y punto. Este es el escáner MTF. La clave para ocultar el panel del gráfico es "D" de forma predeterminada. Parámetros Cal
Pro Sessions MT5
Taras Slobodyanik
5 (1)
Este es un indicador de sesiones de negociación que puede mostrar todos los niveles (Apertura-Alto-Bajo-Cierre) durante cuatro sesiones. El indicador también puede predecir los niveles de sesión. Las sesiones se pueden dibujar con líneas o rectángulos (vacíos o rellenos), las líneas se pueden extender a la siguiente sesión. Puede ocultar/mostrar fácilmente cada sesión presionando las teclas de acceso rápido (de forma predeterminada, '1', '2', '3', '4'). Puede ver líneas   ASR (rango de sesión
Symbol Manager for MT5
Taras Slobodyanik
5 (1)
Symbol Manager or Grid Manager, designed to group orders into one position (by symbol and by direction). This utility will be useful to multi-currency traders, who can have multiple orders on several pairs. You will be able to see the total number of lots, the total profit, and set virtual stop loss and virtual take profit. To set a real TP (or SL), you must first set the virtual value, and then enter the command in this cell: "set". If you want to set real TP/SL for all orders at once, then en
El indicador dibuja automáticamente los niveles de Fibonacci basándose en el indicador ZigZag, sesiones de negociación, fractales o velas (incluidos períodos de tiempo no estándar: año, 6 meses, 4 meses, 3 meses, 2 meses) (retroceso automático de Fibo). Puede elegir cualquier período de tiempo superior para el cálculo de Fibonachi. Los niveles se vuelven a dibujar cada vez que se cierra la barra actual. Es posible habilitar alertas al cruzar los niveles especificados. También puedes analizar
Filtro:
Nicolas Dobrovsky
789
Nicolas Dobrovsky 2024.08.11 09:46 
 

Truly one of the best indicators you can find for finding liquidity. Great support.

John Mlay
181
John Mlay 2024.03.26 21:26 
 

Good support

GoodMorningg
529
GoodMorningg 2023.08.26 21:22 
 

Лучшие продукты на маркете! Лучшая поддержка от разработчика!

jps40
59
jps40 2022.09.21 02:55 
 

This is a superb indicator - strongly recommend getting it!

Suvashish Halder
30798
Suvashish Halder 2021.09.21 05:48 
 

Very nice indicator. You can find out key levels, Chart by Zigzag and Market moving and Easy to use. Good Job & Thank you.

Miguel Felipe
70
Miguel Felipe 2021.07.02 13:08 
 

Easy 5 Star indicator, i would call it a tool, because its very helpfull. It serves better then its purpose. Easy settings, and a great tool. I will be also get a mt5 version. Congrats!

florica
21
florica 2020.11.24 17:57 
 

money thrown away .... it's not what it looks like in the demo ... I want my money back

Taras Slobodyanik
68553
Respuesta del desarrollador Taras Slobodyanik 2021.05.03 14:56
Please take the trouble to describe it more specifically. What exactly is wrong? Otherwise, it looks like unfair competition.
Naser
1243
Naser 2020.10.05 12:23 
 

❌❌❌❌❌

Taras Slobodyanik
68553
Respuesta del desarrollador Taras Slobodyanik 2021.05.03 14:56
Please take the trouble to describe it more specifically. What exactly is wrong? Otherwise, it looks like unfair competition.
varon
491
varon 2020.04.28 12:33 
 

спасибо! замечательный индикатор. рекомендую всем!

3316589p
870
3316589p 2019.04.09 10:44 
 

Great indicator, thank you

Babak Shahabi
1547
Babak Shahabi 2018.08.22 14:25 
 

Nice indicator!

rainwalker123
3371
rainwalker123 2018.03.18 10:49 
 

Very Good Product

PJ CHAWLA
2164
PJ CHAWLA 2017.08.17 17:57 
 

Deserves 5 Stars. Good job.

Ferdinandus Charlie
1175
Ferdinandus Charlie 2017.06.04 16:24 
 

El usuario no ha dejado ningún comentario para su valoración

Respuesta al comentario
Versión 6.0 2024.08.10
1) Fixed a bug in the "Horizontal Lines will become Broken after X bars" function.
Versión 5.9 2024.07.31
1) Fixed the error of finding the end of the line for the "High-Low of the period" mode.
Versión 5.8 2024.07.10
1) Fixed a bug where the line ended incorrectly in some cases.
Versión 5.7 2024.05.20
1) Fixed double number bug.
Versión 5.6 2024.05.20
1) Fixed a bug with alerts for Fractals.
Versión 5.5 2024.03.26
1) Added the parameter 'Horizontal Lines will become Broken after X bars (0-off)'.
Versión 5.4 2024.03.12
1) Added the "Check the breakout of the Lines by price" parameter. Now you can specify the price and bar at which the line breakout will be checked: High-Low (current bar), High-Low (previous bar), Close (previous bar), Open (current bar).
Versión 5.3 2023.09.03
1) Added "Enable buy alerts" and "Enable sell alerts" parameters.
Versión 5.2 2023.08.27
1) Fixed the bug of checking the last bar in the "High-Low of the period" mode.
Versión 5.1 2023.08.27
1) Now the "Show current ZZ-Point" parameter affects the "High-Low of the period" mode. If "Show current ZZ-Point" is disabled, then the indicator will not show the levels of the current candle.
Versión 5.0 2022.11.29
1) Added separate sounds for each alert.
Versión 4.9 2022.11.17
1) The current direction of the candle has been added to the text of the alert about touching ZZ-Ray.
Versión 4.8 2022.11.15
1) Added parameter "Alert when price touches ZZ-Ray".
Versión 4.7 2022.09.04
1) Added parameters for displaying rays on the last ZigZag points ("Show ZZ-Rays").
2) Added hotkey to toggle "Show ZZ-Rays".
3) Line extension bug fixed.
Versión 4.6 2022.08.18
1) Added parameters for displaying the distance between ZigZag points — "Show ZZ-Distance at the start of the line" and "Key to show Distance".
Versión 4.5 2021.11.05
1) Added parameters for displaying the number of times the price touches the ZigZag point. (Show amount of touches, Offset for touches)
Versión 4.4 2021.07.12
1) Added "Hotkeys" parameters. Now you can switch the display of indicator elements by pressing hot keys.
Versión 4.3 2021.05.03
1) For the parameter "Candles" added "Show Day of week", "Show Date" and the ability to specify a color for each day of the week.
Versión 4.2 2021.04.05
1) Added display of the number of points between High and Low (Show range High-Low).
Versión 4.1 2021.03.17
1) Update for the new MT4 build.
Versión 4.0 2020.06.10
1) Recompilation for the new build.
Versión 3.9 2020.04.14
1) Fixed a new bug with displaying dots.
Versión 3.8 2020.04.14
1) Added parameter "Show Horizontal Lines".
Versión 3.7 2019.10.30
1) Code optimization.
Versión 3.6 2019.10.30
1) Fixed copy bug for iCustom function.
Versión 3.5 2019.10.23
1) Added a new mode "High-Low of the period".
2) Code optimization.
Versión 3.4 2019.04.07
1) Added new mode "ZigZag Close".
2) Added alert when the price is near the line.
Versión 3.3 2018.10.28
1) Fixed a bug in the calculation of the time of the end of the line.
Versión 3.2 2018.10.14
Fixed buffer name "ZZ Broken" to "ZZ Unbroken".
Versión 3.1 2018.10.14
1) Added buffer for current Zigzag targets (ZZ Target UP, ZZ Target DN).
Versión 3.0 2018.10.14
1) Added the ability to read points using iCustom. Points are saved sequentially in the indicator buffer.
Versión 2.31 2018.08.28
1) Added the name of the pair, to the prefix of the global variables.
Versión 2.30 2018.08.25
1) Added displaying the current point - "Current ZZ-point (Redrawing point)".
2) Added options for saving points in the Global Variables. Now you can read the coordinates of points using EA.
3) Code optimization.
4) Fixed bug of double fractal.
Versión 2.20 2018.06.01
1) The indicator can now draw levels using Fractals. The "Draw Support & Resistance on the Fractals" parameter.
2) Added the option ti disable dots at the beginning of lines using "Dot at the start of line". Also, there is an option to set the size of these dots using "Font size dot".
3) Now you can run several instances of the indicator in one window.
4) Code optimization.
Versión 2.10 2017.08.16
1) Added option "Add alert when changing the direction of ZigZag"
2) Fixed minor bugs.
Versión 2.0 2017.06.06
1) Added Candles of other periods (up to the Quarter).
2) Small fixes.