• Información general
  • Comentarios (2)
  • Discusión (8)
  • Novedades

Technical Dashboard

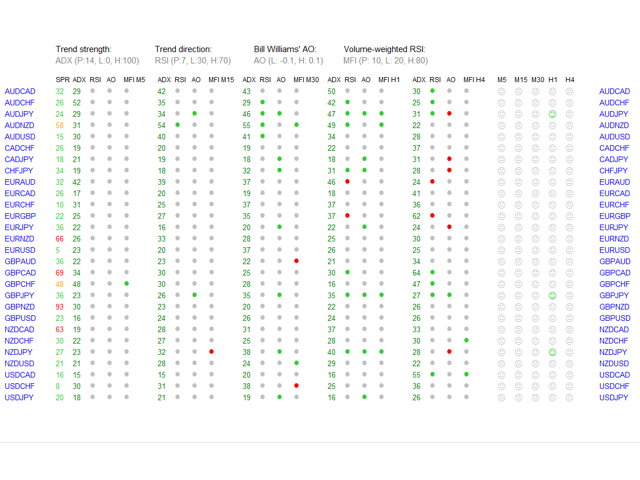
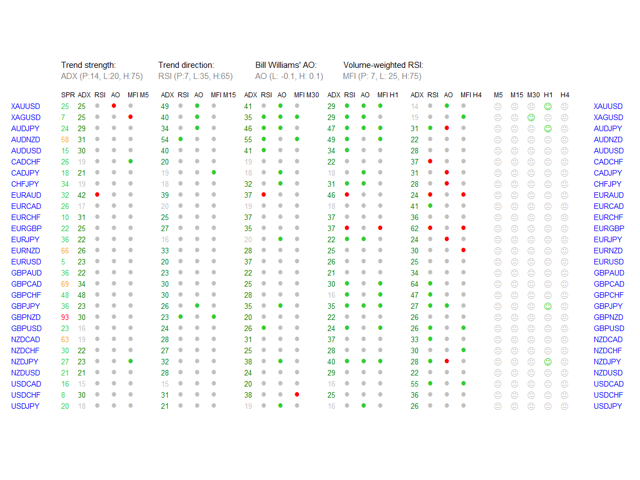
Technical Dashboard is a great tool for quickest possible analysis of multiple currency pairs in terms of coherent conditions of 4 different indicators at the same time.

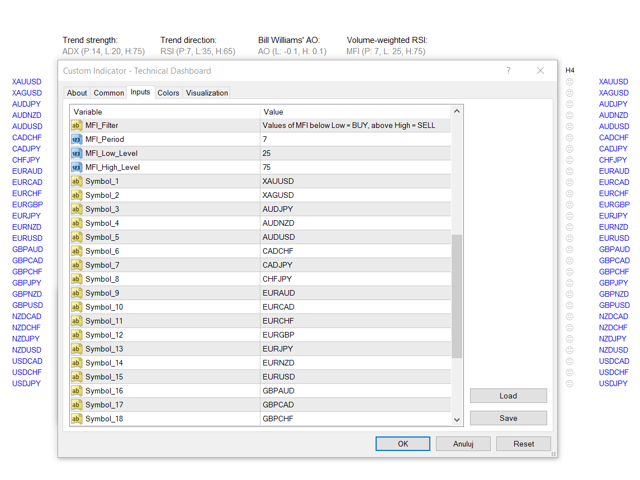
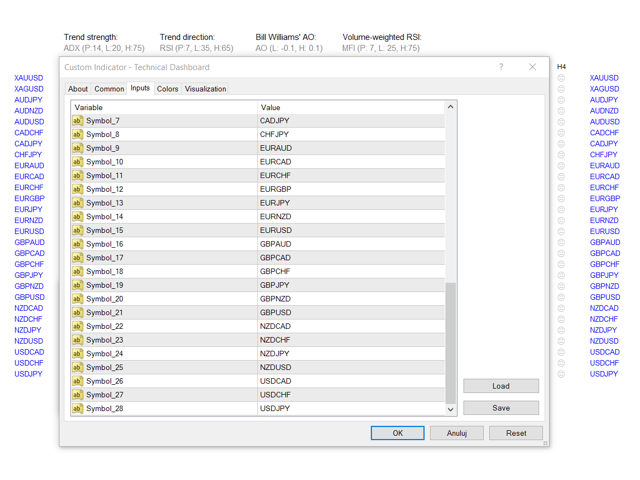
The number of displayed symbols is 30 and the name of each symbol can be edited in the parameters, so we are able to analyze not only predetermined currency pairs, but also other ones, commodities, equities, indices, currency pairs with prefixes and suffixes etc.

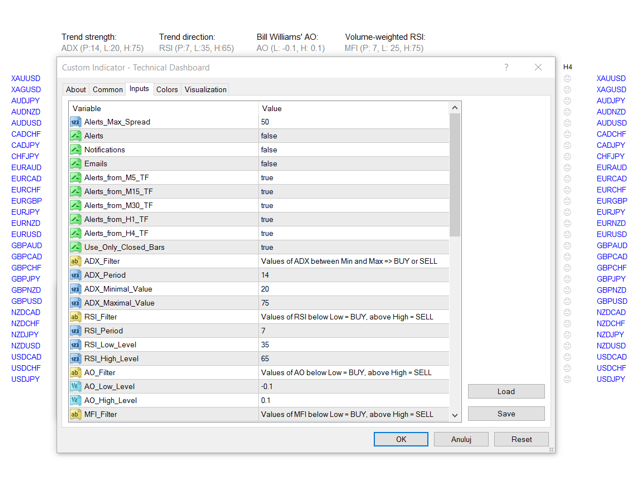
This analyzer is perfect for alert notifications through the MetaTrader terminal, push notifications to mobile device and also email alerts, e.g. from a VPS. We can disable/enable each one (alerts, notifications, e-mails).

Technical Dashboard is based on 4 technical indicators:

  1. Average Directional Movement Index which indicates strength of the trend.
  2. Relative Strength Index which indicates direction of the trend.
  3. Bill Williams' Awesome Oscillator which shows the market momentum.
  4. Money Flow Index (called also: volume-weighted Relative Strength Index) which indicates buying and selling pressure based on price and volume.

For each indicator we can set Low and High Level (for ADX it's Maximal and Minimal Value). For ADX, RSI and MFI we can set also Period. Conditions to trigger alerts can be met only if value of ADX is between ADX Minimal Value and ADX Maximal Value, value of RSI is lower than RSI Low Level (for BUY) or higher than RSI High Level (for SELL), value of AO is below AO Low Level (for BUY) or above AO High Level (for SELL), and value of MFI is lower than MFI Low Level (for BUY) or higher than MFI High Level (for SELL).

We get alert/notification/email only if all 4 conditions are met for a given currency pair in a given period of time and are coherent, so:

  1. ADX must be between Minimal and Maximal Value.
  2. RSI, AO and MFI must be above High Level for signal to SELL or below Low Level for signal to BUY.

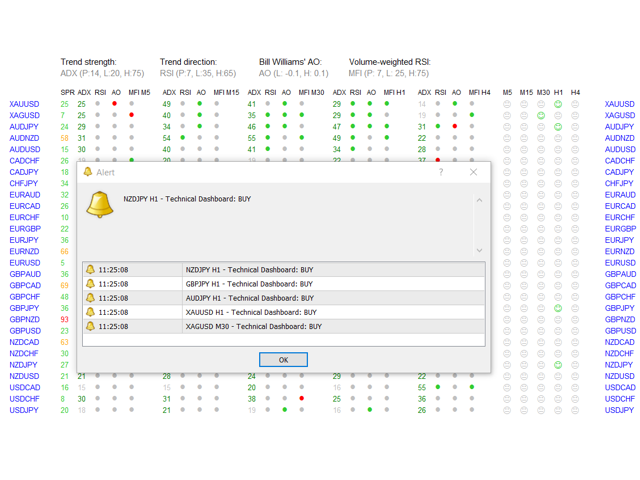
Green and red dots on dashboard indicate if condition is met for specified indicator, currency pair and timeframe. Green dots show Oversold (BUY), red - Overbought (SELL). If ADX is between Minimal and Maximal Value (value in green color - otherwise is gray) and 3 dots (for 3 indicators) are green or red for specified currency pair and timeframe - we will see green or red smiley on the right side of the dashboard. This means that all indicators are coherent.

Another parameter is "Use_Only_Closed_Bars" - if is set to "True" alerts come only from closed candles. If is set to "False" - alerts come immediately from current values of current candles.

Dashboard gives us possibility to choose 5 timeframes from which we will get alerts: M5, M15, M30, H1, H4.

In header of the dashboard are displayed all parameters of 4 indicators.

We can set maximum spread at which the notifications will come ("Alerts_Max_Spread").

Visible spread values on the dashboard have different colors:

  • a) when value is lower or equal to "Alerts_Max_Spread" - Green,
  • b) between 1 and 1.5 times higher than this parameter - Orange,
  • c) above 1.5 times higher than this parameter - Red.

I suggest to make a new template only with "Technical Dashboard" and scheme without colors ("None"), only Background and Foreground set to "White".

Remember, no one except yourself is responsible for any investment decision made by you.

You are responsible for your own investment research and investment decisions.

Good luck!

Productos recomendados
Overview Custom Logic for Trading is a sophisticated automated trading script designed to execute trades based on custom indicator signals, with robust position management features such as trailing stops, break-even settings, and filters. This script allows traders to implement their strategies with high precision and flexibility, enhancing their trading efficiency and profitability. Input Parameters Indicator Settings indicator_name : Name of the custom indicator to be used for generating signa
Awesome Oscillator by Bill Williams with the ability to fine-tune and replace the averaging algorithms of the indicator, which significantly expands the possibilities of using this oscillator in algorithmic trading and brings it closer in its properties to such an indicator as the MACD. To reduce price noise, the final indicator is processed with an additional Smooth averaging. The indicator has the ability to give alerts, send mail messages and push signals when the direction of movement of th
Le presentamos el indicador "Candle closing counter", que se convertirá en su asistente indispensable en el mundo del trading. Es por eso que saber cuándo se cerrará la vela puede ayudar: Si usted tiene gusto de negociar usando patrones de la vela, usted sabrá cuando la vela será cerrada. Este indicador le permitirá comprobar si se ha formado un patrón conocido y si hay una posibilidad de negociación. El indicador le ayudará a prepararse para la apertura del mercado y el cierre del mercado.
VR Cub
Vladimir Pastushak
VR Cub es un indicador para obtener puntos de entrada de alta calidad. El indicador fue desarrollado para facilitar los cálculos matemáticos y simplificar la búsqueda de puntos de entrada a una posición. La estrategia comercial para la cual se diseñó el indicador ha demostrado su eficacia durante muchos años. La simplicidad de la estrategia comercial es su gran ventaja, que permite que incluso los operadores novatos negocien con éxito con ella. VR Cub calcula los puntos de apertura de posiciones
Diamond Trend
Segundo Calvo Munoz
Indicador que identifica la tendencia, así como puntos de entrada. Usar para entradas a favor de tendencia. Aunque este indicador es muy preciso identificando entradas, siempre se recomienda usar otro indicador de soporte para confirmar. Recuerda buscar los Activos y Timeframes que mejor se adapten a tu operativa... Válido tanto para Scalping como para entradas de Largo Plazo Por favor, utiliza un Gráfico de Barras para poder visualizar el indicador correctamente Inputs: EMA Value for Long Term
Strong Retracement Points Pro demo edition! SRP (Strong Retracement/Reversal Points) is a powerful and unique support and resistance indicator. It displays the closest important levels which we expect the price retracement/reversal! If all level are broken from one side, it recalculates and draws new support and resistance levels, so the levels might be valid for several days depending on the market! If you are still hesitating to start using this wonderful tool, you can check this link to see h
Trend Ray
Andriy Sydoruk
The indicator shows the potential trend direction by cyclical-wave dependence. Thus, all the rays of the intersection will be optimal rays, in the direction of which the price is expected to move, taking into account the indicator period. Rays can be used as a direction for potential market movement. But we must not forget that the approach must be comprehensive, the indicator signals require additional information to enter the market.
Super Reversal Pattern
Parfait Mujinga Ndalika
Super Reversal Pattern Indicator Unlock the power of advanced pattern recognition with our Super Reversal Pattern Indicator. Designed for traders seeking precision and reliability, this indicator identifies one of the most effective reversal patterns in technical analysis, offering a significant edge in your trading strategy. Key Features: Non-Repainting Accuracy: Enjoy the confidence of non-repainting technology. Once a Super Reversal Pattern is detected, it remains static, providing consis
Noize Absorption Index MT4
Ekaterina Saltykova
5 (1)
Noize Absorption Index - is the manual trading system that measures the difference of pressure between bears forces and bulls forces. Green line - is a noize free index that showing curent situation. Zero value of index shows totally choppy/flat market.Values above zero level shows how powerfull bullish wave is and values below zero measures bearish forces.Up arrow appears on bearish market when it's ready to reverse, dn arrow appears on weak bullish market, as a result of reverse expectation. S
Chart Patterns Detect 15 patterns (Ascending Triangle, Descending Triangle, Rising Wedge, Falling Wedge, Bullish Flag, Bearish Flag, Bullish Rectangle, Bearish Rectangle Symmetrical triangle, Head and Shoulders, Inverted Head and Shoulders, Triple top, Triple Bottom, Double Top, Double Bottom) Use historical data to calculate the probability of each pattern to succeed (possibility to filter notification according to the chance of success) gives graphic indication about the invalidation level and
nuestro indicador Basic Support and Resistance es la solución que necesita para aumentar su análisis técnico.Este indicador le permite proyectar niveles de soporte y resistencia en el gráfico/ versión mt5 características Integración de los niveles de Fibonacci: Con la opción de mostrar los niveles de Fibonacci junto con los niveles de soporte y resistencia, nuestro indicador le brinda una visión aún más profunda del comportamiento del mercado y las posibles áreas de inversión. Optimización
The Th3Eng PipFinite indicator is based on a very excellent analysis of the right trend direction with perfect custom algorithms. It show the true direction and the best point to start trading. With StopLoss point and Three Take Profit points. Also it show the right pivot of the price and small points to order to replace the dynamic support and resistance channel, Which surrounds the price. And Finally it draws a very helpful Box on the left side on the chart includes (take profits and Stop loss
Trendiness Index
Libertas LLC
5 (3)
"The trend is your friend" is one of the best known sayings in investing, because capturing large trendy price movements can be extremely profitable. However, trading with the trend is often easier said than done, because many indicators are based on price reversals not trends. These aren't very effective at identifying trendy periods, or predicting whether trends will continue. We developed the Trendiness Index to help address this problem by indicating the strength and direction of price trend
Owl smart levels
Sergey Ermolov
4.34 (35)
Versión MT5  |   FAQ El   Indicador Owl Smart Levels   es un sistema comercial completo dentro de un indicador que incluye herramientas de análisis de mercado tan populares como   los fractales avanzados de Bill Williams , Valable ZigZag que construye   la estructura de onda correcta   del mercado y   los niveles de Fibonacci   que marcan los niveles exactos de entrada. en el mercado y lugares para tomar ganancias. Descripción detallada de la estrategia Instrucciones para trabajar con el indi
Description: Please tick "Show object descriptions" in chart properties to enable hrays views That utility converts a trendline into a horizontal ray known as tool for drawing supply and demand zones. Simply create a trendline on a chart and once selected, it will get converted. Ray remains horizontal while dragging.  Quick ray plot: press "R" key to create horizontal ray. It will be snapped to the nearest OHLC value Further versions will be improved. For feature request please post new c
The Penta-O is a 6-point retracement harmonacci pattern which usually precedes big market movements. Penta-O patterns can expand and repaint quite a bit. To make things easier this indicator implements a twist: it waits for a donchian breakout in the right direction before signaling the trade. The end result is an otherwise repainting indicator with a very reliable trading signal. The donchian breakout period is entered as an input. [ Installation Guide | Update Guide | Troubleshooting | FAQ | A
Daily Candle Predictor es un indicador que predice el precio de cierre de una vela. El indicador está destinado principalmente para su uso en gráficos D1. Este indicador es adecuado tanto para el comercio de divisas tradicional como para el comercio de opciones binarias. El indicador se puede utilizar como un sistema de negociación independiente o puede actuar como una adición a su sistema de negociación existente. Este indicador analiza la vela actual, calculando ciertos factores de fuerza dent
Delta Pairs
Anatolii Zainchkovskii
Delta Pairs is an indicator for pair trading, it displays the divergence of two currency pairs. Does not redraw. A useful tool for the analysis of the behavior of two currency pairs relative to each other. Purpose The Delta Pairs indicator is designed for determining the divergences in the movements of two currency pairs. This indicator is displayed as two line charts and the difference (delta) between these charts in the form of a histogram. The Delta Pairs indicator will be useful for those
Retroceso de Fibonacci & Herramientas de Dibujo de Líneas Extendidas Retroceso de Fibonacci & Herramientas de Dibujo de Líneas Extendidas son aptos para la plataforma MT4 y para operadores que emplean el método de negociación de puntos y la negociación de sección áurea. Ventajas: Sin líneas excusadas ni las excesivamente largas, y es fácil de observar y descubrir oportunidades de negociación. Versión de prueba: https://www.mql5.com/zh/market/product/35884 Funciones principales: 1.
This product is a part of  ON Trade Waves Patterns Harmonic Elliot Wolfe you can test free version on EURJPY from this link  Wolf Waves Indicator Descubre Wolf Waves - Tu Herramienta Definitiva de Trading ¿Estás en busca de una herramienta poderosa para identificar fácilmente Wolf Waves en cualquier marco de tiempo? ¡No busques más! Nuestro indicador de Wolf Waves hace este trabajo sin esfuerzo. Aquí te explicamos por qué es perfecto para ti: Características Clave: Detección Automática: Nues
TS krachobor
Magomed Zakaryaev
Всем привет! Выставляю свою торговую стратегию для форекс (далее - ТС). После покупки или аренды ТС пишете мне, я вас добавляют в закрытый чат телеграм, где дам все индикаторы и поддержку по торговле, и мы вместе будем торговать. Статистику по торговле в ТС я добавлю чуть позже, так как открыл новый счет по ТС, что бы было наглядно как проходит торговля. Кроме этого  я дам счет и пароль инвестора, можете сами смотреть в живую торговлю и решить для себя подходит ли она для вас. Два режима, 1) Сре
This is a new strategy for SUPPLY DEMAND areas It is based on a calculation using the tick volume to detect the big price action in market for both bear /bull actions this smart volume action candles are used to determine the supply and demand areas prices in between main supply and demand lines indicate sideway market  up arrows will be shown when prices moves above the main supply and the secondary supply lines Down arrows will be shown when prices moves below the main demand and the secondary
For sure, this indicator has become very popular amongst traders. Through coding this indicator will give you the most accurate levels possible for your trading analysis. We have also added in the ability for you to receive alerts when the price breaks above or below a Support or Resistance lines! HOW TO USE The red rectangles represent your resistance/supply zone. The green rectangles represent your support/demand zone.  BONUS FEATURES We coded this indicator with the ability to switch between
TWO PAIRS SQUARE HEDGE METER INDICATOR Try this brilliant 2 pairs square indicator It draws a square wave of the relation between your two inputs symbols when square wave indicates -1 then it is very great opportunity to SELL pair1 and BUY Pair2 when square wave indicates +1 then it is very great opportunity to BUY pair1 and SELL Pair2 the inputs are : 2 pairs of symbols         then index value : i use 20 for M30 charts ( you can try other values : 40/50 for M15 , : 30 for M30 , : 10 for H1 ,
Blahtech Market Profile
Blahtech Limited
4.56 (16)
Was: $249  Now: $99   Market Profile defines a number of day types that can help the trader to determine market behaviour. A key feature is the Value Area, representing the range of price action where 70% of trading took place. Understanding the Value Area can give traders valuable insight into market direction and establish the higher odds trade. It is an excellent addition to any system you may be using. Blahtech Limited presents their Market Profile indicator for the MetaTrader community. Ins
Utilidad para la gestión automática de pedidos y riesgos. Le permite aprovechar al máximo las ganancias y limitar sus pérdidas. Creado por un comerciante practicante para comerciantes. La utilidad es fácil de usar, funciona con cualquier orden de mercado abierta manualmente por un comerciante o con la ayuda de asesores. Puede filtrar operaciones por número mágico. La utilidad puede trabajar con cualquier número de pedidos al mismo tiempo. Tiene las siguientes funciones: 1. Establecer ni
Cosmic Diviner X Planet
Olena Kondratenko
4 (2)
This unique multi-currency strategy simultaneously determines the strength of trends and market entry points, visualizing this using histograms on the chart. The indicator is optimally adapted for trading on the timeframes М5, М15, М30, Н1. For the convenience of users, the indicator renders the entry point (in the form of an arrow), recommended take profit levels (TP1, TP2 with text labels) and the recommended Stop Loss level. The take profit levels (TP1, TP2) are automatically calculated for
Volume by Price MT4
Brian Collard
4.64 (11)
The Volumebyprice.com Indicator for MetaTrader 4 features Volume Profile and Market Profile TPO (Time Price Opportunity). Volume and TPO histogram bar and line charts. Volume Footprint charts. TPO letter and block marker collapsed and split structure charts. Static, dynamic and flexible range segmentation and compositing methods with relative and absolute visualizations. Session hours filtering and segment concatenation with Market Watch and custom user specifications. Graphical layering, posit
Atomic Analyst
Issam Kassas
5 (2)
En primer lugar, vale la pena enfatizar que este Indicador de Trading no repinta, no redibuja y no se retrasa, lo que lo hace ideal tanto para el trading manual como para el automatizado. Manual del usuario: configuraciones, entradas y estrategia. El Analista Atómico es un Indicador de Acción del Precio PA que utiliza la fuerza y el impulso del precio para encontrar una mejor ventaja en el mercado. Equipado con filtros avanzados que ayudan a eliminar ruidos y señales falsas, y aumentan el poten
El Capturador de Tendencias: La Estrategia del Capturador de Tendencias con Indicador de Alerta es una herramienta versátil de análisis técnico que ayuda a los traders a identificar las tendencias del mercado y los posibles puntos de entrada y salida. Presenta una Estrategia dinámica del Capturador de Tendencias, adaptándose a las condiciones del mercado para una clara representación visual de la dirección de la tendencia. Los traders pueden personalizar los parámetros para que se ajusten a s
FREE
Los compradores de este producto también adquieren
Trade Assistant MT4
Evgeniy Kravchenko
4.43 (180)
Ayuda a calcular el riesgo por operación, la fácil instalación de una nueva orden, gestión de órdenes con funciones de cierre parcial, trailing stop de 7 tipos y otras funciones útiles. Atención, la aplicación no funciona en el probador de estrategias. Manual, Description, Download demo Función de línea -   Muestra en el gráfico la línea de apertura, Stop Loss, Take Profit. Con esta función es fácil establecer una nueva orden y ver sus características adicionales antes de la apertura.   Gest
Local Trade Copier EA MT4
Juvenille Emperor Limited
5 (79)
Experimente una copia de operaciones excepcionalmente rápida con Local Trade Copier EA MT4 . Con su fácil configuración de 1 minuto, este copiador de operaciones le permite copiar operaciones entre múltiples terminales de MetaTrader en la misma computadora con Windows o en Windows VPS con velocidades de copiado ultra rápidas de menos de 0.5 segundos. Ya seas un trader principiante o profesional, el Local Trade Copier EA MT4 ofrece una amplia gama de opciones para personalizarlo según tus necesi
¿Crees que en mercados donde el precio puede cambiar en una fracción de segundo, realizar pedidos debería ser lo más sencillo posible? En Metatrader, cada vez que desee abrir una orden, debe abrir una ventana donde ingrese el precio de apertura, stop loss y take profit, así como el tamaño de la operación. Al operar en los mercados financieros, la gestión del capital es fundamental para mantener su depósito inicial y multiplicarlo. Entonces, cuando quiera realizar un pedido, probablemente se preg
Trade Dashboard MT4
Fatemeh Ameri
5 (34)
Tired of complex order placement and manual calculations? Trade Dashboard is your solution. With its user-friendly interface, placing orders becomes effortless, by a single click, you can open trades, set stop loss and take profit levels, manage trade lot size, and calculate risk to reward ratios, allowing you to only focus on your strategy. Say goodbye to manual calculations and streamline your trading experience with Trade Dashboard. Download  Demo Version  right now. You can find  Details
The product will copy all telegram signal to MT4   ( which you are member  ) , also it can work as remote copier.  Easy to set up, copy order instant, can work with almost signal formats, image signal, s upport to translate other language to English Work with all type of channel or group, even channel have "Restrict Saving Content", work with  multi channel, multi MT5 Work as remote copier: with signal have ticket number, it will copy exactly via ticket number. Support to backtest signal. How to
Forex Market View Dashboard and CSM
Opengates Success International
5 (1)
FFXMV Dashboard + CSM is a custom indicator combined with Currency Strength Meter . It is created to give the Traders a full view of what is going on in the market. It uses a real time data to access the market and display every bit of information needed to make a successful trading. Before attaching this Indicator to your window chart, go to your MT4's Market Watch panel and HIDE all the Currency pairs you don't need or trade and leave the rest there. The reason is that FFMV Dashboard will DISP
El MT4 to Telegram Signal Provider es una herramienta fácil de usar y completamente personalizable que permite enviar señales a Telegram, transformando su cuenta en un proveedor de señales. El formato de los mensajes es completamente personalizable! Sin embargo, para un uso sencillo, también puede optar por una plantilla predefinida y habilitar o deshabilitar partes específicas del mensaje. [ Demo ]  [ Manual ] [ Versión MT5 ] [ Versión Discord ] [ Canal de Telegram ] Configuración Está dispo
Grid Manual MT4
Alfiya Fazylova
4.72 (18)
Grid Manual es un panel de negociación para trabajar con una cuadrícula de órdenes. La utilidad es universal, tiene configuraciones flexibles y una interfaz intuitiva. Funciona con una cuadrícula de pedidos no solo en la dirección de promediar pérdidas, sino también en la dirección de aumentar las ganancias. El usuario no necesita crear y mantener una cuadrícula de pedidos, la utilidad lo hará. Basta con abrir un pedido y el "Grid manual" creará automáticamente una grilla de pedidos para el mism
Copie señales de cualquier canal del que sea miembro (incluidos los privados y restringidos) directamente en su MT4.  Esta herramienta ha sido diseñada pensando en el usuario y ofrece muchas características que necesita para administrar y monitorear las operaciones. Este producto se presenta en una interfaz gráfica fácil de usar y visualmente atractiva. ¡Personalice su configuración y comience a usar el producto en minutos! Guía del usuario + Demo  | Versión MT5 | Versión Discord Si desea pro
Exp COPYLOT CLIENT for MT4
Vladislav Andruschenko
4.7 (61)
Copiadora comercial para MetaTrader 4. Copia operaciones de forex, posiciones, pedidos de cualquier cuenta. Es una de las mejores copiadoras comerciales   MT4 - MT4, MT5 - MT4 para la versión  COPYLOT MT4  (o MT4 - MT5 MT5 - MT5 para la versión COPYLOT MT5 ). Versión MT 5 Descripción completa +DEMO +PDF Cómo comprar Cómo instalar    Cómo obtener archivos de registro    Cómo probar y optimizar    Todos los productos de Expforex Versión copiadora para  MetaTrader 5 terminal (МТ5 - МТ5, МТ4 -
Tome el control de su cartera de divisas. ¡Vea instantáneamente dónde se encuentra, qué funciona y qué le causa dolor! VERSIÓN MT5 DISPONIBLE AQUÍ: https://www.mql5.com/en/market/product/58658 El Trade Manager Dashboard está diseñado para mostrarle de un vistazo dónde se encuentra actualmente cada posición que tiene en el mercado de divisas, y hacer que la gestión de riesgos y la exposición a las divisas sean más fáciles de entender. Para los comerciantes que escalan gradualmente en el mercad
Trade Manager para ayudarle a entrar y salir rápidamente de operaciones mientras calcula automáticamente su riesgo. Incluye funciones que le ayudarán a evitar el exceso de operaciones, las operaciones de venganza y las operaciones emocionales. Las operaciones se pueden gestionar automáticamente y las métricas de rendimiento de la cuenta se pueden visualizar en un gráfico. Estas características hacen que este panel sea ideal para todos los operadores manuales y ayuda a mejorar la plataforma MetaT
Summer 50% discount ($199 -> $99) Advanced trading tool: One click smart orders that execute under your conditions Developed by trader for trading community:  position size calculator (lot size), open position after price action, strategy builder, set and forget trading, mobile notifications... Risk Management -  Risk percentage position size calculator, gain percentage, target risk reward ratio, spread and commissions are included in calculations 7 Advanced order types   - Set and forget tra
Trade copier MT4
Alfiya Fazylova
4.52 (29)
Trade Copier es una utilidad profesional diseñada para copiar y sincronizar operaciones entre cuentas comerciales. La copia ocurre desde la cuenta / terminal del proveedor a la cuenta / terminal del destinatario, instalada en la misma computadora o vps. Antes de comprar, puede probar la versión de demostración en una cuenta de demostración. Versión de demostración aquí . Instrucciones completas aquí . Principales funcionalidades y beneficios: Admite la copia de MT4> MT4, MT4> MT5, MT5> MT4, incl
Risk Manager for MT4
Sergey Batudayev
4.56 (9)
Expert Advisor Risk Manager para MT4 es un programa muy importante y, en mi opinión, necesario para todos los comerciantes. Con este Asesor Experto podrá controlar el riesgo en su cuenta de operaciones. El control de riesgos y beneficios puede realizarse tanto en términos monetarios como porcentuales. Para que el Asesor Experto funcione, simplemente adjúntelo al gráfico de pares de divisas y establezca los valores de riesgo aceptables en la divisa de depósito o en % del saldo actual. Func
50% off. Original price: $375 Reward Multiplier is a semi-automatic trade manager based on pyramid trading that opens additional orders with the running profit of your trades to maximize return exponentially without increasing the risk. Unlike other similar EAs, this tool shows potential profit/loss and reward to risk ratio before even entering the first trade! Download Demo here  (starting lot is fixed at 0.01) Guide + tips here MT5 version   here You only open the first order. When your
TradePanel MT4
Alfiya Fazylova
4.91 (85)
Trade Panel es un asistente comercial multifuncional. La aplicación contiene más de 50 funciones para el comercio manual y le permite automatizar la mayoría de las acciones comerciales. Antes de comprar, puede probar la versión demo en una cuenta de demostración. Demostración aquí . Instrucciones completas aquí . Comercio. Le permite realizar operaciones comerciales básicas con un solo clic: Apertura de órdenes y posiciones. Abrir una cuadrícula de órdenes. Cierre de órdenes y posiciones. Revers
DrawDown Limiter MT4
Haidar, Lionel Haj Ali
5 (8)
Drawdown Limiter EA You are in the right place if you were searching for Drawdown control, Drawdown limiter, Balance protection, Equity Protection or Daily Drawdown Limit related to Prop Firm, FTMO, or Funded account trading, or if you want to protect your trading account. Have you suffered from controlling your drawdown when trading funded accounts? This EA is meant for you. Prop firms usually set a rule called “Trader Daily Drawdown”, and if it is not respected, you are disqualified.  I am an
TPSpro Trade PRO
Roman Podpora
5 (4)
EN MODO PRUEBA (en el tester), la funcionalidad del panel NO ESTÁ ACTIVA. Sólo hemos proporcionado una representación visual del panel en sí. Una herramienta que pueda calcular instantáneamente el tamaño de la posición o el riesgo en función de un nivel de stop loss determinado es fundamental tanto para los traders profesionales como para los principiantes. La utilidad comercial TRADE PRO proporciona cálculos rápidos y precisos, lo que le ayuda a tomar decisiones en condiciones de tiempo limit
Bermaui Manual EA
Muhammad Elbermawi
5 (9)
Este es un asesor experto semiautomático que comercia con el sistema de red. La idea es tomar gradualmente diferentes posiciones en el mercado y luego calcular el nivel de equilibrio para ellas. Cuando los precios superan este punto de equilibrio por una distancia predeterminada, todas las órdenes abiertas se cierran. Información importante Aquí está la guía del usuario:   https://www.mql5.com/en/blogs/post/730567 Puede probar este EA con cualquiera de mis otros productos, aquí: https://www.
Summer 40% discount ($149 -> $88) Everything for chart Technical Analysis indicator mt4 in one tool Draw your supply demand zone with rectangle and support resistance with trendline and get alerts to mobile phone or email alert -  Risk reward indicator Video tutorials, manuals, DEMO download   here .  Find contacts on my   profile . 1.   Extended rectangles and trendlines Object will be extended to the right edge of the chart when price will draw new candles on chart. This is rectangle extend
News Trapper EA
Noha Mohamed Fathy Younes Badr
4.85 (13)
Hola a todos. News trapper EA es un experto para el comercio de noticias OFERTA LIMITADA: ¡Precio 49$ solo por 10 copias! Siguiente precio 99 no puedes hacer back test porque las noticias son eventos futuros Experto muy seguro pone Ajustes tasa de interés solamente o noticias de alto impacto para Trading Automatizado en las noticias del calendario económico. Muestra un comercio estable durante los últimos 10 años. EA no utiliza tecnologías peligrosas como martingale, grid. El Experto es muy simp
Trade Assistant Pro 36 in 1
Makarii Gubaydullin
4.95 (19)
Herramienta multifuncional con más de 65 funciones, incluidas: Calculadora de lotaje, Acción del precio, Calculo RR, Gestor de posiciones, Zonas de Oferta y Demanda Versión demo   |   Manual de usuario   |   MT5 La utilidad no funciona en el probador de estrategias: puede descargar la Versión Demo AQUÍ para probar el producto. Pongase en contacto conmigo para cualquier pregunta / ideas para mejorar / en caso de encontrar un problema Simplifica, acelera y automatiza su operativa de trading. Aume
The product will copy all  Discord  signal   to MT4   ( which you are member  ) , also it can work as remote copier.  Easy to set up. Work with almost signal formats, support to translate other language to English Work with multi channel, multi MT4. Work with Image signal. Copy order instant, auto detect symbol. Work as remote copier: with signal have ticket number, it will copy exactly via ticket number. How to setup and guide: Let read all details about setup and download Discord To MetaTrade
The News Filter
Leolouiski Gan
5 (19)
Este producto filtra todos los asesores expertos y los gráficos manuales durante el tiempo de noticias, por lo que no tendrás que preocuparte por los repentinos picos de precios que podrían destruir tus configuraciones de negociación manuales o las operaciones realizadas por otros asesores expertos. Este producto también viene con un sistema completo de gestión de órdenes que puede manejar tus posiciones abiertas y órdenes pendientes antes del lanzamiento de cualquier noticia. Una vez que compre
VirtualTradePad mt4 Extra
Vladislav Andruschenko
4.88 (56)
Panel de comercio para operar en 1 clic.  ¡Trabajando con posiciones y pedidos!  Operar desde el gráfico o desde el teclado. Con nuestro panel de operaciones, puede operar con un clic del gráfico y realizar operaciones comerciales 30 veces más rápido que el control estándar de MetaTrader. Cálculos automáticos de parámetros y funciones que facilitan la vida de un comerciante y lo ayudan a realizar sus actividades comerciales de manera mucho más rápida y conveniente. Consejos gráficos e informaci
MT4 To Telegram Multi Channel   is an easy-to-use and customizable tool. This product is presented in an attractive   graphical interface   that allows sending adjustable signals in two ways ( Manual or Automatic)   from   Meta trader 4   to   Telegram Multi Channel . In this case, your account becomes a signal provider. All  Message formats  -  language  -  emojis  can be set and personalized. The settings of each channel are separate from each other. You can   Enable   or   Disable   certain p
Take a Break
Eric Emmrich
5 (26)
The most advanced news filter and drawdown limiter on MQL market NEW: Take a Break can be backtested against your account history! Check the " What's new " tab for details. Take a Break has evolved from a once simple news filter to a full-fledged account protection tool. It pauses any other EA during potentially unfavorable market conditions and will continue trading when the noise is over. Typical use cases: Stop trading during news/high volatility (+ close my trades before). Stop trading when
CloseIfProfitorLoss with Trailing
Vladislav Andruschenko
4.86 (28)
Cerrar posiciones en MetaTrader 4 al alcanzar la ganancia / pérdida total con la función de seguimiento de ganancias. Puede habilitar las   paradas virtuales (orden separada)   , Cálculo y cierre para   posiciones de COMPRA y VENTA por separado (COMPRA VENTA separada)   , Cerrar y calcular   todos los símbolos o solo el símbolo actual (Todos los símbolos)   , Habilitar trailing con fines de lucro (   Trailing   Profit) Cierre sobre las pérdidas y ganancias totales en la moneda de depósito, punt
Este Asesor Experto supervisa constantemente el capital de su cuenta comercial para evitar costosas reducciones y / o cumplir con las reglas comerciales. Cuando se infringe un determinado conjunto de reglas, el EA alertará, cerrará todas las operaciones y, en algunos casos, eliminará todas las órdenes pendientes. Opcionalmente, también puede cerrar todos los gráficos para eliminar todos los EA que operan en la cuenta. Este EA es particularmente útil para los desafíos de comercio de accesorios,
Otros productos de este autor
MFI Pointer is an indicator based on Money Flow Index indicator that uses both price and volume to measure buying and selling pressure. Money Flow Index is also known as volume-weighted RSI . MFI Pointer simply draws arrows on chart window when value of Money Flow Index (from parameter MFI_Period) is below MFI_Level (green upward pointing arrow) or above 100-MFI_Level (red downward pointing arrow). Indicator works on all timeframes and all currency pairs, commodities, indices, stocks etc. MFI Po
RSI Dashboard is a great tool for quickest possible analysis of multiple currency pairs  at the same time in terms of Oversold or Overbought . All displayed and used by indicator symbols are freely to choose and are specified using a space separated list in parameters you're able to analyze not only predetermined ones, but everything that your broker offers, also commodities, equities, indices, ones with prefixes, suffixes etc. There are 3 types of alerts: alert notifications in the MT4 term
Envelopes Grid
Dominik Mandok
5 (1)
It's a simple but useful tool for creating a grid based on Envelopes. Only 2 parameters can be set: 1) "Period" - the period of all visible Envelopes (i.e. 4) and 1 Moving Average (Envelopes axis), 2) "Deviations Distance" - the distance between Envelopes. Naturally, the colors of all 9 lines can be changed as desired. It works with everything that is available in your Market Watch. Good luck!
FREE
Interceptor - professional volume and price extremes indicator. Interceptor is a powerful indicator, which thanks to a combination of four different types of normalized indicators in one algorithm can correctly identify extremes of the price leading to retracements and reversals in the trend. Algorithm is based mainly on combination of Accumulation/Distribution , On Balance Volume , Money Flow Index and Relative Strength Index . The first parameter of Interceptor is Interceptor_Depth which defin
Volume Volatility Dashboard is a great tool for quickest possible analysis of multiple currency pairs in terms of extremely high and extremely low accumulation to distribution ratio in comparison to values from past. The number of displayed symbols is 30 and the name of each symbol can be edited in the parameters, so we are able to analyze not only predetermined currency pairs, but also other ones, commodities, equities, indices, currency pairs with prefixes and suffixes etc... This analyzer is
It's a simple but useful tool for creating a grid based on Bollinger Bands . Only 2 parameters can be set: 1) "Period" - the period of all visible Bollinger Bands (i.e. 4) and 1 Moving Average (axis of all Bollinger Bands), 2) "Deviations Distance" - the distance between Bollinger Bands. Naturally, the colors of all 9 lines can be changed as desired. It works with everything that is available in your Market Watch. Good luck!
FREE
RSI Pointer
Dominik Mandok
RSI Pointer is an indicator which simply draws arrows on a chart window when the value of RSI (from parameter RSI_Period) is below RSI_Level (green upward pointing arrow) or above 100-RSI_Level (red downward pointing arrow). RSI Pointer works on all timeframes and all currency pairs, commodities, indices, stocks etc. RSI Pointer has only two parameters, RSI_Period and RSI_Level . For example, if you set RSI_Period=7 and RSI_Level=20, the indicator will draw arrows for values below 20 (oversold)
CCI Pointer
Dominik Mandok
CCI Pointer is an indicator which simply draws arrows on chart window when value of CCI (from parameter CCI_Period) is above CCI_Level (red downward pointing arrow) or below negative CCI_Level (green upward pointing arrow). CCI Pointer works on all timeframes and all currency pairs, commodities, indices, stocks etc. CCI Pointer has only two parameters, CCI_Period and CCI_Level . For example, if you set CCI_Period=25 and CCI_Level=200 indicator will draw arrows for values below -200 (oversold) an
ADX Pointer
Dominik Mandok
ADX Pointer is an indicator which is based on "Average Directional Index" and draws three numbers in chart window depending on the value of ADX. In ADX Pointer you can set "ADX_Period" which is of course period of Average Directional Index and you can also set 3 levels. When ADX value exceed first level ("ADX_Level1") in chart window appears number "1", when ADX exceed second level ("ADX_Level2") appears "2" and when ADX exceed third level ("ADX_Level3") appears "3". Simple. ADX Pointer works on
Spread Display is a simple but very helpful indicator allowing live monitoring of spread in chart window. Using this indicator, there's no need to distract attention never again, seeking current spread value somewhere else. From now on, everything is clear and at the height of your eyes, in chart window of selected currency pair. Indicator has many settings. We can choose any font we want and we can set 3 spread levels ( Spread_Level_1 , Spread_Level_2 and Spread_Level_3 ) between which will cha
Volume Volatility
Dominik Mandok
4 (2)
Volume Volatility is an indicator which analyzes currency pairs, indices, commodities etc. in terms of extremely high and extremely low accumulation to distribution ratio in comparison to values from past. The most important parameter is "Volume Volatility Factor" - this parameter, in big simplification, determines how far distance in the past is analyzed. The lower value of the parameter, the indicator analyzes less data from the past. I recommend you to set and test e.g. 3, 5, 15, 35, and 48 w
RSI Breakout Dashboard  is a tool for multiple currency pairs analysis at the same time in terms of  breakout  (return) from  Oversold  or  Overbought  Zone to  Neutral  Zone. All displayed and used by indicator symbols are free to choose  and are specified using a space separated list in parameters, so you're able to analyze not only predetermined ones, but everything that your broker offers, also commodities, equities, indices, ones with prefixes, suffixes etc. You can choose 3 types of al
MFI Breakout Dashboard is a tool for multiple currency pairs analysis at the same time in terms of breakout from Oversold or Overbought Zone . Money Flow Index (MFI) uses both price and volume to measure buying and selling pressure. MFI is also known as volume-weighted RSI (Relative Strength Index). The number of displayed symbols is 30 and the name of each symbol can be edited in the parameters. The analyzer is perfect for alert notifications, push notifications and email alerts. We can also se
MFI Extremes Dashboard is a great tool for quickest possible analysis of multiple currency pairs in terms of Oversold or Overbought at the same time. Money Flow Index (MFI) uses both price and volume to measure buying and selling pressure. MFI is also known as volume-weighted RSI (Relative Strength Index). The number of displayed symbols is 30 and the name of each symbol can be edited in the parameters, so we are able to analyze not only predetermined currency pairs, but also other ones, commodi
Closing Orders At Specified Time is a utility which helps you to close opened orders and delete pending orders at a specified time - especially when you cannot be online and do it by yourself at that time. You can schedule a specific time for closing orders, and additionally you can choose what type of orders should be closed (all, only opened or only pending), what symbols (all or you can enter names of three symbols) and with what Magic Number. You can also select to close only profitable or o
Filtro:
Johan Michel Struijk
248
Johan Michel Struijk 2017.02.21 13:28 
 

El usuario no ha dejado ningún comentario para su valoración

Dmitrii Korolev
214
Dmitrii Korolev 2016.08.25 17:02 
 

El usuario no ha dejado ningún comentario para su valoración

Respuesta al comentario
Versión 1.1 2021.11.30
Compiled with the latest version of MT4 to ensure 100% compatibility.