Triangles pattern
- Indicadores
- Siarhei Baranouski
- Versión: 1.2
- Actualizado: 22 noviembre 2018
- Activaciones: 5
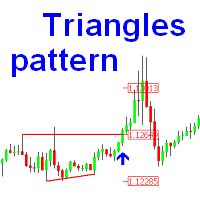
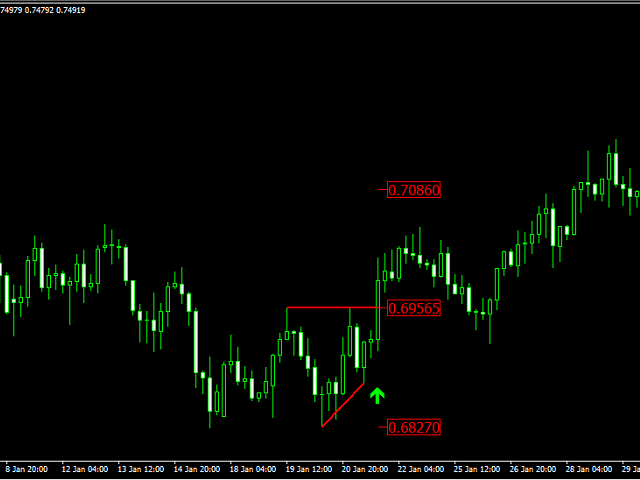
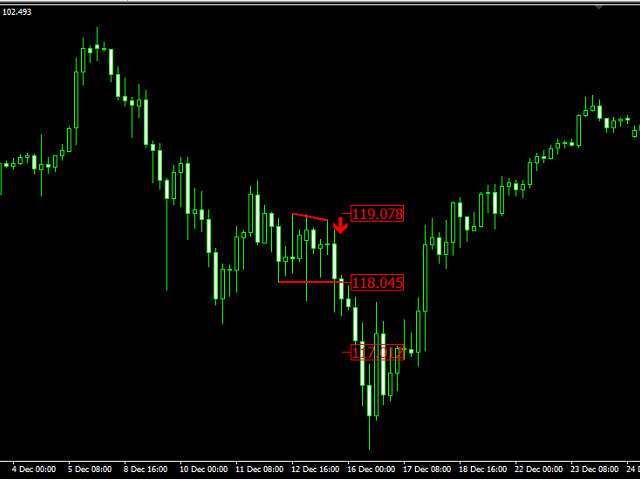
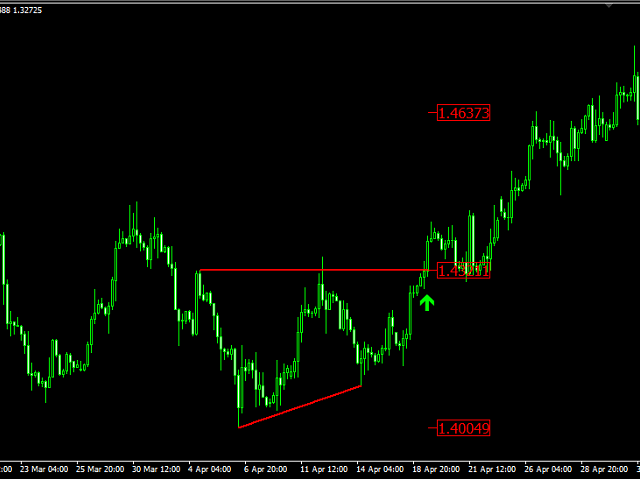
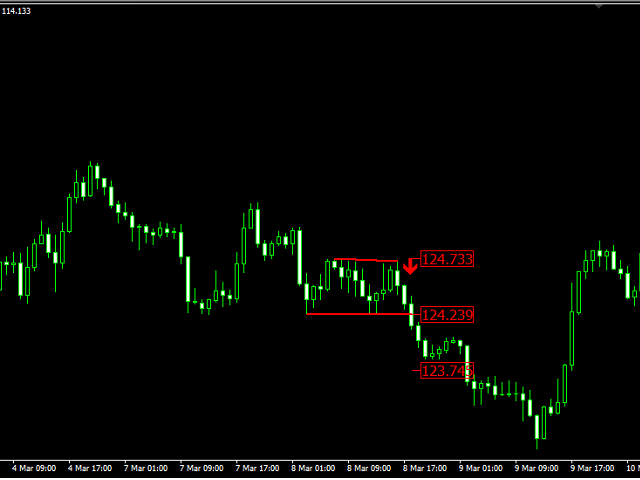
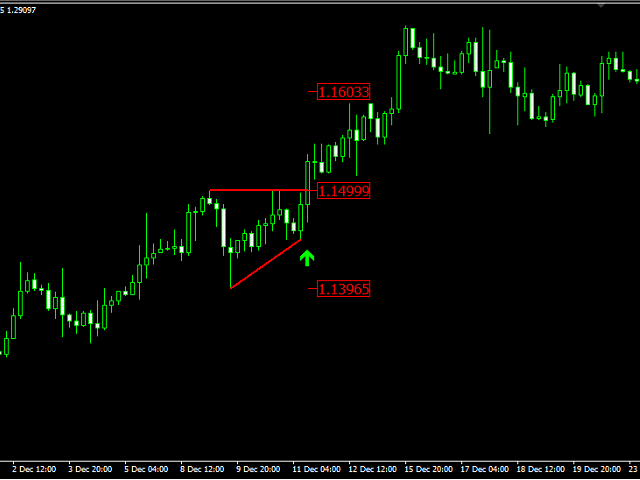
The indicator is designed for finding the "ascending" and "descending" triangle patterns on the chart, followed by the breakout of the triangle base. The indicator also determines the take profit and stop loss levels, in order to know when to exit the position. In my opinion, when using the "Confimed Break" mode, after a signal appears it is best to wait for a small rollback to the base of the triangle and open the position. But when using the "Live Break" or "Live Break with ReEntry" mode, it is better to enter the market as soon as a signal appears.
Live Break - a signal appears without waiting for breakout confirmation.
Live Break with ReEntry - if the signal was received before the confirmation of a triangle breakout and the price came back, i.e. breakout was not confirmed, then the indicator will notify about the next breakout.
Once 50% of the target is reached, the stop loss should be moved to breakeven.
Settings
- Break_Mode=Confimed Break; - triangle breakout mode
- Triangle_Min_3rd_Point=33; - The minimum height of the second top/bottom
- Min_Percent_of_Break=5.0; - Minimum breakout as a percentage of the triangle height
- Max_Percent_of_Break=30; - Maximum breakout percentage
- Max_Percent_of_Break_by_Wick=50; - Maximum percentage of a breakout by candle wick
- Max_Wick_Percent_of_Body=150; - Maximum size of a long wick of the candle relative to the body in percents
- AlertON=true; - On-screen notification about signal appearance
- SoundON=true; - Sound notification about signal appearance
- EmailON=true; - Email notification about signal appearance










El usuario no ha dejado ningún comentario para su valoración