PipsFactoryWeekly
- Indicadores
- Alfred Kamal
- Versión: 4.0
- Actualizado: 2 diciembre 2021
- Activaciones: 5
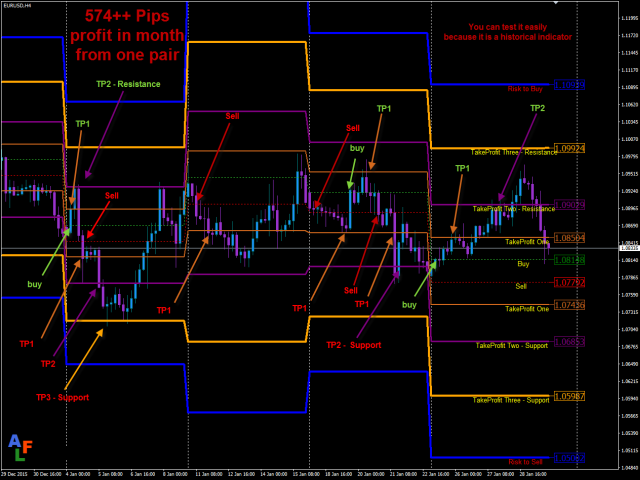
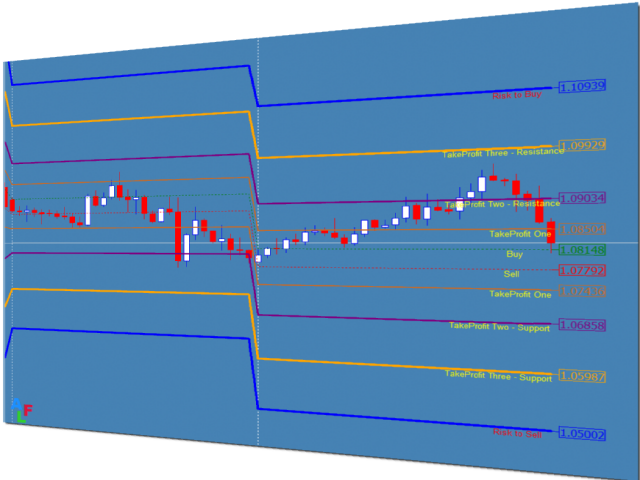
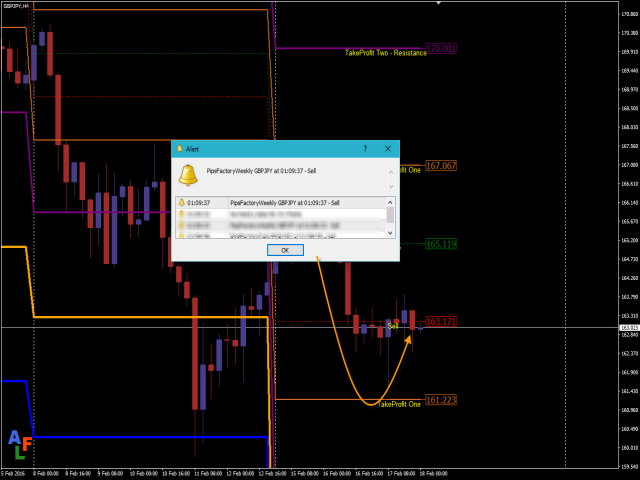
This indicator depends on High and Low price of Currency in last Week and then i made some secret equations to draw 10 lines.
Features:
- You will know what exactly price you should enter the market .
- You will know when to be out of market.
- You will know you what should you do in market:
- Buy
- Sell
- Take profit and there are 3 levels to take your profit
- Support
- Resistance
- Risk to buy
- Risk to Sell
Signal Types and Frame used:
- You can use this indicator just on H4 frame and you have to download the historical data of W1 frame.
- Enter buy order in case the price is at buy line and there are 3 levels to take your profit
- First level is take profit.
- Second level is take profit too but it is also Resistance.
- Third level is take profit too but it is also Resistance.
- The fourth line is Risk to enter market with buy order.
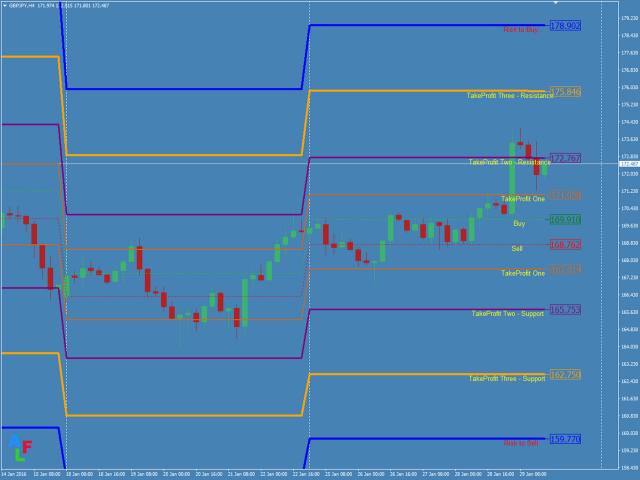
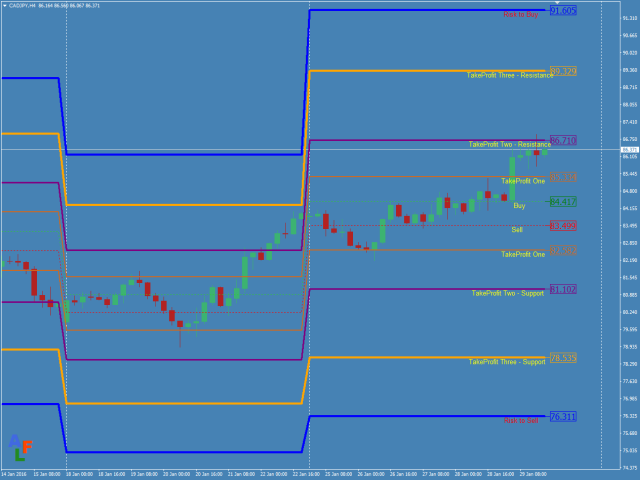
- Enter sell order in case price at sell line and there are 3 levels to take your profit
- First level is take profit.
- Second level is take profit too but it is also Support
- Third level is take profit too but it is also Support.
- The fourth line is Risk to enter market with sell order.
- Currency: It works on any currency pair, but for best results use it on EURUSD
- It is very easy to use.
Indicator parameters:
- Notifications - if it false there are no notifications at all, if it true you have to choose how indicator will send notifications to you.
- Alert - Displays a message in a separate window.
- Send push message - Sends push notifications to the mobile terminals, whose MetaQuotes IDs are specified in the "Notifications" tab.
- Send an email - Sends an email at the address specified in the settings window of the "Email" tab.