• Información general
  • Comentarios
  • Discusión
  • Novedades

DeM Signal AM

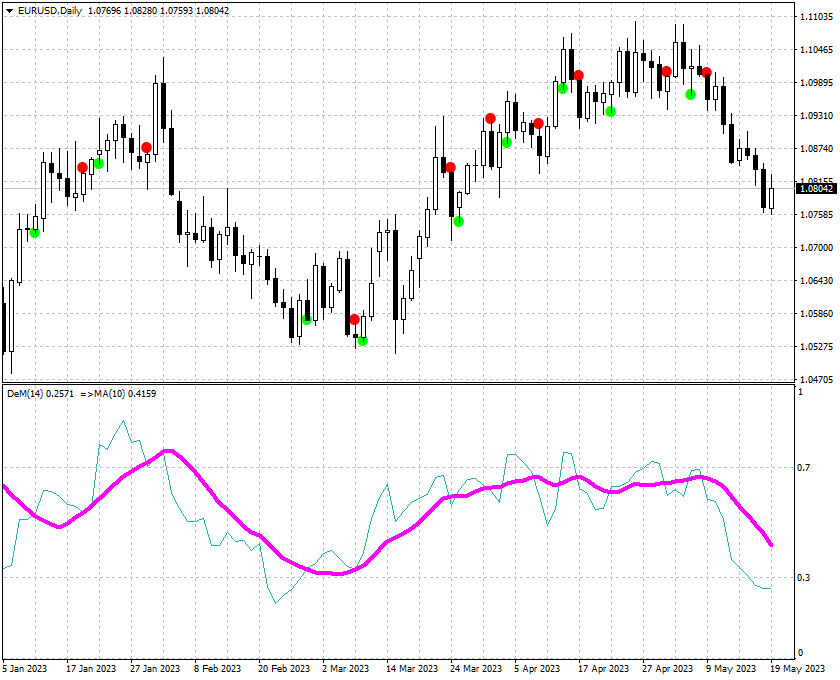
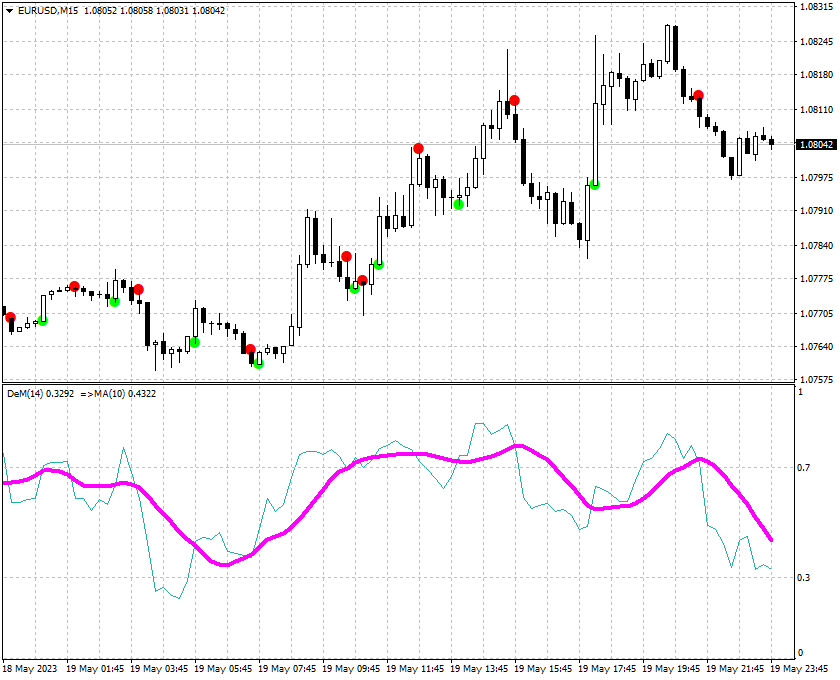
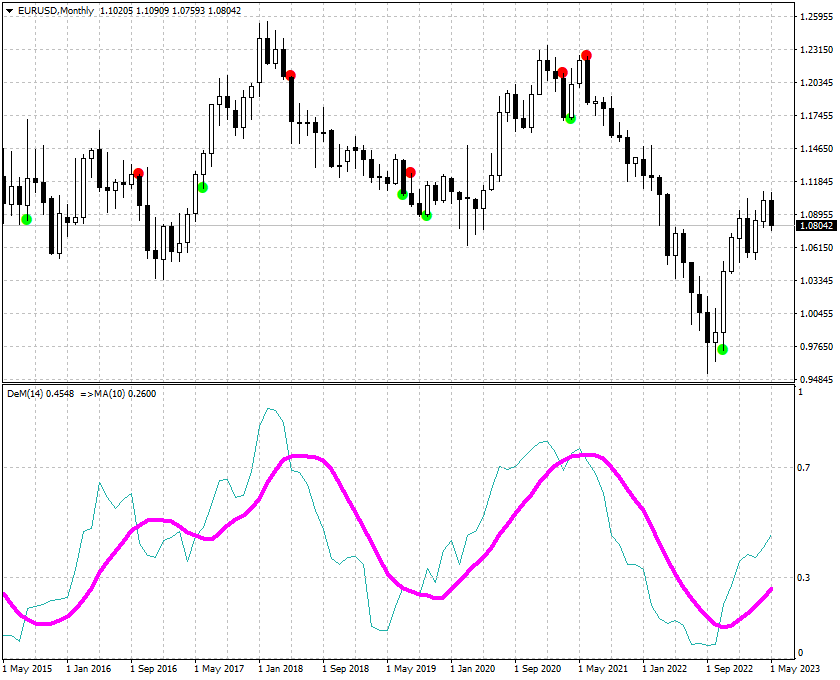
This indicator displays the moment when the DeMarker oscillator crosses its smoothed value.

If the DeMarker oscillator crosses its smoothed value, it is a signal of a trend change.

The signal is given after the end of the formation of the candle.

The signal is confirmed when the price crosses the high/low of the bar on which the signal was given.

The indicator does not redraw.


Custom Parameters:

  • DeM_Period (>1) - DeMarker indicator period;
  • MA_Period - period for smoothing DeMarker indicator values;
  • MA_Method - method for smoothing DeMarker indicator values;

  • Alerts - displays a dialog box containing user data;
  • Send_Mail - sends an email to the address specified in the settings window on the "Mail" tab;
  • Send_Notification - sends a notification to mobile terminals whose MetaQuotes IDs are specified in the settings window on the "Notifications" tab.


Productos recomendados
El estrategia de trading Moving Average Convergence Divergence (MACD) es una herramienta popular de análisis técnico que se utiliza para identificar cambios en el impulso y la dirección de la tendencia. El MACD se calcula restando la media móvil exponencial (EMA) de 26 períodos de la EMA de 12 períodos. Luego se traza una EMA de 9 períodos, llamada "línea de señal", sobre el MACD para actuar como un disparador de señales de compra y venta. El MACD se considera en territorio alcista cuando la lín
FREE
Download the free version   here. Divergence Divergence refers to when the price of a currency pair moves in one direction while the trend indicator is moving in the opposite direction. With divergence, there can be positive and negative signals. Divergences in Forex trading are quite common signals of technical analysis. These are basic early Forex signals indicating the trend reversal and filter false signals. Application of this indicator It is usually not easy to detect divergences by the t
FREE
Extremum by trend
Anton Iudakov
5 (1)
Looking for entry points along the local trend without repaint! Arrows indicate entry points. Based on classic indicators. The indicator is easy to use. Settings Наименование Описание Frequency factor Signal frequency. The less, the more often. This affects the quality. Recommendations Recommended for use on major currency pairs. Timeframe from m5, m15, m30 Subscribe to my telegram channel, where we discuss intraday trading, ideas, indicators, etc., a link in my profile contacts.
FREE
Th3Eng HistoMaster
Ahmed Farag
4.75 (4)
Th3Eng HistoMaster  indicator Free Histogram Indicator to detect the current trend direction. The indicator is based on CCI indicator. Also draw arrows when it detect the trend is strong buy or strong sell, with Alerting system (Popup with sound, Email alerting and mobile notification). Also draws a dashboard shows all Time-Frames' current signal. Requirements works with all pairs, stocks, CFDs and crypto currencies. works with all Spreads works with all Account types works on all Time-Frames
FREE
FREE FOR A LIMITED TIME ONLY!!! The Ultimate Indicator For Trading Trend This indicator clearly shows you the strength of the market in one direction or the other, which means that you can trade knowing you are either with or against the market. When used in conjunction with the +3R principles you are sure to have some serious results. The +3R Principles Routine - This is when you trade and how often  Rules - This is the rule you follow  Risk:Reward - This is the percentage amount of your accoun
FREE
OsMA Arrow MTF
Pavel Shutovskiy
3.92 (12)
The indicator displays crossing zero level by Moving Average of Oscillator (OsMA) in the form of arrows. The this is a multi-timeframe indicator, and it displays signals from other timeframes. The indicator notifies about a signal by means of a pop-up Alert window, or sending notification to e-mail. Parameters Time-frame - select timeframe to show indicator signals. Fast EMA Period - fast EMA. This is an exponential moving average from a price with a short period. Slow EMA Period - slow EMA. T
FREE
TrendPlus
Sivakumar Subbaiya
4.21 (14)
Trend Plus   Trendplus  Indicator   Time Frame: Suitable for any time frame.  Purpose: Trend Prediction. Blue and red candle indicate the buy and sell call respectively. Buy: When the blue candle is formed buy call is initiated. close the buy trades when the next red candle will formed.   Sell: When the Red candle is formed Sell call is initiated. close the Sell trades when the next blue candle will formed.   Happy trade!!
FREE
This indicator is a perfect tool able to compare which brokers have the lower latency. It shows us immediately which brokers are slower or faster. When you see the dot icon on the line, it means this broker is the faster one and the red line (Broker_A) is the slower one. See the example on the screenshot. How It Works? This indicator shares the prices information to and from the "shared" common data folder. It compares all the prices. The price is based on average by (Ask + Bid) / 2. There are
FREE
Wise Men Indicator demo
Bohdan Kasyanenko
3.67 (3)
The indicator displays signals according to the strategy of Bill Williams on the chart. Demo version of the indicator has the same features as the paid, except that it can work only on a demo account . Signal "First Wise Man" is formed when there is a divergent bar with angulation.  Bullish divergent bar - with lower minimum and closing price in the upper half. Bearish divergent bar - higher maximum and the closing price at the bottom half. Angulation is formed when all three lines of Alligat
FREE
MTF Stochastic and RSI
Georgiy Gazaryan
5 (2)
A simple but effective helper that will allow you to track both global and local market trends. The indicator combines the work of two oscillators: Stochastic and RSI. Both indicators can be set to any timeframe. Advantages of Use Multitimeframe - you can adjust both indicators to the desired timeframes. To obtain the entry points, you can use the Elder's triple screen system. Highly customizable - you can configure not only the parameters of the indicators, but also their appearance (color an
FREE
MACD Signal 2 AM
Andriy Matviyevs'kyy
This indicator displays on the price chart signals about the standard MACD crossing the zero value, as well as about crossing the signal line. The indicator does not redraw. Signals are shown on fully formed candles. The indicator can send notifications of its signals to the terminal and email. Custom Parameters: Fast_EMA_Period - fast moving average period;  Slow_EMA_Period - slow moving average period;  Signal_Period - signal line period;  MACD_Price - the price at which the indicator is built
FREE
Discover the power of precision and efficiency in your trading with the " Super Auto Fibonacci " MT4 indicator. This cutting-edge tool is meticulously designed to enhance your technical analysis, providing you with invaluable insights to make informed trading decisions. Key Features: Automated Fibonacci Analysis: Say goodbye to the hassle of manual Fibonacci retracement and extension drawing. "Super Auto Fibonacci" instantly identifies and plots Fibonacci levels on your MT4 chart, saving you tim
FREE
Power Trend Free
Yurij Kozhevnikov
5 (2)
Power Trend Free - the indicator shows the trend strength in the selected period. Input Parameters The indicator has three input parameters: Period - a positive number greater than one, it shows the number of candlesticks used for calculations. If you enter one or zero, there will be no error, but the indicator will not be drawn. Applied Price - the standard "Apply to:" set meaning data used for the indicator calculation: Close - Close prices; Open - Open prices; High - High prices; Low - Low
FREE
SFT Trend Chart
Artem Kuzmin
4 (1)
Opening positions in the direction of the trend is one of the most common trading tactics. This indicator determines the direction of the local movement and colors the candles on the chart in the appropriate color. Allows you to enter the transaction at the very beginning of the movement Thanks to the flexible settings you can use on any currency pairs, metals and cryptocurrency Can be used when working with binary options Distinctive features Does not redraw. Additional parameters for
FREE
QualifiedEngulfing
Ashkan Hazegh Nikrou
QualifiedEngulfing - es la versión gratuita del indicador ProEngulfing ProEngulfing - es la versión de pago del indicador Advance Engulf, descárguela aquí. ¿Cuál es la diferencia entre la versión gratuita y la de pago de ProEngulfing ? La versión gratuita tiene la limitación de un solo señal por día. Presentamos QualifiedEngulfing - Su indicador profesional de patrones Engulf para MT4 Desbloquee el poder de la precisión con QualifiedEngulfing, un indicador de vanguardia diseñado para identifica
FREE
ST Cross
Curtis Daniel Jr -
Introduction The ST Cross indicator is based on the traditional Moving Average (MA) Cross which uses a fast and slow moving average. Entry signals to buy and sell are given when both moving averages cross. However with the basic strategy there are a lot of false signals. In order to filter the trades we use the 200 (MA) to identify the overall direction of the trend. Input Settings           Master Trend Period     -      200 Period moving average used to get the trend direction.           Fast
FREE
MegaTrends
Sivakumar Subbaiya
1 (1)
Megatrends  Indicator   Time Frame: Suitable for any time frame.  Purpose: Trend Prediction. Blue and red color indicate the buy and sell call respectively. Buy: When the blue line is originating it is opened buy call. Sell: When the Red line is origination it is opened sell call Happy trade!! this indicator is suitable for all time frame, but our recommended time frame to use 1hour and 4 hours, suitable for any chart.
FREE
With this system you can spot high-probability trades in direction of strong trends. You can profit from stop hunt moves initiated by the smart money! Important Information How you can maximize the potential of the scanner, please read here: www.mql5.com/en/blogs/post/718109 Please read also the blog about the usage of the indicator: Professional Trading With Strong Momentum This FREE Version of the indicator works only on EURUSD and GBPUSD. The full version of the indicator can be found here:
FREE
CCI in MA
Nikolaos Pantzos
4.4 (5)
iCC in iMA is indicator to change color in iMA if iCCI crosses level up (up trend) or crosses level down (down trend). It is a useful tool to track when the upside and the downside iCCI on iMA. You can to get source code from here . Parameters MA_Periods —Period for iMA. MA_Method — Method for iMA. CCI_Periods —Period for iCCI. CCI_ApliedPrice — Price used for iCCI. CCI_LevelsUp — Level iCCI for up trend. CCI_LevelsDN — Level iCCI for down trend. BarsCount — How many bars will show the line.
FREE
PZ Oscillator
PZ TRADING SLU
3 (10)
Pz Oscillator es un sensible indicador que ofrece mucha información útil y detecta automáticamente las divergencias . Se puede utilizar esta herramienta como confirmación de la ejecución de la operación y para identificar la dirección y la fuerza de la tendencia. El indicador ha sido desarrollado como complemento a una serie de nuestras herramientas de trading. Dirección de la tendencia El oscilador dibuja dos medias móviles mostrando la dirección de la tendencia. Si la media móvil rápida está
FREE
Are you tired of drawing trendlines every time you're analyzing charts? Or perhaps you would like more consistency in your technical analysis. Then this is for you. This indicator will draw trend lines automatically when dropped on a chart. How it works Works similar to standard deviation channel found on mt4 and mt5. It has 2 parameters: 1. Starting Bar 2. Number of bars for calculation The   starting bar   is the bar which drawing of the trend lines will begin, while the   number of bars for c
FREE
StrikePin
Mike Pascal Plavonil
1 (1)
The StrikePin indicator is a technical, analytical tool designed to identify trend reversals and find optimal market entries.  The StrikePin indicator is based on the pin bar pattern, which is the Price Action reversal pattern. An entry signal, in a trending market, can offer a very high-probability entry and a good risk to reward scenario. Be careful: the indicator is repainting since it is looking for highest high and lowest lows.  You should avoid to use it in experts but you can use it
FREE
Stat Monitor 4
Sergei Linskii
5 (1)
Stat Monitor is a good information indicator. Benefits of the indicator: The indicator provides useful information - the current spread, the cost of one lot of the symbol, trading leverage and the recommended lot size for trading. You can use the indicator on the MetaTrader 4 trading platform of any broker. The indicator provides useful information. Version of the Stat Monitor indicator for MetaTrader 5 I wish you all good luck in trading and stable profit!
FREE
MA Search 3
Mariusz Piotr Rodacki
This indicator allows you to overlay three different moving averages on the chart simultaneously. Each of these moving averages has additional settings such as: -Time frame -Shift -MA method -Applied price Using this indicator, you can easily set up three moving averages and find the one that suits you the best. You can also use this indicator to determine the trend when the moving averages cross.
FREE
Tipu Heikin Ashi Panel
Kaleem Haider
4.56 (25)
Tipu Heikin-Ashi Panel is the modified version of the original Heiken Ashi indicator published by MetaQuotes here . A professional version of this indicator is available here . Features An easy to use Panel that shows the Heiken Ashi trend of selected timeframe. Customizable Buy/Sell alerts, push alerts, email alerts, or visual on-screen alerts. Customizable Panel. The panel can be moved to any place on the chart or minimized to allow more space. Heikin means "the average", and Ashi means "foo
FREE
Peak Trough Analysis is the great tool to detect peaks and troughs in your chart. Peak Trough Analysis tool can use three different peaks and troughs detection algorithm. The three algorithm include the orignal Fractals Indicator by Bill Williams, the Modified Fractals indicator and ZigZag indicator. You can use this peak and trough analysis tool to detect the price pattern made up from Equilibrium Fractal-Wave process. For further usage, there are good guide line on how to use this peak trough
FREE
The indicator helps to identify possible rollbacks and reversals. Shows the direction of the price movement and is painted in the appropriate color. Allows you to conduct trend and counter trend trading It works on all timeframes, on any currency pairs, metals and cryptocurrency Can be used when working with binary options Distinctive features Does not redraw; Simple and clear settings; It works on all timeframes and on all symbols; Suitable for trading currencies, metals, options and cryptocurr
FREE
Triple RSI
Pablo Leonardo Spata
2.5 (2)
MIRA LA SIGUIENTE ESTRATEGIA CON ESTE INDICADOR. Triple RSI es una herramienta que utiliza el clásico RSI, pero en varios períodos de tiempo para encontrar reversiones del mercado.    1.  ️ Idea detrás del indicador y su estrategia: En el trading, ya sea Forex o cualquier otro activo, lo ideal es mantenerlo simple, cuanto más simple, mejor . La estrategia triple RSI es una de las estrategias simples que buscan retornos de mercado. En nuestra experiencia, donde siempre hay más dinero p
FREE
PZ Penta O MT4
PZ TRADING SLU
2.25 (4)
The Penta-O is a 6-point retracement harmonacci pattern which usually precedes big market movements. Penta-O patterns can expand and repaint quite a bit. To make things easier this indicator implements a twist: it waits for a donchian breakout in the right direction before signaling the trade. The end result is an otherwise repainting indicator with a very reliable trading signal. The donchian breakout period is entered as an input. [ Installation Guide | Update Guide | Troubleshooting | FAQ | A
FREE
Color Macd Tf
Syarif Nur Arief
MACD is well known indicator that still can be use for prediction where price will go next few minutes, hours or even weekly  With colored bar of Macd, your eyes can easily catch when color is changed based what market price movement to find any early trend on market. here is the parameter of the indicator: TF_MACD , default is 1 Hour , this mean you can see clearly MACD of 1 Hour TimeFrame on Lower TimeFrame. InpPrice , default is Price Close , this is original MACD parameter from Metaquotes st
FREE
Los compradores de este producto también adquieren
Gann Made Easy
Oleg Rodin
4.96 (45)
Gann Made Easy es un sistema de comercio de Forex profesional y fácil de usar que se basa en los mejores principios de comercio utilizando la teoría del Sr. W. D. Gann. El indicador proporciona señales precisas de COMPRA y VENTA, incluidos los niveles de Stop Loss y Take Profit. Puede comerciar incluso sobre la marcha utilizando notificaciones PUSH. ¡Por favor, póngase en contacto conmigo después de la compra! ¡Compartiré mis consejos comerciales con usted y excelentes indicadores de bonificació
Atomic Analyst
Issam Kassas
5 (1)
En primer lugar, vale la pena enfatizar que este Indicador de Trading no repinta, no redibuja y no se retrasa, lo que lo hace ideal tanto para el trading manual como para el automatizado. El Analista Atómico es un Indicador de Acción del Precio PA que utiliza la fuerza y el impulso del precio para encontrar una mejor ventaja en el mercado. Equipado con filtros avanzados que ayudan a eliminar ruidos y señales falsas, y aumentan el potencial de trading. Utilizando múltiples capas de indicadores
Gold Stuff
Vasiliy Strukov
4.89 (250)
Gold Stuff: un indicador de tendencia diseñado específicamente para el oro, también se puede usar en cualquier instrumento financiero. El indicador no se vuelve a dibujar ni se retrasa. El marco de tiempo recomendado es H1. Este indicador está escrito por EA Gold Stuff Advisor, puede encontrarlo en mi perfil. IMPORTANTE! Póngase en contacto conmigo inmediatamente después de la compra para obtener instrucciones y bonificación! PARÁMETROS Draw Arrow - incl.desactivado. dibujar flechas en el grá
ACTUALMENTE 26% DE DESCUENTO ¡La mejor solución para cualquier operador novato o experto! Este indicador es una herramienta única, de alta calidad y asequible porque hemos incorporado una serie de características propias y una nueva fórmula. ¡Con sólo UN gráfico puede leer la Fuerza de la Divisa para 28 pares de Divisas! Imagínese cómo mejorará su operativa porque podrá señalar el punto exacto de activación de una nueva tendencia o de una oportunidad de scalping. Manual del usuario: haga
Scalper Vault
Oleg Rodin
5 (27)
Scalper Vault es un sistema profesional de reventa que le brinda todo lo que necesita para una reventa exitosa. Este indicador es un sistema comercial completo que puede ser utilizado por operadores de divisas y opciones binarias. El marco de tiempo recomendado es M5. El sistema le proporciona señales de flecha precisas en la dirección de la tendencia. También le proporciona señales superiores e inferiores y niveles de mercado de Gann. Los indicadores proporcionan todo tipo de alertas, incluidas
Trend Screener
STE S.S.COMPANY
4.83 (86)
Indicador de tendencia, solución única e innovadora para el comercio y filtrado de tendencias con todas las funciones de tendencias importantes integradas en una sola herramienta. Es un indicador 100% sin repintar de marcos temporales y monedas múltiples que se puede usar en todos los símbolos/instrumentos: divisas, materias primas, criptomonedas, índices y acciones. Trend Screener es un indicador de seguimiento de tendencia eficiente que proporciona señales de tendencia de flecha con puntos en
TPSproTREND PrO
Roman Podpora
5 (15)
TPSpro TRENDPRO  - is a trend indicator that automatically analyzes the market and provides information about the trend and each of its changes, as well as giving signals for entering trades without redrawing! The indicator uses each candle, analyzing them separately. referring to different impulses - up or down impulse. Exact entry points into transactions for currencies, crypto, metals, stocks, indices!  -  Version MT5               DETAILED DESCRIPTION        /       TRADING SETUPS           
Introduciendo       Indicador Quantum Trend Sniper   , el innovador indicador MQL5 que está transformando la forma en que identificas y negocias los cambios de tendencia. Desarrollado por un equipo de comerciantes experimentados con experiencia comercial de más de 13 años,       Indicador de francotirador de tendencia cuántica       está diseñado para impulsar su viaje comercial a nuevas alturas con su forma innovadora de identificar cambios de tendencia con una precisión extremadamente alta.
Ante todo, vale la pena enfatizar que esta Herramienta de Trading es un Indicador No Repintado, No Redibujado y No Retrasado, lo que la hace ideal para el trading profesional. El Indicador de Conceptos de Acción del Precio Inteligente es una herramienta muy potente tanto para traders nuevos como experimentados. Combina más de 20 indicadores útiles en uno solo, combinando ideas avanzadas de trading como el Análisis del Trader del Círculo Interior y Estrategias de Trading de Conceptos de Dinero
Conviértase en un Breaker Trader y obtenga beneficios de los cambios en la estructura del mercado a medida que se invierte el precio. El indicador de ruptura de bloque de órdenes identifica cuándo una tendencia o movimiento de precio se acerca al agotamiento y está listo para revertirse. Le alerta sobre cambios en la estructura del mercado que generalmente ocurren cuando una reversión o un retroceso importante están a punto de suceder. El indicador utiliza un cálculo patentado que identific
Scalper Inside PRO
Alexey Minkov
4.75 (55)
SALE NOW! Limited Time Offer! An exclusive indicator that utilizes an innovative algorithm to swiftly and accurately determine the market trend. The indicator automatically calculates opening, closing, and profit levels, providing detailed trading statistics. With these features, you can choose the most appropriate trading instrument for the current market conditions. Additionally, you can easily integrate your own arrow indicators into Scalper Inside Pro to quickly evaluate their statistics and
Advanced Supply Demand
Bernhard Schweigert
4.92 (310)
¡Actualmente con 33% de descuento! ¡La mejor solución para cualquier tráder principiante o experto! Este indicador es una herramienta comercial única, de alta calidad y asequible, porque incorpora una serie de características patentadas y una nueva fórmula. Con esta actualización, podrá mostrar zonas de doble marco temporal. No solo podrá mostrar un marco temporal más alto, sino también mostrar ambos, el marco temporal del gráfico MÁS el marco temporal más alto: MOSTRANDO ZONAS ANIDADAS. A todos
TPSpro RFI Levels
Roman Podpora
5 (13)
A key element in trading is zones or levels from which decisions to buy or sell a trading instrument are made. Despite attempts by major players to conceal their presence in the market, they inevitably leave traces. Our task was to learn how to identify these traces and interpret them correctly. Reversal First Impulse levels (RFI)   -  Version MT5                INSTRUCTIONS                 RUS                 ENG                                       R ecommended to use with an indicator   -  
¡Descubra el secreto para el comercio de Forex exitoso con nuestro indicador MT4 personalizado! ¿Alguna vez se ha preguntado cómo lograr el éxito en el mercado de Forex, obteniendo ganancias constantemente al tiempo que minimiza el riesgo? ¡Aquí está la respuesta que ha estado buscando! Permítanos presentar nuestro indicador MT4 patentado que revolucionará su enfoque para el comercio. Versatilidad única Nuestro indicador está especialmente diseñado para usuarios que prefieren las formacio
TrendMaestro
Stefano Frisetti
5 (2)
note: this indicator is for METATRADER4, if you want the version for METATRADER5 this is the link: TRENDMAESTRO recognizes a new TREND in the bud, he never makes mistakes. The certainty of identifying a new TREND is priceless. DESCRIPTION TRENDMAESTRO identifies a new TREND in the bud, this indicator examines the volatility, volumes and momentum to identify the moment in which there is an explosion of one or more of these data and therefore the moment in which prices have strong probability of f
¡Actualmente 20% OFF ! ¡La mejor solución para cualquier novato o trader experto! Este software funciona con 28 pares de divisas. Se basa en 2 de nuestros principales indicadores (Advanced Currency Strength 28 y Advanced Currency Impulse). Proporciona una gran visión general de todo el mercado de divisas. Muestra los valores de Advanced Currency Strength, la velocidad de movimiento de las divisas y las señales para 28 pares de divisas en todos los (9) marcos temporales. Imagine cómo mejorar
Presentamos el Indicador Milagroso de Forex: Desata el Poder del Trading Preciso ¿Estás cansado de buscar el mejor indicador de Forex que realmente ofrezca resultados excepcionales en todos los marcos temporales? ¡No busques más! Ha llegado el Indicador Milagroso de Forex para revolucionar tu experiencia de trading y llevar tus ganancias a nuevas alturas. Construido sobre una base de tecnología de vanguardia y años de desarrollo meticuloso, el Indicador Milagroso de Forex se erige como el pinácu
ALERTA DE COMPRA Y VENTA MULTIDIVISA y MULTITIMEFRAME. ¡STOP DE TRAILING AUTOMÁTICO Y TOMA DE BENEFICIOS DE RECOMPENSA DE RIESGO! ¡EL INDICADOR ESCANEA Y ANALIZA EL MERCADO PARA QUE NO TENGAS NADA QUE HACER! ¡COMERCIA TODAS TUS MONEDAS EN 1 GRÁFICO!   Después de la compra, deje un comentario, contácteme y le enviaré el asistente comercial EA. El indicador utiliza varios osciladores y filtros adjuntos para encontrar los mejores puntos de entrada CONFIRMADOS, ¡así que no necesita preocupars
Entry Points Pro
Yury Orlov
4.7 (224)
Este es un genial indicador para MT4 que ofrece señales precisas para entrar en una transacción sin redibujar. Se puede aplicar a cualquier activo financiero: fórex, criptomonedas, metales, acciones, índices. Nos dará valoraciones bastante precisas y nos dirá cuándo es mejor abrir y cerra una transacción. Eche un vistazo  al vídeo  (6:22), ¡contiene un ejemplo de procesamiento de una sola señal que ha amortizado el indicador! La mayoría de los tráders mejoran sus resultados comerciales durante l
Trend Forecasting
Mohamed Hassan
5 (15)
This indicator is unstoppable when combined with our other indicator called Katana. After purchase, send us a message and you could get Katana for FREE as a BONUS After purchase, send us a private message for your instructions.  MT5 version: click here 40 copies available at $55. There are 3 copies left before the next price of $105. Don't miss this great deal!  The Trend Forecasting indicator is a very unique & easy tool that is able to make prediction about future price movement
Quantum Breakout Indicator PRO
Bogdan Ion Puscasu
4.96 (26)
Introduciendo       Quantum Breakout PRO   , el innovador indicador MQL5 que está transformando la forma en que comercia con Breakout Zones. Desarrollado por un equipo de operadores experimentados con experiencia comercial de más de 13 años,   Quantum Breakout PRO   está diseñado para impulsar su viaje comercial a nuevas alturas con su innovadora y dinámica estrategia de zona de ruptura. El indicador de ruptura cuántica le dará flechas de señal en las zonas de ruptura con 5 zonas objetivo de
El sistema PRO Renko es un sistema de trading de alta precisión especialmente diseñado para operar gráficos RENKO. Se trata de un sistema universal que se puede aplicar a diversos instrumentos de negociación. El sistema neutraliza eficazmente el llamado ruido de mercado, lo que le brinda acceso a señales de reversión precisas. El indicador es muy fácil de usar y solo tiene un parámetro responsable de la generación de señales. Puede adaptar fácilmente la herramienta a cualquier instrumento com
FX Power MT4 NG
Daniel Stein
5 (8)
Obtenga su actualización diaria del mercado con detalles y capturas de pantalla a través de nuestro Morning Briefing aquí en mql5 y en Telegram ! FX Power MT4 NG es la nueva generación de nuestro popular medidor de fuerza de divisas, FX Power. ¿Y qué ofrece este medidor de fuerza de nueva generación? Todo lo que le encantaba del FX Power original PLUS Análisis de fuerza de ORO/XAU Resultados de cálculo aún más precisos Períodos de análisis configurables individualmente Límite de cálculo persona
Break and Retest
Mohamed Hassan
5 (2)
Break & Retest is unstoppable when combined with our other divergence indicator. After purchase, send us a message and you could get this  2nd indicator  for  FREE  as a  BONUS! ‍You can visually backtest Break & Retest to see how it behaved in the past!    Manual guide:   Click here $59  for the first 25 copies ( 7  left)! Next price is $120 .  After many months of hard work and dedication, we are extremely proud to present you our  Break and Retest price action indicator crea
ACTUALMENTE 31% DE DESCUENTO Este indicador es una herramienta de transacción única, de alta calidad y asequible porque hemos incorporado una serie de características propias y una fórmula secreta. Con solo un gráfico, da Alertas para los 28 pares de divisas. ¡Imagina cómo mejorarás porque puedes identificar el punto de activación exacto de una nueva tendencia u oportunidad de crecimiento! Basado en nuevos algoritmos subyacentes , hace que sea aún más fácil identificar y confirmar operaciones po
TrendDecoder Premium
Christophe, Pa Trouillas
5 (3)
Identifique los rangos y los próximos movimientos probables   |  Obtenga las señales más tempranas y la fuerza de las Tendencias   |  Obtener salidas claras antes de reversión   |  Detecte los niveles de Fibo que el precio pondrá a prueba Indicador no repintado y no retardado - ideal para la trading manual y automatizada - adecuado para todos los activos y todas las unidades temporales Oferta por tiempo limitado >>   50% OFF Después de la compra, póngase en contacto con mi canal  para conocer lo
El indicador de reversión de ADR le muestra de un vistazo dónde se cotiza actualmente el precio en relación con su rango diario promedio normal. Recibirá alertas instantáneas a través de una ventana emergente, correo electrónico o push cuando el precio exceda su rango promedio y los niveles por encima de su elección para que pueda saltar rápidamente a retrocesos y reversiones. El indicador dibuja líneas horizontales en el gráfico en los extremos del rango promedio diario y también extensiones p
Currency Strength Wizard es un indicador muy poderoso que le proporciona una solución todo en uno para operar con éxito. El indicador calcula el poder de este o aquel par de divisas utilizando los datos de todas las monedas en múltiples marcos de tiempo. Estos datos se representan en forma de índice de moneda fácil de usar y líneas eléctricas de moneda que puede usar para ver el poder de esta o aquella moneda. Todo lo que necesita es adjuntar el indicador al gráfico que desea operar y el indicad
Shepherd Harmonic Pattern
Abdullah Alrai
4.68 (59)
Este indicador detectará patrones armónicos que se dibujen en el gráfico mediante métodos manuales y automáticos. Puede consultar el manual del usuario en el siguiente enlace: Agregue su opinión y contáctenos para obtenerlo Existe una versión gratuita para probar este producto en mt4. Puede utilizarlo para detectar patrones de Gartley y Nenstar: https://www.mql5.com/en/market/product/30181 Puede comprar la versión completa de MT4 en: https://www.mql5.com/en/market/product/15212 Notas El indicad
FX Volume
Daniel Stein
4.6 (35)
Obtenga su actualización diaria del mercado con detalles y capturas de pantalla a través de nuestro Morning Briefing aquí en mql5 y en Telegram ! FX Volume es el PRIMER y ÚNICO indicador de volumen que proporciona una visión REAL del sentimiento del mercado desde el punto de vista de un bróker. Proporciona una visión impresionante de cómo los participantes institucionales del mercado, como los brokers, están posicionados en el mercado Forex, mucho más rápido que los informes COT. Ver esta info
Otros productos de este autor
ADX Signal AM
Andriy Matviyevs'kyy
4.75 (4)
The indicator is an interpretation of the Average Directional Movement Index (ADX) allowing you to determine if there is a price trend. It was developed by Welles Wilder and described in his book "New concepts in technical trading systems". The indicator shows signals on the price chart when +DI и -DI intersect and when an ADX value rises or falls relative to the +DI и -DI positional relationship. The indicator's buy signals work just like a support level, while the sell signals work like a resi
FREE
ADX Line AM
Andriy Matviyevs'kyy
4.67 (3)
The indicator analyzes ADX and ATR data to define the current trend and allow traders to gain maximum profit from strong price movements. The indicator is intuitively clear: line direction change - trend direction change. Change of the line color warns of a coming direction change. Extended version of this indicator - Line on Osc . Customized parameters: Ind_Period (>1) - ADX calculation period; Sensitivity (>1) - ATR sensitivity. Alerts - show a dialog box containing user data; Send_Mail - send
FREE
RSX Signal AM
Andriy Matviyevs'kyy
The indicator displays the signals of the RSX oscillator. The main type of signal is given when the oscillator exceeds the 0 value. If the "Sensitivity" parameter increases above zero, the main signal will also be given when overbought/oversold levels are overcome, defined as zero plus sensitivity and zero minus sensitivity. An additional signal is given when the direction of the oscillator line changes. It is optimal to use the indicator signals as signals to open a trade when the price overcom
FREE
ADX Candles AM
Andriy Matviyevs'kyy
This indicator colors candles in accordance with the projected price movement. The analysis is based on the values of the classic ADX. If the DMI+ line is above the DMI- line - the candlestick is painted in color that signals a price growth; If the DMI+ line is below the DMI- line - the candlestick is painted in color that signals a price fall. The indicator does not redraw on completed candlesticks. The forming candlestick can change its color depending on the current data. Thus, it is recommen
FREE
Impulsive Trade AM
Andriy Matviyevs'kyy
This indicator displays elements of the trading system described by Alexander Elder. This indicator uses the idea of opening sell deals in the period of MACD (or OsMA) falling below zero and opening buy deals when the indicator values rise above zero, in case this fall or rise coincide with the Moving Average direction. The thick and thin histograms correspond to the values of MACD and OsMA. If a histogram is above 0, the indicator value is greater than 0. If it is below, the indicator value is
FREE
Step RSI AM
Andriy Matviyevs'kyy
5 (1)
This indicator is an interpretation of the values of the classic indicator - RSI. A filter is used to smooth the sharp fluctuations of the indicator values, eliminating the weak changes and focusing the trader's attention on strong fluctuations of values. The indicator is not redrawn on completed bars. For greater efficiency of this indicator, it should be used in conjunction with the indicators that identify the trend direction, as well as support/resistance levels. Signals: Histogram crossing
FREE
WPR Signal AM
Andriy Matviyevs'kyy
This indicator displays the signals based on the values of the classic WPR indicator. The WPR indicator can be used for determining the overbought or oversold areas on the chart. Reaching these levels means that the market can soon turn around, but it does not give signal, as in a strong trend the market can stay in the overbought or oversold state for quite a long time. As with most oscillators, the signals are generated when leaving these areas. This indicator allows to display three types of
FREE
SuperTrend AM
Andriy Matviyevs'kyy
5 (1)
SuperTrend AM is an indicator that allows you to open a position at the very beginning of a significant price movement. The second most important quality of the indicator is the ability to follow the trend as long as possible in order to obtain all potential profits while minimizing potential losses. This indicator does not repaint or not recalculate. A version of this indicator with advanced settings and signal notifications is  SuperTrend 3 AM . Signal of the indicator: red arrow appearing a
FREE
MFI Signal AM
Andriy Matviyevs'kyy
5 (2)
This indicator displays the signals based on the values of the classic Money Flow Index (MFI) indicator on the price chart. The volume is considered during the calculation of the MFI values. The MFI can be used for determining the overbought or oversold areas on the chart. Reaching these levels means that the market can soon turn around, but it does not give signal, as in a strong trend the market can stay in the overbought or oversold state for quite a long time. As with most oscillators, the s
FREE
ADX Trigger AM
Andriy Matviyevs'kyy
5 (1)
The indicator is an interpretation of the Average Directional Movement Index (ADX) allowing you to determine if there is a price trend. It was developed by Welles Wilder and described in his book "New concepts in technical trading systems". The indicator determines entry points and uses crossing of ADX +/- lines and growth or fall of the main ADX line. When the indicator crosses the zero line, the trend is changed. If the oscillator's value is 1 - the price grows, the trend remains; If the oscil
FREE
RSI Signal AM
Andriy Matviyevs'kyy
This indicator displays the signals based on the values of the classic RSI indicator on the price chart. The RSI can be used for determining the overbought or oversold areas on the chart. Reaching these levels means that the market can soon turn around, but it does not give signal, as in a strong trend the market can stay in the overbought or oversold state for quite a long time. As with most oscillators, the signals are generated when leaving these areas. This indicator allows to display three
FREE
Stop Bar AM
Andriy Matviyevs'kyy
The indicator accurately identifies a short-term trend both on trend and flat markets. The confirmation of the signal is the overcoming by the price of the high/low of the bar on which the signal was given. Signals are given on fully formed bars and are not redrawn. Calculations are based on the system of Moving Averages. The indicator is highly sensitive. Use it together with other technical analysis indicators. Settings: Sensitivity - amount of bars for the indicator calculation (1 or higher
FREE
TTF Candles AM
Andriy Matviyevs'kyy
5 (1)
This indicator displays the moment when the TTF oscillator crosses the zero value, and the moment when the TTF oscillator crosses its smoothed value. Crossing the zero value by the TTF oscillator is a buy/sell signal. If the TTF oscillator crosses its smoothed value, it is a signal of a trend change. The signal is given after the end of the formation of the candle. The signal is confirmed when the price crosses the high/low of the bar on which the signal was given. The indicator does not redraw.
FREE
CCI Signal AM
Andriy Matviyevs'kyy
This indicator displays the signals based on the values of the classic CCI indicator on the price chart. The CCI can be used for determining the overbought or oversold areas on the chart. Reaching these levels means that the market can soon turn around, but it does not give signal, as in a strong trend the market can stay in the overbought or oversold state for quite a long time. As with most oscillators, the signals are generated when leaving these areas. This indicator allows to display three
FREE
Laguerre Osc 2 AM
Andriy Matviyevs'kyy
The presented indicator uses the Laguerre filter to build an oscillator. The indicator has the possibility of double additional smoothing, which can be useful for small values ​​of the Gamma parameter. The indicator gives three types of signals: Exit of the oscillator from the overbought / oversold zone; The oscillator crossing the middle of the value between the overbought/oversold zones; The oscillator enters the overbought/oversold zone. On fully formed candles, the indicator does not redraw.
FREE
BarLineBreak AM
Andriy Matviyevs'kyy
4 (1)
The indicator detects the current trend using the following definition: A trend is a market situation when each subsequent peak is higher/lower than the previous one, as well as each subsequent bottom is higher/lower than the previous one. Exceeding all previous peaks/bottoms on the specified amount of bars by the current peak/bottom is considered to be a beginning of a new trend. The indicator paints bars according to an identified trend. The indicator does not repaint. Settings: Lines_Bre
FREE
ADX Candles 2 AM
Andriy Matviyevs'kyy
This indicator colors candles in accordance with the projected price movement. The analysis is based on the values of the classic ADX. If the DMI+ line is above the DMI- line and the main ADX line grows - the candlestick is painted in color that signals a price growth; If the DMI+ line is below the DMI- line and the main ADX line grows - the candlestick is painted in color that signals a price fall. The indicator does not redraw on completed candlesticks. The forming candlestick can change its c
FREE
TTF Line AM
Andriy Matviyevs'kyy
The indicator analyzes TTF and ATR data to define the current trend and allow traders to gain maximum profit from strong price movements. The indicator is intuitively clear: line direction change - trend direction change. Change of the line color warns of a coming direction change. Customized parameters: Ind_Period (>1) - TTF calculation period; Sensitivity (>1) - ATR sensitivity. Alerts - show a dialog box containing user data; Send_Mail - sends an email using an address specified on the Em
FREE
TTF Osc AM
Andriy Matviyevs'kyy
This indicator displays the moment when the TTF oscillator crosses the zero value, and the moment when the TTF oscillator crosses its smoothed value. Crossing the zero value by the TTF oscillator is a buy/sell signal. If the TTF oscillator crosses its smoothed value, it is a signal of a trend change. The signal is given after the end of the formation of the candle. The signal is confirmed when the price crosses the high/low of the bar on which the signal was given. The indicator does not redraw.
FREE
FATL cci AM
Andriy Matviyevs'kyy
The product combines the best features of the standard CCI oscillator with the adaptive digital filter. The indicator allows entering and exiting the market at the very beginning and end of a trend. The indicator generates high-probability signals while retaining high sensitivity. The indicator does not repaint on fully formed bars. Options: Ind_Price - price used for the indicator calculation; Ind_Period - indicator period. Application rules: A big red dot - a strong bearish trend, if the price
FREE
EasyTrend AM
Andriy Matviyevs'kyy
EasyTrend AM is an indicator that allows you to open a position at the very beginning of a significant price movement. The second most important quality of the indicator is the ability to follow the trend as long as possible in order to obtain all potential profits while minimizing potential losses. This indicator does not repaint or not recalculate. A version of this indicator with advanced settings and signal notifications is EasyTrend 3 AM . Signal of the indicator: red arrow appearing abov
FREE
FATL Momentum AM
Andriy Matviyevs'kyy
This technical indicator is a Momentum indicators built using a fast adaptive digital filter - FATL. In a simplified sense, an adaptive digital filter is a moving average with effective smoothing. Using a digital filter allows you to smooth out sharp fluctuations with minimal signal delay. Using the indicator: It should be taken into account that the values ​​of the indicator on the zero bar (which has not finished forming yet) may change, so decisions should be made after the end of the bar for
Zone Trade AM
Andriy Matviyevs'kyy
The indicator is based on the elements of Bill Williams' trading system. Sell signals are formed when MACD and OsMA values are falling simultaneously (Bill Williams calls these indicators АО and АС in his book), while buy signals appear when both indicators are rising. Thick and thin colored histograms match MACD and OsMA values. If the histogram is greater than 0, the indicator value is rising. Otherwise, it is falling. Positions should be opened when the price exceeds the bar's high or low, at
FATL Arrows AM
Andriy Matviyevs'kyy
This indicator generates signals when the close price values ​​go beyond the channel built using the FATL fast digital filter. Application is extremely simple: The up arrow is a buy signal. Down arrow - sell signal. The signal must be confirmed by the price breaking the high/low of the bar on which the signal was given. The indicator is effective for trend trading. Thus, to open a position, it is necessary to take into account the trend of a higher period. Signals against the trend of a higher p
HyperSignal AM
Andriy Matviyevs'kyy
The  indicator generates signals for opening positions. The principle of operation is to compare the current average price with a range of average prices over a longer period. The signals are confirmed when the price exceeds the High/Low of the bar where the indicator generated the signal.  Maintenance of an open position is carried out on a smaller TF. Indicator signals to open an opposite position on a smaller TF are a signal to close the deal. This indicator does not repaint or not recalculat
FATL Line AM
Andriy Matviyevs'kyy
The presented indicator is a moving average based on the fast digital filter (FATL) data. Using the indicator is similar to using a standard moving average: For small values ​​of the period of the moving average (1-10): Buying/selling is carried out at the moment of changing the direction of the moving average (after the price has overcome the high/low of the bar on which the change of direction occurred). For large values ​​of the period of the moving average: Buying / selling is carried out de
ZT Signal AM
Andriy Matviyevs'kyy
The indicator displays elements of the trading system, name trading in the zone, described by Bill Williams. Sell signals are formed when MACD and OsMA values are falling simultaneously (Bill Williams calls these indicators АО and АС in his book), while buy signals appear when both indicators are rising. The indicator has no configurable parameters. (Indicator variant in which MACD and OsMA parameters can be changed - ZT Signal 2 AM ). The indicator signals are confirmed when the price exceeds t
Fine Trade AM
Andriy Matviyevs'kyy
5 (1)
Not all price changes can be used for trading, as small price fluctuations do not allow you to make a profit. The presented indicator with high efficiency gives signals about the moments of a significant change in the direction of price movement. The indicator is intuitive and easy to use. The indicator signal is generated after the completion of the bar, where the indicator changes its position relative to zero. Never repaints signal. The indicator signals must be confirmed by the price exceedi
FATL Alligator AM
Andriy Matviyevs'kyy
This indicator is a combination of classic trend indicator and signals of the fast digital filter. The indicator has no configurable parameters. The signals are displayed on completed bars and are not redrawn. It shows high efficiency on periods greater than 1 hour. The usage principle is intuitive - trade in the direction shown by the fan of moving averages. Enter once the price exceeds the High/Low of the bar where the signal was formed. Exit on the opposite conditions.
SATL Alligator AM
Andriy Matviyevs'kyy
This indicator is a combination of classic trend indicator and signals of the slow digital filter. The indicator has no configurable parameters. The signals are displayed on completed bars and are not redrawn. It shows high efficiency on periods less than 1 hour. The usage principle is intuitive - trade in the direction shown by the fan of moving averages. Enter once the price exceeds the High/Low of the bar where the signal was formed. Exit on the opposite conditions.
Filtro:
No hay comentarios
Respuesta al comentario
Versión 26.1 2023.10.07
Updated.
Versión 25.1 2023.09.09
Updated.
Versión 25.0 2023.08.13
Updated to version 25+.
Versión 20.0 2023.07.25
Updated.
Versión 5.0 2023.05.21
New version.
Versión 4.1 2016.07.01
- Added new settings
- Added automatic replacement of incorrect settings
- Added signals.
Versión 1.1 2016.02.11
Optimized the indicator buffers usage.