SX Golden MA Pack MT5
- Indicadores
- Mojtaba Sarikhani
- Versión: 1.0
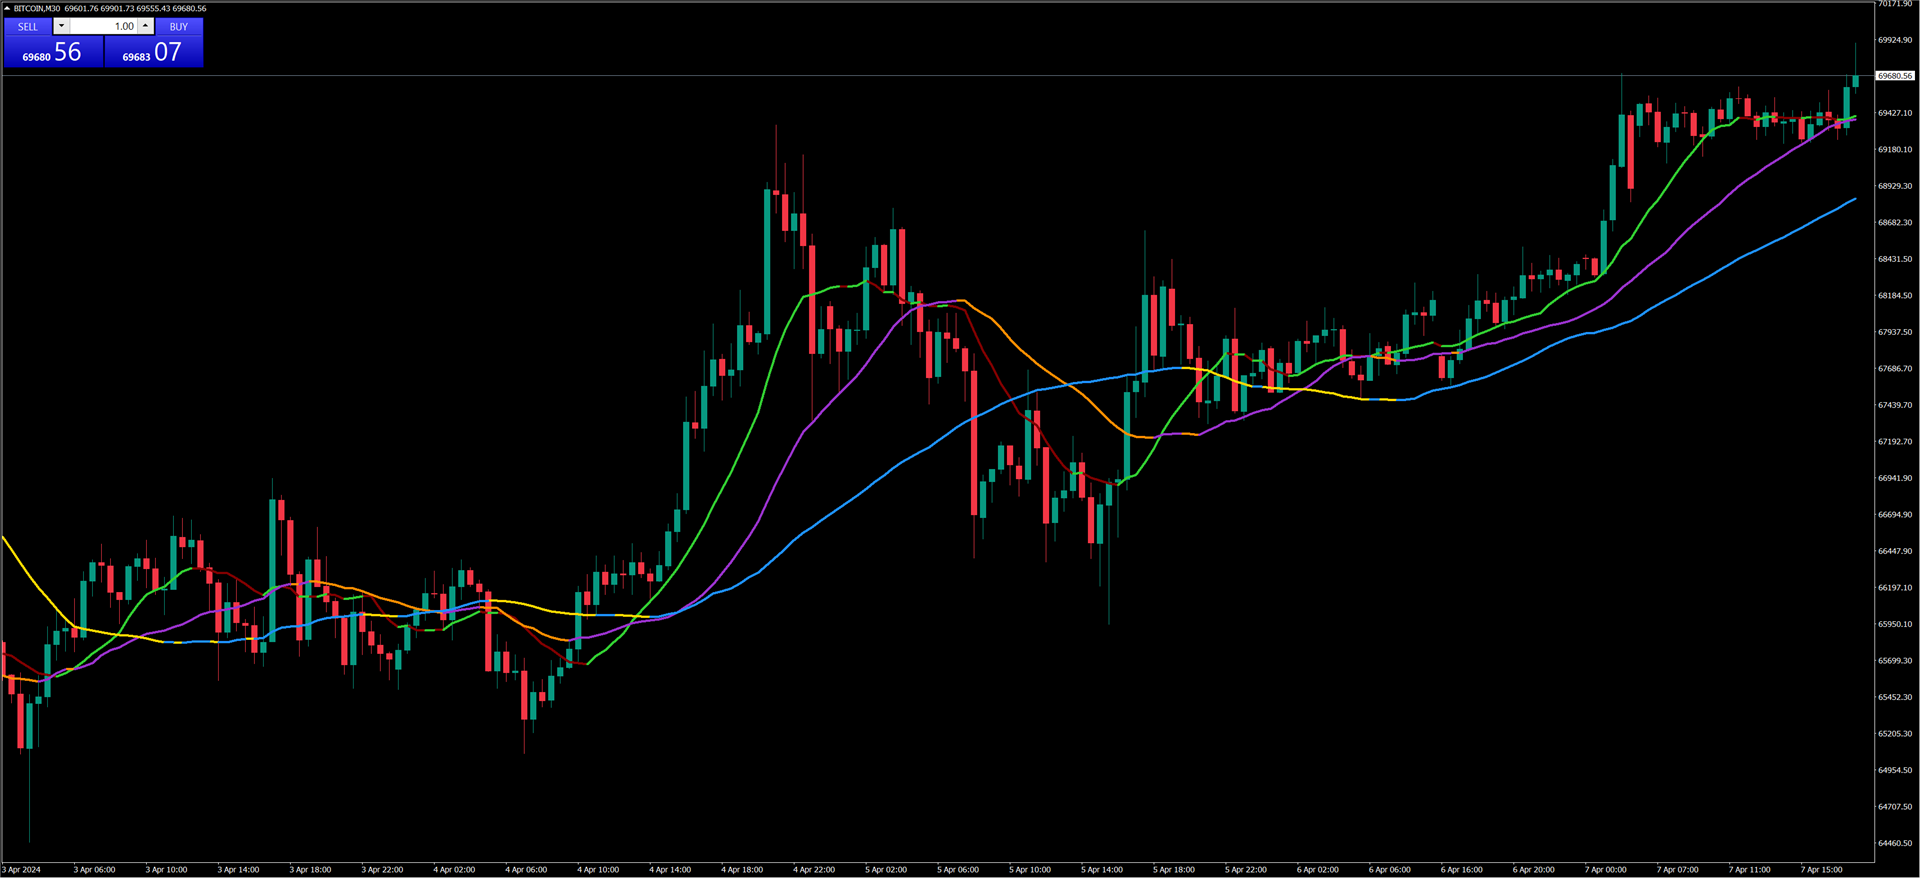
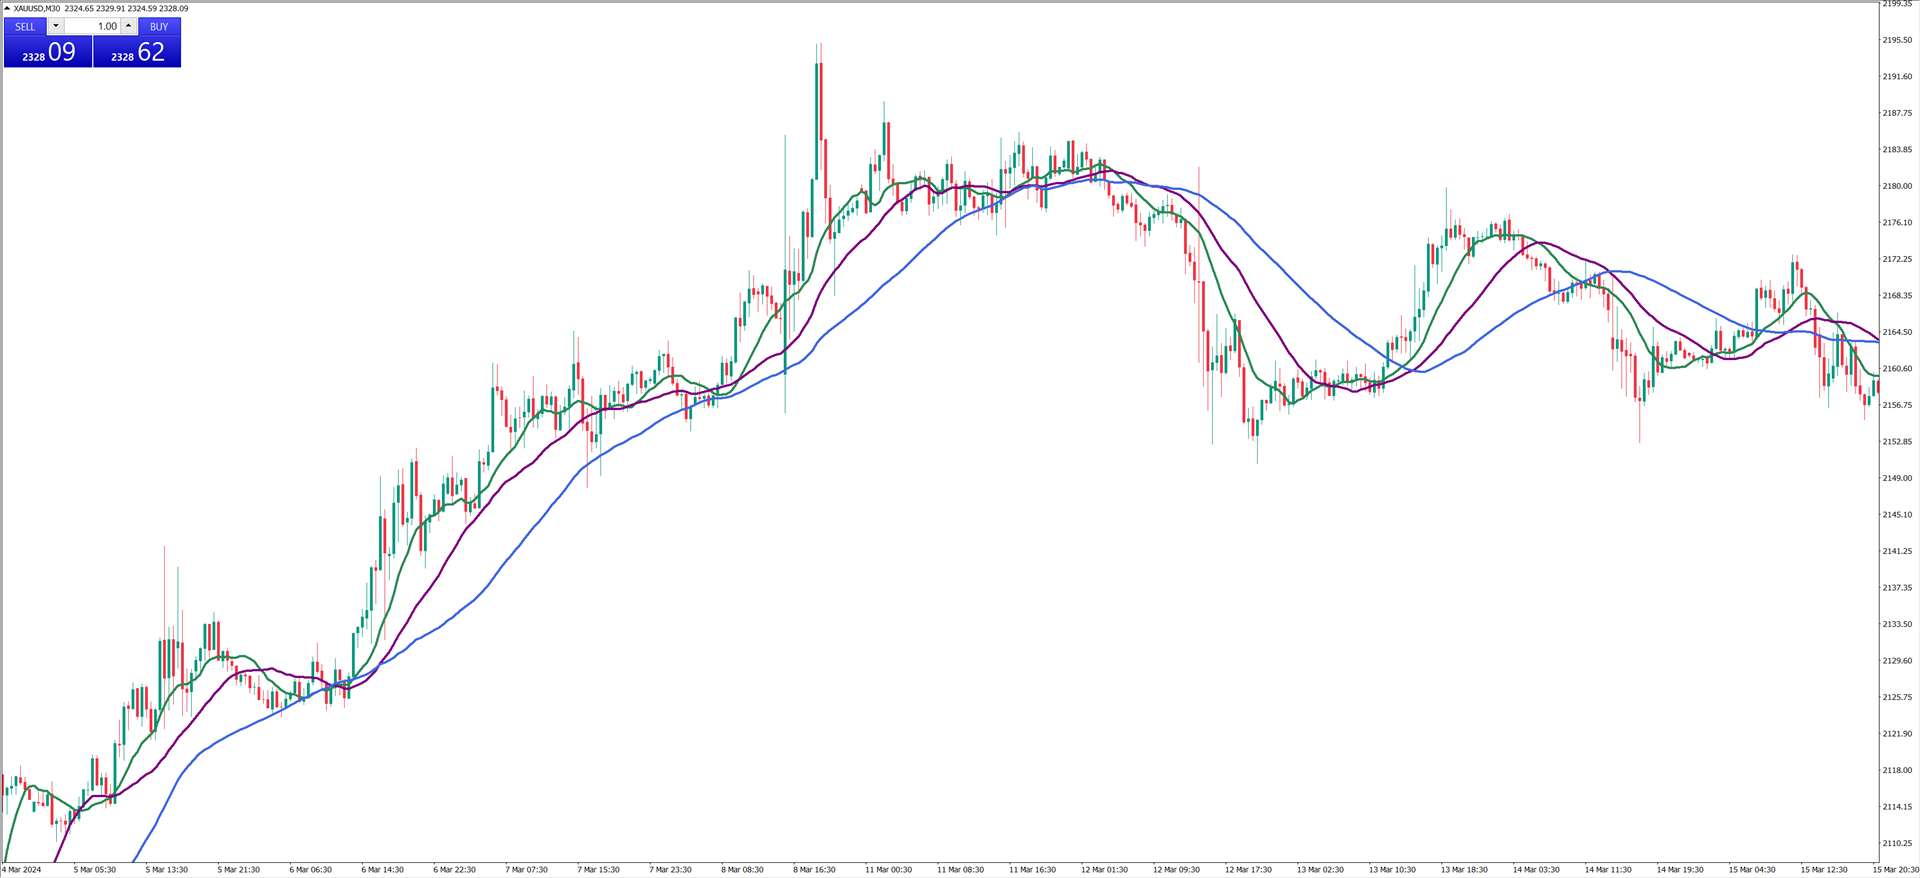
This comprehensive technical indicator calculates and plots up to 3 moving averages with 3 different periods. By employing three moving averages of distinct lookback periods, the trader can confirm whether the market has indeed experienced a change in trend or whether it is merely pausing momentarily before resuming its prior state.
SX Golden MA Pack for MT4 is available here.
The shorter the moving average period, the more closely it tracks the price curve. When a security initiates an uptrend, faster moving averages (short-term) will start rising much earlier than the slower moving averages (long-term).
The third moving average is utilized in conjunction with the other two moving averages to validate or refute the signals they produce. This diminishes the likelihood of the trader acting on false signals.
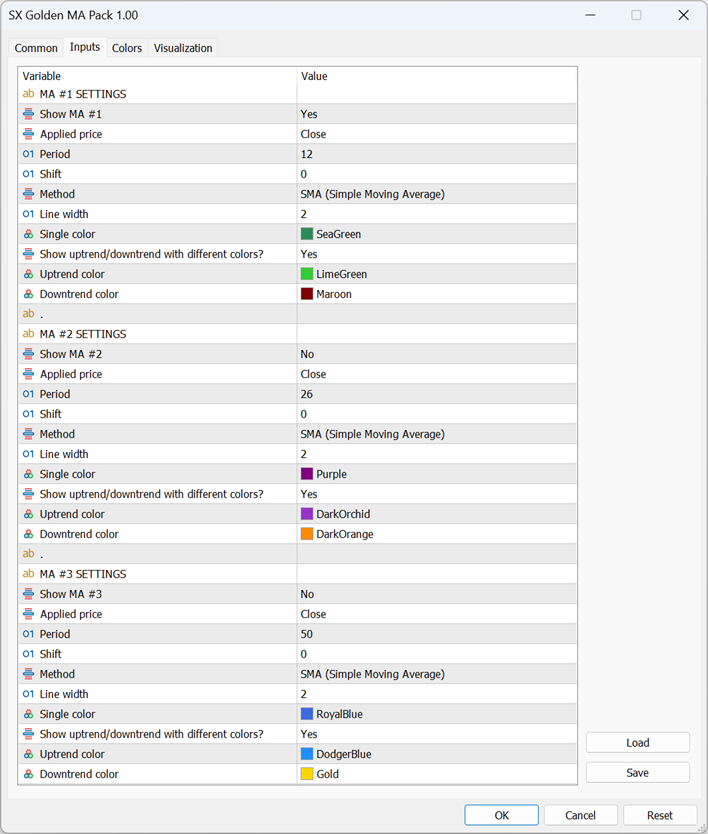
There are 36 different averaging methods that can be chosen for each of the three MAs:
- SMA (Simple Moving Average)
- EMA (Exponential Moving Average)
- SMMA (Smoothed Moving Average)
- LWMA (Linear Weighted Moving Average)
- ALMA (Arnaud Legoux Moving Average)
- BF2P (Two-Pole modified Butterworth Filter by John Ehlers)
- BF3P (Three-Pole modified Butterworth Filter by John Ehlers)
- Decycler (Simple Decycler by John Ehlers)
- DEMA (Double Exponential Moving Average by Patrick Mulloy)
- DsEMA (Double Smoothed EMA)
- eVWMA (Modified eVWMA)
- EWMA (Exponential Weighted Moving Average)
- GeoMean (Geometric Mean)
- HMA (Hull Moving Average by Alan Hull)
- IE_2 (Combination of LSMA and ILRS)
- ILRS (Integral of Linear Regression Slope)
- ITrend (Instantaneous Trendline by John Ehlers)
- JSmooth (Jurik Smoothing by Mark Jurik)
- Laguerre (Laguerre filter by John Ehlers)
- LSMA (Least Square Moving Average (or EPMA, Linear Regression Line))
- MD (McGinley Dynamic)
- Median (Moving Median)
- REMA (Regularized Exponential Moving Average by Chris Satchwell)
- SineWMA (Sine Weighted Moving Average)
- SMA_eq (Simplified SMA)
- SuperSmu (SuperSmoother by John Ehlers)
- T3 (by Tim Tillson (correct version))
- T3_basic (by Tim Tillson (original version))
- TEMA (Triple Exponential Moving Average by Patrick Mulloy)
- TriMA (Triangular Moving Average)
- TriMAgen (Triangular Moving Average generalized by John Ehlers)
- TsEMA (Triple Smoothed Exponential Moving Average)
- VEMA (Volume-weighted Exponential Moving Average)
- VWMA (Volume Weighted Moving Average)
- Wilder (Wilder Exponential Moving Average)
- ZEMA (Zero-Lag Exponential Moving Average)
The selection of applied prices used to calculate moving averages is as follows:
- Close
- Open
- High
- Low
- Median: (High + Low) / 2
- Typical: (High + Low + Close) / 3
- Weighted Close: (High + Low + Close + Close) / 4
- Median Body: (Open + Close) / 2
- Average: (High + Low + Open + Close) / 4
- Trend Biased
- Trend Biased (extreme)
- Heiken Ashi Close
- Heiken Ashi Open
- Heiken Ashi High
- Heiken Ashi Low
- Heiken Ashi Median
- Heiken Ashi Typical
- Heiken Ashi Weighted Close
- Heiken Ashi Median Body
- Heiken Ashi Average
- Heiken Ashi Trend Biased
- Heiken Ashi Trend Biased (extreme)
All three moving averages are fully customizable. Additionally, you can choose to plot each moving average in a single color or two colors based on uptrend or downtrend.
#Tags: Triple Moving Average Crossover Strategy, Moving Average Trading Strategies, Up Trend, Down Trend, Heiken Ashi
DISCLAIMER: Please notice that we do not provide any financial advice. We only provide tools for anyone interested in improving their trading.