• Información general
  • Comentarios
  • Discusión

SMC indicator for ICT All in One

Este es el indicador todo en uno del concepto de dinero inteligente (SMC) para traders del círculo interno (ICT), que funciona correctamente en cualquier símbolo y en cualquier período.

Sus algoritmos de ejecución y velocidad están optimizados.

  • Se considera que el usuario tiene conocimientos básicos del llamado algoritmo de entrega de precios interbancarios (IPDA) en los mercados de divisas, que incluyen:

    • Liquidez, también conocida como naturaleza humana: identificación y medición;

    • Cuatro fases fundamentales del mercado: consolidación, expansión, retroceso, reversión;

    • Tres sesiones intradía: asiática, londinense, neoyorquina;

    • Tres movimientos de precios: acumulación, manipulación, distribución;

  • Este indicador está diseñado para aquellos que no desean dibujar manualmente los elementos de ICT cada vez que abren un nuevo gráfico en un período.

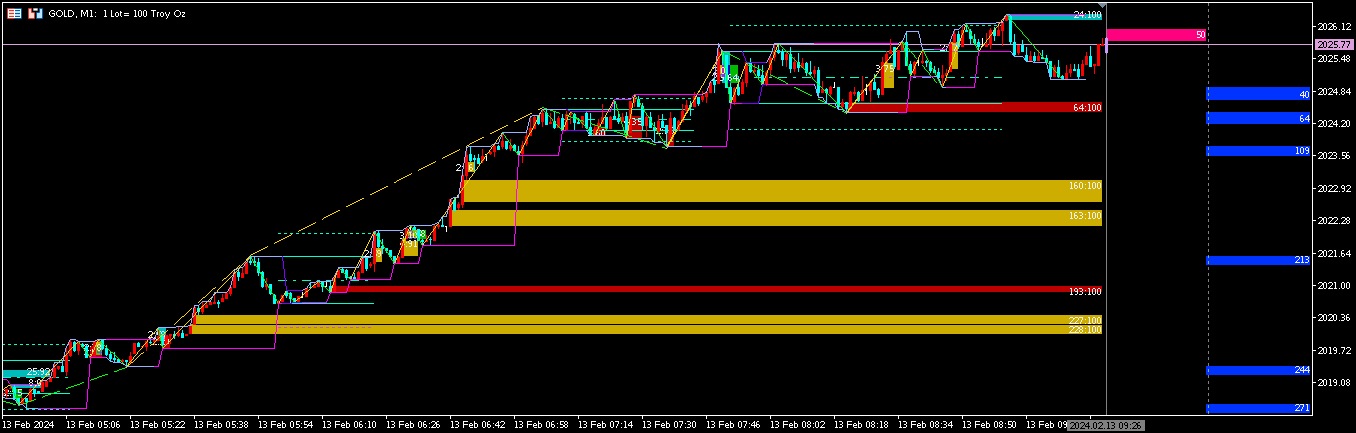
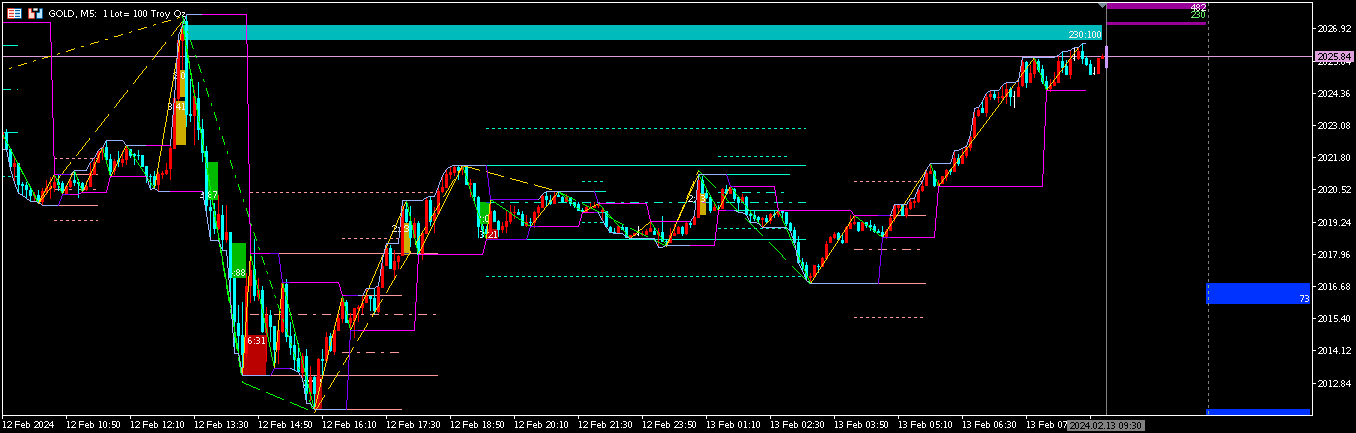
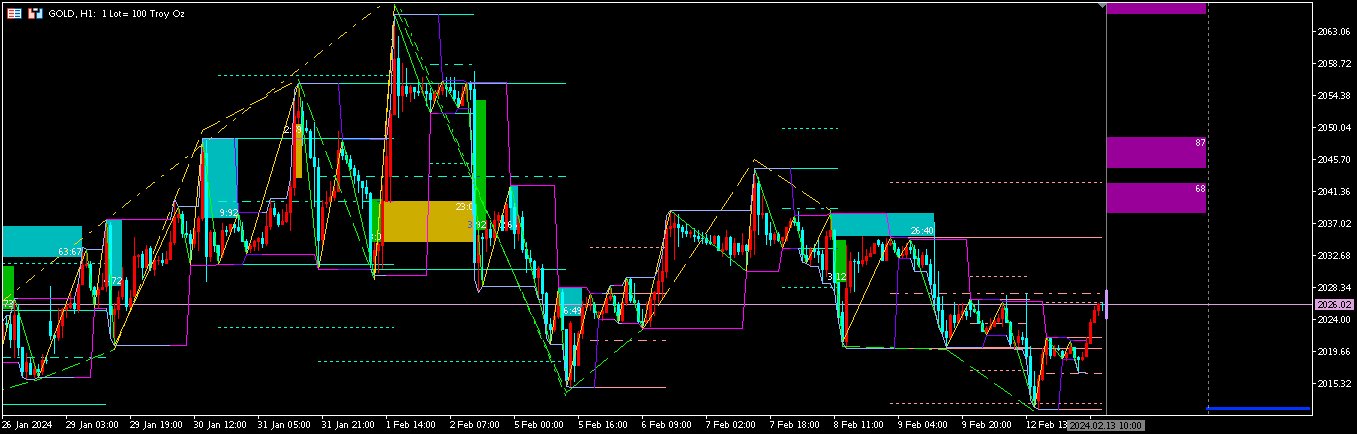
  • Las estructuras de SMC en este indicador son las siguientes:

    • Altos y bajos oscilantes de múltiples niveles en una estructura fractal, mostrados por líneas sólidas verdes y doradas, líneas discontinuas y líneas de puntos y guiones;

    • Tendencia del oscilación: ruptura de la estructura (BOS), cambio de carácter (CHoCH), cambio en la estructura del mercado (MSS), mostrados por líneas tricolores de estado triple de ofensiva (azul claro) - defensa (rosa) - tregua (púrpura) en la rama superior del precio (UP) y la rama inferior del precio (LP);

    • Mercado unilateral: siguiendo las escaleras rosas de la defensa, tendiendo hacia la línea azul claro de la ofensiva;

    • Intervalo de consolidación: cuadrícula de líneas de intervalo alto y bajo (sólidas), línea de equilibrio (punto y guion) que diferencia los rangos de prima y descuento, línea de liquidación (punto) que finaliza el intervalo, en color naranja (intervalo alcanzado desde una tendencia alcista) o verde azulado (desde una tendencia bajista).

    • Brechas de valor justo alcistas y bajistas (FVG) desechables;

    • Bloques de órdenes alcistas y bajistas (OB) desechables;

    • Piscinas de liquidez (LP) o precios de interés (POI) identificados por máximos y mínimos importantes expuestos en las oscilaciones de segundo nivel y superiores, mostrados por rectángulos púrpuras y azul oscuro (inactivo, no se ha aprovechado la liquidez) o rosa brillante y azul claro (activo, aprovechando la liquidez) en el panel derecho;

  • La unidad de vela, es decir, la media móvil de 240 velas de (alto - bajo), se muestra mediante una pequeña barra violeta.

  • El esquema de color predeterminado es el siguiente:

    • Tendencia alcista o demanda en colores rojo y dorado;

    • Tendencia bajista o oferta en colores cian y verde;

  • Si el usuario desea personalizar el esquema de color u otros parámetros, por favor, póngase en contacto con el autor para obtener el código.


Productos recomendados
ToolBox 360 is the swiss knife of all indicators. It is full packed with useful tools to help you with your trading. It can be used to find best entry and exit points and help you to decide if you should open a trade or not. It shows market trends, candlestick formations outside / inside bars and you can sett time based allerts. Main features: Time based Fibonacci lines Choose a start and end time and the indicator shows you Fibonacci lines within the selected time range including range high
Disclaimer : Keep in mind that seasonal patterns are not always reliable. Therefore, thoughtful risk management is crucial to minimize losses.  Seasonal patterns in the financial world are like a well-guarded secret that successful investors use to their advantage. These patterns are recurring price movements that occur during specific periods or around special events. Additionally, there are also intraday patterns that repeat. For example, Uncle Ted from Forex Family suggests examining previou
Our indicator will help you to make a decision whether to Buy or Sell , including where to set the Take Profit and Stop Loss . The Buy/Sell signal will not redraw nor repaint until new signal occurs. The Take Profit and Stop Loss will change following the market conditions. Our indicator will give alert to your mobile/handphone when new buy/sell signal arrive. For best result, combine this indicator with your knowledge on price action and support & resistance, also don't forget to watch for the
XFlow
Maxim Kuznetsov
XFlow muestra un canal de precios en expansión que ayuda a determinar la tendencia y los momentos de su reversión. También se utiliza en el acompañamiento de transacciones para la instalación de Take-Profit / Stop-loss y promedios. Prácticamente no tiene parámetros y es muy fácil de usar: simplemente especifique un momento importante para usted de la historia y el indicador calculará el canal de precios. LÍNEAS MOSTRADAS ROTATE es una línea sólida gruesa. Centro de rotación general del precio
Impulse fractals indicator - is counter-trend oriented complex market fractal pattern.  Market creates bull/bear impulse, trend starts, fractals on impulsed wave are an agressive pullback signals. Buy arrow is plotted when market is bearish and it's impulse showed up-side fractal, and sell arrow is plotted when market is bullish and it's impulse showed dn-side fractal. Main indicator's adjustable inputs : impulsePeriod - main period of impulse histogram  filterPeriod  - smoothes impulse accordi
MarketMagnet
Kelly Adediran Raymond
Are you ready to take your trading journey to new heights? Look no further than MarketMagnet, this groundbreaking indicator designed to propel your trading success with excitement and accuracy. Powered by the convergence of Momentum and CCI (Commodity Channel Index), MarketMagnet equips traders with the ultimate tool to determine direction and entry prices for a wide range of recommended currency pairs and instruments. It is designed for traders seeking to scalp for a few pips on lower timeframe
QuantumAlert Stoch Navigator is a free indicator available for MT4/MT5 platforms, its work is to provide "alerts" when the market is inside "overbought and oversold" regions in the form of "buy or sell" signals. This indicator comes with many customization options mentioned in the parameter section below, user can customise these parameters as needful. Join our   MQL5 group , where we share important news and updates. You are also welcome to join our private channel as well, contact me for the p
FREE
INDICADOR basado en INTELIGENCIA ARTIFICIAL que genera posibles entradas de compra y venta de opciones binarias. El indicador funciona con 3 estrategias diferentes: 1) al leer volúmenes, envía una señal cuando el precio debería revertirse 2) a través de la divergencia entre precio y volumen, envía una señal de cuándo la tendencia debe continuar o revertirse 3) a través de la convergencia entre precio y volumen, envía una señal de cuándo debe continuar la tendencia. el indicador fu
Drawing Pack MT5
John Louis Fernando Diamante
This indicator provides several drawing tools to assist in various methods of chart analysis. The drawings will keep their proportions (according to their handle trendline) across different chart scales, update in real time, and multiple drawings are supported. # Drawing Option Description  1 Grid box draggable boxed grid, user defines rows x colums, diagonal ray option  2 Grid partial or fullscreen grid, sized by handle line  3 Grid flex a diagonal grid, sized and sloped by handle line
Candle EA MT5
Mansour Babasafary
4.3 (40)
This expert is based on patterns The main patterns of this specialist are candlestick patterns Detects trends with candlestick patterns It has a profit limit and a loss limit, so it has a low risk The best time frame to use this expert is M30 time frame The best currency pairs to use with this expert is the EURUSD, GBPUSD, AUDUSD, USDCAD currency pairs The price will increase by 100$ after every 10 purchases! Final price 2450$ Get a 50% bonus by buying (or even renting) any of our product
- This is an implementation of OCC ==> open close cross - This indicator applies twelve different averaging methods to open and close prices separately to signal the trend switching. - All MA methods are set as input as well as period and different offsets applied to linear regression and ALMA averaging. - Buffers 16 and 17 can be used in EAs to detect trend direction. - You can message in private chat for further changes you need.
To download MT4 version please click here . - This is the exact conversion from TradingView: "Linear Regression Candles" By "ugurvu". - The overall look of the indicator is like Heiken Ashi. - It can be used as a trend confirmation indicator to detect the right trend direction. - This indicator lets you read the buffers for Candles' OHLC. - This is a non-repaint and light processing load indicator - You can message in private chat for further changes you need. Thanks
Индикатор Magneto Weekly Pro отображает: Недельные важные линии поддержки и сопротивления (выделены желтым, красным и синим цветами). Основные недельные цели (выделены белым цветом). Недельные паттерны возврата цены (обозначаются красными флажками). Применение индикатора Magneto Pro можно использовать и как дополнение к существующей стратегии, и как самодостаточную торговую стратегию. Данный продукт состоит из двух индикаторов, работающих на разных временных промежутках, и предназначен для скал
Malaysian SNR Levels
Matthias Horst Pieroth
This indicator can be used to display Support and Resistance levels according to  the  Malaysian SNR concept , in which Support and Resistance are exact levels of a line chart. Malaysian SNR There are 3 different horizontal levels in Malaysian SNR: A-Level : This level is located at the peak of this line chart. (shape looks like the letter A) V-Level : Level at the valley of a line chart, (shape looks like the letter V) Gap-Leve l: This level is located at the Close/Open gap between two cand
¡Presentamos RSIScalperPro - un revolucionario indicador basado en RSI para MetaTrader 5, diseñado específicamente para el scalping en gráficos de un minuto! Con RSIScalperPro, tendrás una herramienta poderosa para señales precisas de entrada y salida, lo que mejorará tu eficiencia de trading. RSIScalperPro utiliza dos diferentes indicadores de RSI que proporcionan señales claras para los niveles de sobrecompra y sobreventa. Puedes ajustar los periodos de tiempo y los valores límite de los dos
Ignition
Dansie Software Limited
Strategy Overview The Ignition EA tries to take advantage of sudden momentum when the Ignition pattern is detected. The final bar in the ignition pattern has a small opening wick, a very little or no closing wick, is large in comparison to recent bars and must start from the lower end of the current range (for a bullish ignition) Quick Testing Use Symbol EURUSD, Timeframe M2, and remove the GBPUSD symbol from the "Symbols" input (stratergy 1 and stratergy 2) Settings The below settings
Stormer RSI 2
Ricardo Rodrigues Lucca
This strategy was learned from Stormer to be used on B3. Basically, 15 minutes before closing the market, it will check RSI and decided if it will open an position. This strategy do not define a stop loss. If the take profit reach the entry price it will close at market the position. The same happens if the maximal number of days is reached. It is created to brazilian people, so all configuration are in portuguese. Sorry Activations allowed have been set to 50.
ROC acceleration-deceleration is the manual system for medium-term scalping. Indicator based on custom ROC system which defines bullish/bearish market and especially  acceleration-deceleration of tendention in the market's main direction. Buy arrow is plotted during bearish market when current trend decelerates and sell  arrow is plotted during bullish market when current trend decelerates. Main Indicator's Features Signals are not repaint,non-late or disappear(exept cases when system recalculat
Советник скальпер торгует в тиковом канале основанном на канале Дончиана. Уникальный алгоритм расчета канала учитывает тиковые движения рынка и подстраивается под канал, для получения максимальной прибыли.  Советник рассчитан на брокеров с минимальным спредом и комиссиями. Работает на многих кроссах. В роботе возможна торговля фиксированным лотом или лотом пропорциональным депозиту.  Так же предусмотрен виртуальный стоплосс который отрабатывает расширения спреда в Ролловер и на новостях.
DYNAMIC SR TREND CHANNEL Dynamic SR Trend Channel is a simple indicator for trend detection as well as resistance/support levels on the current timeframe. It shows you areas where to expect possible change in trend direction and trend continuation. It works with any trading system (both price action and other trading system that use indicators) and is also very good for renko charting system as well. In an uptrend, the red line (main line) serves as the support and the blue line serves as the
La esencia del sistema consiste en la identificación del momento de formación de la vela compuesta "de vuelta" con características determinadas (tamaño de la vela en puntos, estructura de sombras).En el análisis de las velas japonesas el análogo de estas velas de vuelta son "Martillo" (Hammer) y "Hombre colgado" (Hanging Man), pero en este sistema el cuerpo de la vela no tiene que ser obligatoriamente pequeño, y la vela resultante se construye de varias velas. Parámetros de entrada del sistema:
FREE
ÚSALO SÓLO CON LOS ARCHIVOS ESTABLECIDOS QUE PUBLICÉ EN LA SECCIÓN DE COMENTARIOS. Vídeo de Youtube: https://www.youtube.com/watch?v=kQN5LTd91rk&amp ;amp;t=2s Esta es la mayor actualización en la vida de Imperium Pattern EA, tiene nuevas características y motor. ---Obtuvo el sistema de motor TheNomadTrader Dynamic oficial junto con una buena relación riesgo:recompensa ---Nueva característica que permite a los comerciantes decirle al EA después de cuánto tiempo (valor X en minutos) el EA puede ce
Market Chopper Indicator - is the manual system for market scalping. Indicator uses most accurate points to enter, when current trend has lost it's power and new one starts. Indicator shows : Enter points(buy/sell arrows), Exit points(Stoploss/Takeprofit arrows). Indicator makes market analysis and adapts to any market, any timeframe showing most relevant strategy for exact conditions. Main Indicator's Features Signals are NOT repaint, late or disappear; Every signal comes at the open of new bar
TPO Profile MT5
Kyra Nickaline Watson-gordon
Definition : TPO is a Time Price Opportunity. Instead of using bars or candles with an Open, High, Low, and Close price, each "bar" in a Market Profile is represented by horizontal bars against the price It is called Market Profile terminology. In other words time-price-opportunity (TPO) profiles are histograms of how much time was spent at each price within the span of the profile. By using a TPO chart, you are able to analyze the amount of trading activity, based on time, for each price leve
Gecko EA MT5
Profalgo Limited
5 (1)
NEW PROMO: Only a few copies copies available at 349$ Next price: 449$ Make sure to check out our " Ultimate EA combo package " in our   promo blog ! Gecko runs a simple, yet very effective, proven strategy.  It looks for important recent support and resistance levels and will trade the breakouts.  This is a "real" trading system, which means it will use a SL to protect the account.  It also means it will not use any dangerous techniques like martingale, grid or averaging down. The EA shows its
QuantumAlert RSI Navigator is a free indicator available for MT4/MT5 platforms, its work is to provide "alerts" when the market is inside "overbought and oversold" regions in the form of "buy or sell" signals. This indicator comes with many customization options mentioned in the parameter section below, user can customise these parameters as needful. Join our MQL5 group , where we share important news and updates. You are also welcome to join our private channel as well, contact me for the priva
FREE
Live signal https://www.mql5.com/en/users/datbh/seller [MT4 version: https://www.mql5.com/en/market/product/93601 ] ! Next price --> $699 and final: 1779$ MSC Line  is the advanced smart  grid system  which already works on real accounts. Instead of fitting the system to reflect historical data (like most people do) it was designed to exploit existing market inefficiencies. Therefore it is not a simple "hit and miss" system which only survives by using grid. Instead it uses real market mechani
Magic EA MT5
Kyra Nickaline Watson-gordon
Magic EA is an Expert Advisor based on Scalping, Elliot Waves and with filters such as RSI, Stochastic and 3 other strategies managed and decided with the robot smartly. Large number of inputs and settings are tested and optimized and embedded in the program thus inputs are limited and very simple. Using EA doesn't need any professional information or Forex Trading Knowledge. EA can trade on all symbols and all time frames, using special and unique strategies developed by the author. The EA
Volatility Index Pro Indicator
Savia Forex Software Solutions
Volatility Index Pro Indicator The Savia Forex Solutions Volatility Index Pro Indicator gives you highly accurate entries on all Volatility Indices and Jump Indices. The Volatility Index Pro Indicator is dynamic and powerful and is optimized for all timeframes. Trade with improved confidence and maximize your success rate. Benefits Dynamic and Powerful. Volatility Index Pro Indicator is fully optimized for all chart timeframes. Volatility Index Pro Indicator works with Volatility Indices and Jum
Los compradores de este producto también adquieren
Eng Gold
Ely Alkrar Xshkaky
ENG-GOLD Scalper It is an auxiliary indicator that identifies potential targets and determines the place of entry with a stop loss that works on Heiken Ashi candles  The green lines are usually the targets, the red lines are the stop loss, and the yellow lines are the entry location.  This file is recognized on small and medium frames, usually less than the watch frame I highly recommend using XAUUSD US100 US30 USOIL 
TrendMaestro5
Stefano Frisetti
note: this indicator is for METATRADER4, if you want the version for METATRADER5 this is the link:  https://www.mql5.com/it/market/product/108106 TRENDMAESTRO ver 2.4 TRENDMAESTRO recognizes a new TREND in the bud, he never makes mistakes. The certainty of identifying a new TREND is priceless. DESCRIPTION TRENDMAESTRO identifies a new TREND in the bud, this indicator examines the volatility, volumes and momentum to identify the moment in which there is an explosion of one or more of these data a
IVISTscalp5
Vadym Zhukovskyi
5 (3)
Te presentamos el indicador iVISTscalp5, que no solo es único sino también efectivo en operaciones de trading. Este indicador se basa en datos temporales y es el resultado de muchos años de experiencia y análisis profundo de los mercados financieros. El indicador iVISTscalp5 es una excelente herramienta para el trading manual. La conveniencia, simplicidad y visualización, toda la complejidad está oculta en su interior. Hemos simplificado al máximo la configuración y uso del indicador iVISTscalp5
Weis Wave with Alert MT5
Trade The Volume Waves Single Member P.C.
4.93 (15)
Rental/Lifetime Package Options and Privileges  * For optimum results the yearly or lifetime package is suggested due to live training ! Rent Monthly Six Months   Yearly/Lifetime Weis Wave with Speed with Alert+Speed Index x x x Manual  x x x Quick Set up Video x x x Blog x x x Lifetime Updates x x x Setup and Training Material x x Free Rectangle Break Alert Tool      x Discord Access Channel "The SI traders" x 2-hour live methodology training x How to trade with it:    http://
VTrende Pro
Andrii Diachenko
5 (1)
VTrende Pro - MTF indicator for trend trading with a display panel for MT5 *** Videos can be translated into any language using subtitles (video language - Russian) Although the signals of the VTrende Pro indicator can be used as signals of a full-fledged trading system, it is recommended to use them in conjunction with the Bill Williams TS. VTrende Pro is an extended version of the VTrende indicator. Difference between Pro version and VTrende: - Time zones - Signal V - signal 1-2 waves
NIVELES CRITICOS DE RAD Los procesos de Acumulación y Distribución de Volumen generan los soportes y resistencias naturales del mercado.  A medida que estos proceso se generan, los niveles en los que el volumen relevante se posiciona se convierten en zonas de difíciles de franquear al alza o a la baja. El indicador RAD,   rastrea el Volumen Relevante en tiempo real, identificando los  procesos de acumulación y distribución, graficándolos como  zonas de SOPORTE o RESISTENCIA.  Mediante el uso de
The indicator is designed to close positions on the market in time. For example: to take profits ahead of schedule if the price has not reached TakeProfit, and the market is turning around. The indicator analyzes the momentum, not the trend. He does not give any information about the trend. The indicator is well suited for finding divergence. The Ershov 38 Parrots indicator dynamically adjusts to the market and detects price movement impulses of medium and high amplitude. It almost does not rea
Tatino Super Signals is Non Repaint Indicator for Binary Option trading and Forex trading. Recommendations: Timeframe: All timeframes. For best results we recommend using it on M1, M5 and M15 timeframes. Currency pairs: All Pairs Account type: All Type Broker time: Any Brokers : Alls Binary Trading : Expired 1 Candle Buffer Buy=1, Sell=0, Entry Next Candle Recommended Forex trading stop loss : 15 pips Recommended  Forex tradingTake profit levels : 15 pips Specifications: Does not repaint  
ZigZag de Suavizador
Cesar Juan Flores Navarro
Teniendo una entrada de precios suavizados, los cuales son procesador por un ZigZag en tiempo real, dando como resultado un suavizador ajustado a un ZigZag. Con valores de entrada (periodo) mayores se vuelve un poco lenta en M1,, Ideal para H1, H4, D1 Trabaja bien con otros suavizadores, ya que su intersección es ideal Al iniciar empiza con mayor precisión desde el momento de activación, siendo el historial (anterior) de referencia ----------------------------------------------------------------
Super Suavizador
Cesar Juan Flores Navarro
Indicador en MQL5 que obtiene el promedio de 10 EMAS que son alineadas y procesadas según Fibonacci luego el promedio es suavizado"  Se ingresa un número de 2 a N que multiplica los EMA-Fibonacci y por consiguiente aumenta los fibonacci, resultando un promedio.   Se ingresa un número que suaviza los EMA-Fibonacci. Considerando los números 1/1 seria la suavización minima. Considerando los números 3/5 seria la suavización media. Considerando los números 10/30 seria la suavización alta.....etc
Smooth price for Monarch
Konstantin Gruzdev
5 (1)
The Smooth Price technical indicator is used for plotting a smoothed line as close to the price of the financial instrument as possible, and serves to eliminate its noise components. The indicator is part of the Monarch trading system, but here it is presented as an independent technical analysis tool. The indicator is based on the cluster digital filter , which, unlike the ClusterSMA , is applied directly to the price time series. Smooth Price does not redraw (except the very last, zero bar) an
Классификатор силы тренда. Показания на истории не меняет. Изменяется классификация только незакрытого бара. По идее подобен полной системе ASCTrend, сигнальный модуль которой, точнее его аппроксимация в несколько "урезанном" виде, есть в свободном доступе, а также в терминале как сигнальный индикатор SilverTrend . Точной копией системы ASCTrend не является. Работает на всех инструментах и всех временных диапазонах. Индикатор использует несколько некоррелируемых между собой алгоритмов для класси
¡El nivel Premium es un indicador único con más del 80% de precisión de predicciones correctas! ¡Este indicador ha sido probado por los mejores especialistas en comercio durante más de dos meses! ¡El indicador del autor no lo encontrarás en ningún otro lugar! ¡A partir de las capturas de pantalla, puede ver por sí mismo la precisión de esta herramienta! 1 es ideal para operar con opciones binarias con un tiempo de vencimiento de 1 vela. 2 funciona en todos los pares de divisas, accion
Pendiente de Precio
Cesar Juan Flores Navarro
Indicador en base a la pendiente de la linea de precio, dibuja una línea de color cuando sube a base de los precios que previamente has sido procesados o linealizados, y cuando baja la pendiente la linea linealizada toma otro color. En este caso se a considerado 6 lineas de diferentes procesos desde pendientes largas hacia las cortas, observándose que cuando coincidan las pendientes se produce un máximo o mínimo, lo que a simple vista nos permitirá hacer una COMPRA O VENTA.
WanaScalper
Isaac Wanasolo
1 (1)
A scalping indicator based on mathematical patterns, which on average gives signals with relatively small SL, and also occasionally helps to catch big moves in the markets (more information in the video) This indicator has three main types of notifications: The first type warns of a possible/upcoming signal on the next bar The second type indicates the presence of a ready signal to enter the market/open a position The third type is for SL and TP levels - you will be notified every time price r
Индикатор Coefficient Of Determination (COD) представляет собой значение коэффициента детерминации или квадрат коэффициента корреляции между зависимой переменной — ценой и объясняющей переменной — тиковым объемом. Что это дает нам на практике? COD отлично распознает кульминацию трендовых движений, что позволяет подбирать оптимальные точки и ловить развороты рынка. Как использовать индикатор: Наиболее популярная торговая стратегия строится совместно с трендовым индикатором Moving Average (MA), пе
Fibonacci Multiple 12
Cesar Juan Flores Navarro
Fibonacci Múltiple 12, utiliza la serie fibonacci plasmado en el indicador fibonacci, aumentadolo 12 veces según su secuencia. El indicador fibonacci normalmente muestra una vez, el presente indicador se mostrara 12 veces empezando el numero que le indique siguiendo la secuencia. Se puede utilizar para ver la tendencia en periodos cortos y largos, de minutos a meses, solo aumentado el numero MULTIPLICA.
Recommended TimeFrame >= H1. 100% Non Repainted at any moment.  Use it carefully, only with Trend Direction. Trading Usage: 2 Variants: as Range System or as BreakOut System (Both Only With Trend Direction)::: (Always use StopLoss for minimise Risk); [1] as Range System: (Recommended) in UP TREND:  - BUY in Blue Line , then if price goes down by 50 points (on H1) open Second BUY.   Close in any Profit you wish: TrailingStop(45 points) or Close when Price touches upper Gold Line. in DOWN TR
En base a cálculos matemáticos de determino una linea Horizontal que cruza a todas las señales de trading, mostrando los máximos y mínimos. La linea horizontal parte en dos las subidas y bajadas de las señales de trading, de tan manera que es fácil identificar los máximos y mínimos, y es inteligente por que es sensible a las subidas y bajadas, afín de no quedarse en un solo lado por siempre, trabaja excelentemente con otros indicadores suavizadores ya que les garantiza que en un intervalo de tie
Spike Detector
Tete Adate Adjete
este indicador es un indicador de detector de picos, está especialmente diseñado para intercambiar Boom 1000, Boom 500, Crash 1000 y Crash 500 Recomendamos usarlo solo en índices Deriv Boom y Crash Su configuración es intuitiva, familiar y fácil de usar. tiene funciones de notificación; notificaciones sonoras y notificaciones push. esta herramienta es fácil de usar, fácil de manejar Esta actualización se basa en diferentes estrategias para picos.
Limitless MT5
Dmitriy Kashevich
Limitless MT5 is a universal indicator suitable for every beginner and experienced trader. works on all currency pairs, cryptocurrencies, raw stocks Limitless MT5 - already configured and does not require additional configuration And now the main thing Why Limitless MT5? 1 complete lack of redrawing 2 two years of testing by the best specialists in trading 3 the accuracy of correct signals exceeds 80% 4 performed well in trading during news releases Trading rules 1 buy signa
Escalera Inteligente
Cesar Juan Flores Navarro
Indicador en MQL5, recibe la información del precio SUAVIZADO, lo procesa anulando los picos inteligentemente, y el resultado lo envía al desarrollo de la escalera que iniciara y subirá o bajara según el peldaño o INTERVALO ingresado Ingreso PERIODO = 50 (variar segun uso) Ingreso MULTIPLICA AL PERIODO = 1 (variar segun uso) Segun la configuración la escalera puede pegarse o separarse de los precios,, Se aplica toda la linea de tiempo, y a todas las divisas, etc.  
Fibonacci Suavizado
Cesar Juan Flores Navarro
Indicador en MQL5, que obtiene el promedio de 10 EMAS, que son alineadas según Fibonacci, obteniendo un promedio, que sera suavizado.  Se puede ingresar un numero desde 2 a N, que multiplica a los EMA-Fibonacci. Funciona en cualquier criptomoneda, etc. etc... pudiendo calcular el futuro segun la tendencia de las EMAS. Funciona excelentemente en tramos largos, determinando exactamente el mejor inicio/salida. El precio inicial por apertura sera por un periodo de tiempo, luego aumentará.
Seconds Charts
Aleksandr Goryachev
Micro  ******************* Секундные графики MT5 ********************** Более точного инструмента для входа в сделку вы не найдёте. Входные параметры: Timeframe, sek - период построения графика, секунды Displayed bars - отображаемые бары Step of price levels, pp, 0-off - шаг отрисовки ценовых уровней, пункты Scale points per bar, 0-off - масштаб в пунктах на бар Show lines - отображение текущих уровней Show comment - отображение комментария Standard color scheme - стандартная цветовая сх
QuantXSTocks Trading Range Indicator for MT5: INSTRUCTIONS TO USE OUR INDICATOR:- User needs to take trade on Arrow or after an Arrow CandleStick, You can achieve up-to 35-125 pips target by this Indicator. Best Timeframes for Stocks and Indices are M30 and H1: AMAZON M30 (50 pips) TESLA M30 (50 pips) APPLE M30 (50 pips) ADOBE M30 (50 pips) NASDAQ100 H1 (125 pips) The above are the approximate amount of pips you can achieve by this Indicator, Green arrow appears to be buy arrow while the Red a
Trend and Signals MT5  indicator scans  30 trading Instruments (Forex, Metals and Indices).     It uses special algorithm on the  current market   based on   Pure Price Action   and display the overall trend and signal on the dashboard. When signals are produced the indicator sends alert and notification. Strategy for Signals This indicator uses the daily timeframe to determine the direction of the trend. The hourly timeframe is used to identify possible entries. Main trend and is determined by
Cycles Forecast
Pooriya Alirezaee
This indicator is based on a mathematical formula and an ANN combined, designed to make a model(using previous prices) of the most recent market condition (any chart*) in order to use the model as a forecasting tool. *This indicator can operate on any chart/timeframe, but it's suggested you use multiple timeframes for each trade because this method relies solely on the time factor, you can not use this indicator to predict price volatility, but if it's fit correctly it will show you when the nex
Robos
Namu Makwembo
Big promotion on the Robos, Get yours now Robos Indicator The   ROBOS   indicator is a multi timeframe oscillator that targets the   overbought   and   oversold  regions of a price chart, a signal is indicated by the two lines crossing, compatible with all tradable instruments Latest Release The latest release is the version 4.0 #What's new in version 4.0 ? Features Extreme oversold and overbought levels ROBOS version  4.0  comes with cool new feature , the ability to target on
This indicator is based on the crossing of two Moving Average with the RSI It is intended for scalpers Specially designed for Boom and Crash syhtetic indices from Binary.com/Deriv.com It is easy to use and intuitive. We recommend its use on M1 and is equipped with three types of notification Email alert Sound notification Push notification these parameters can be activated and deactivated.
Este indicador ofrece un sólido método de análisis de mercado centrado en el concepto de 'Herramienta de Canal de Regresión'. Al aprovechar esta herramienta, los traders pueden obtener un control excepcional sobre el canal de regresión de sus gráficos, lo que les permite tomar decisiones comerciales más informadas. La Herramienta de Canal de Regresión es un instrumento poderoso en el arsenal de un trader. Está diseñada para proporcionar información valiosa sobre las tendencias de precios y los p
Otros productos de este autor
Este es el indicador que muestra la fracción estimada de volúmenes largos y cortos, funcionando en cualquier símbolo en cualquier período. Sus algoritmos de ejecución y velocidad están optimizados. Método de estimación: Para barras históricas sin información de ticks, mide el porcentaje de máximo y mínimo en comparación con la apertura y el cierre de manera adecuada; Para barras presentes con información de ticks, calcula la dirección de cada tick y suma la fracción de operaciones largas y corta
FREE
Este es el indicador de zonas de soporte y resistencia de múltiples niveles, que funciona en cualquier símbolo y en cualquier período. Sus algoritmos de ejecución y velocidad están optimizados. Soporte/resistencia de primer nivel: Fractales de m ínimos/ m áximos mostrados por l íneas sólidas verdes y doradas en el gr áfico principal; Zonas de soporte/resistencia mostradas por bloques de color cian claro y rojo claro en el panel derecho; Soporte/resistencia de segundo nivel: Fractales de m ínimos
Este es el indicador de un radar de osciladores que funciona en cualquier símbolo y en cualquier período. Sus algoritmos de ejecución y velocidad están optimizados. Los elementos de los osciladores son: Una matriz MACD para acciones de impulso relativo; Una curva TSI para acciones de impulso absoluto; Las desviaciones est ándar de 60 barras de ambas acciones se muestran mediante l íneas de cuadrícula en el panel derecho. Los principales propósitos son: Se considera que el movimiento de precios d
Filtro:
No hay comentarios
Respuesta al comentario