Colored EMA SMA
- Indicadores
- Theo Karam
- Versión: 1.1
- Actualizado: 9 febrero 2024
- Activaciones: 20
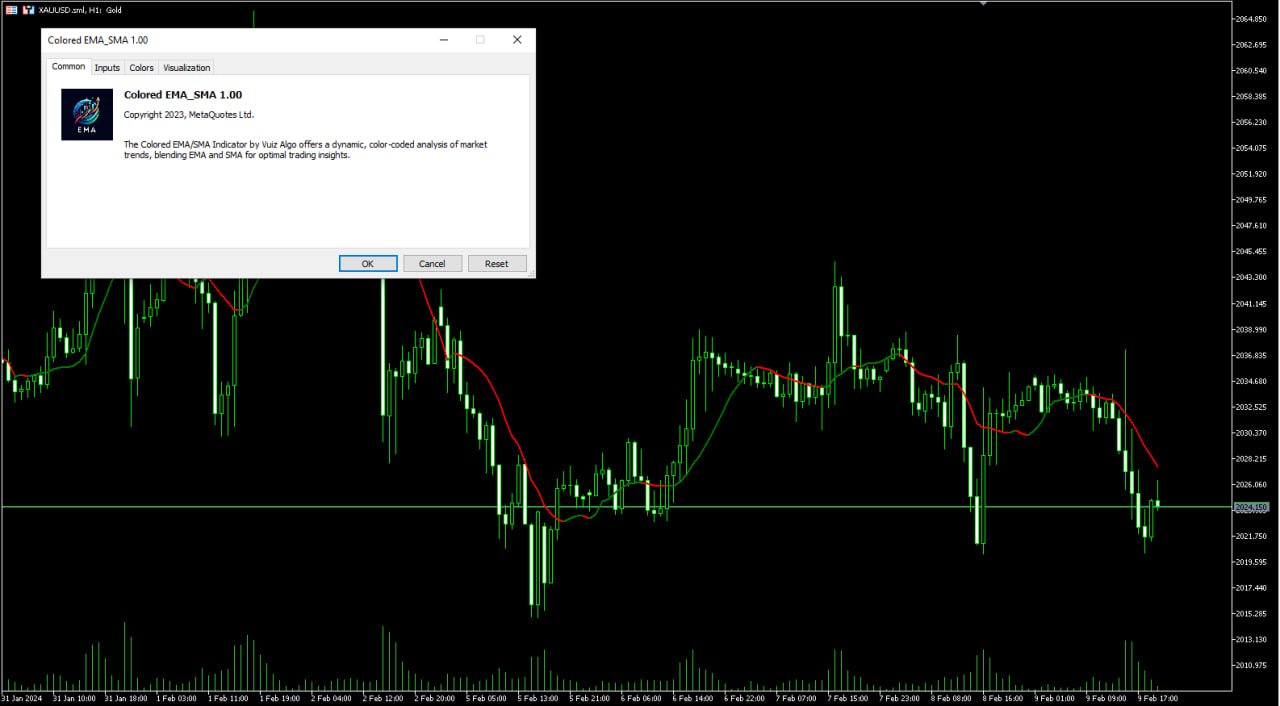
Colored EMA/SMA Indicator: A Dynamic Tool for Trend Analysis
The Colored EMA/SMA (Exponential Moving Average/Simple Moving Average) Indicator is a cutting-edge financial tool designed to empower traders and analysts with deeper insights and a clearer understanding of market trends. By blending the precision of the EMA with the simplicity of the SMA, this indicator offers a comprehensive view of market momentum and potential price movements.
Features:
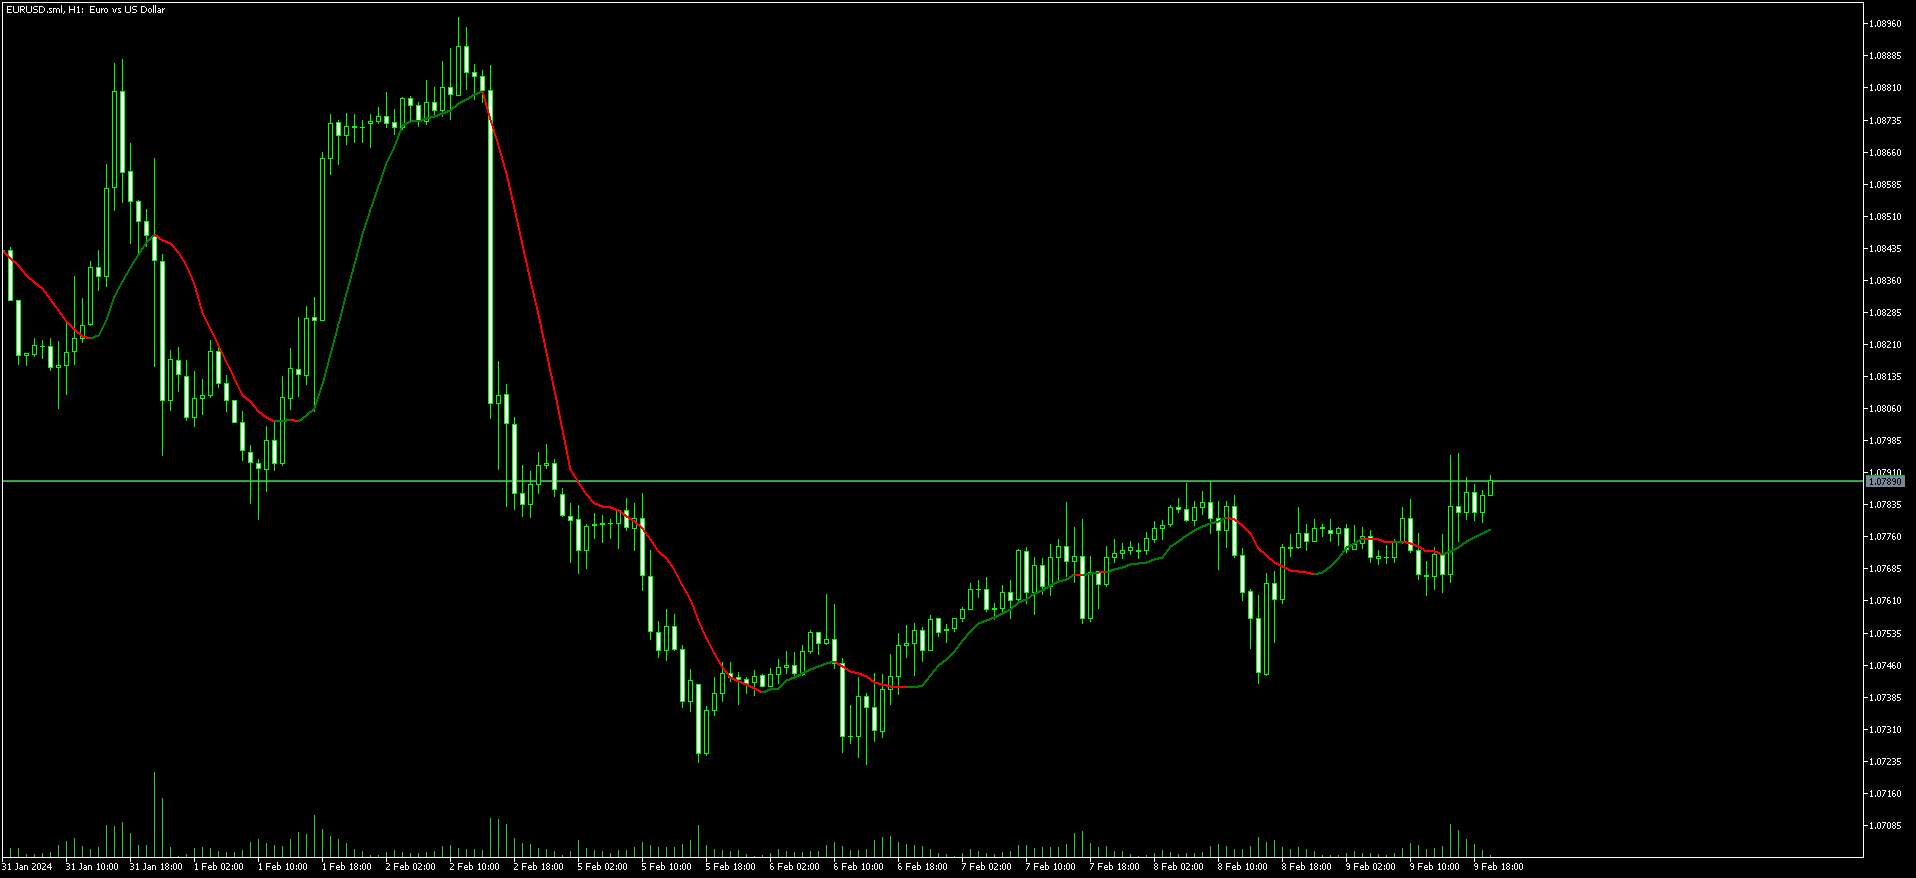
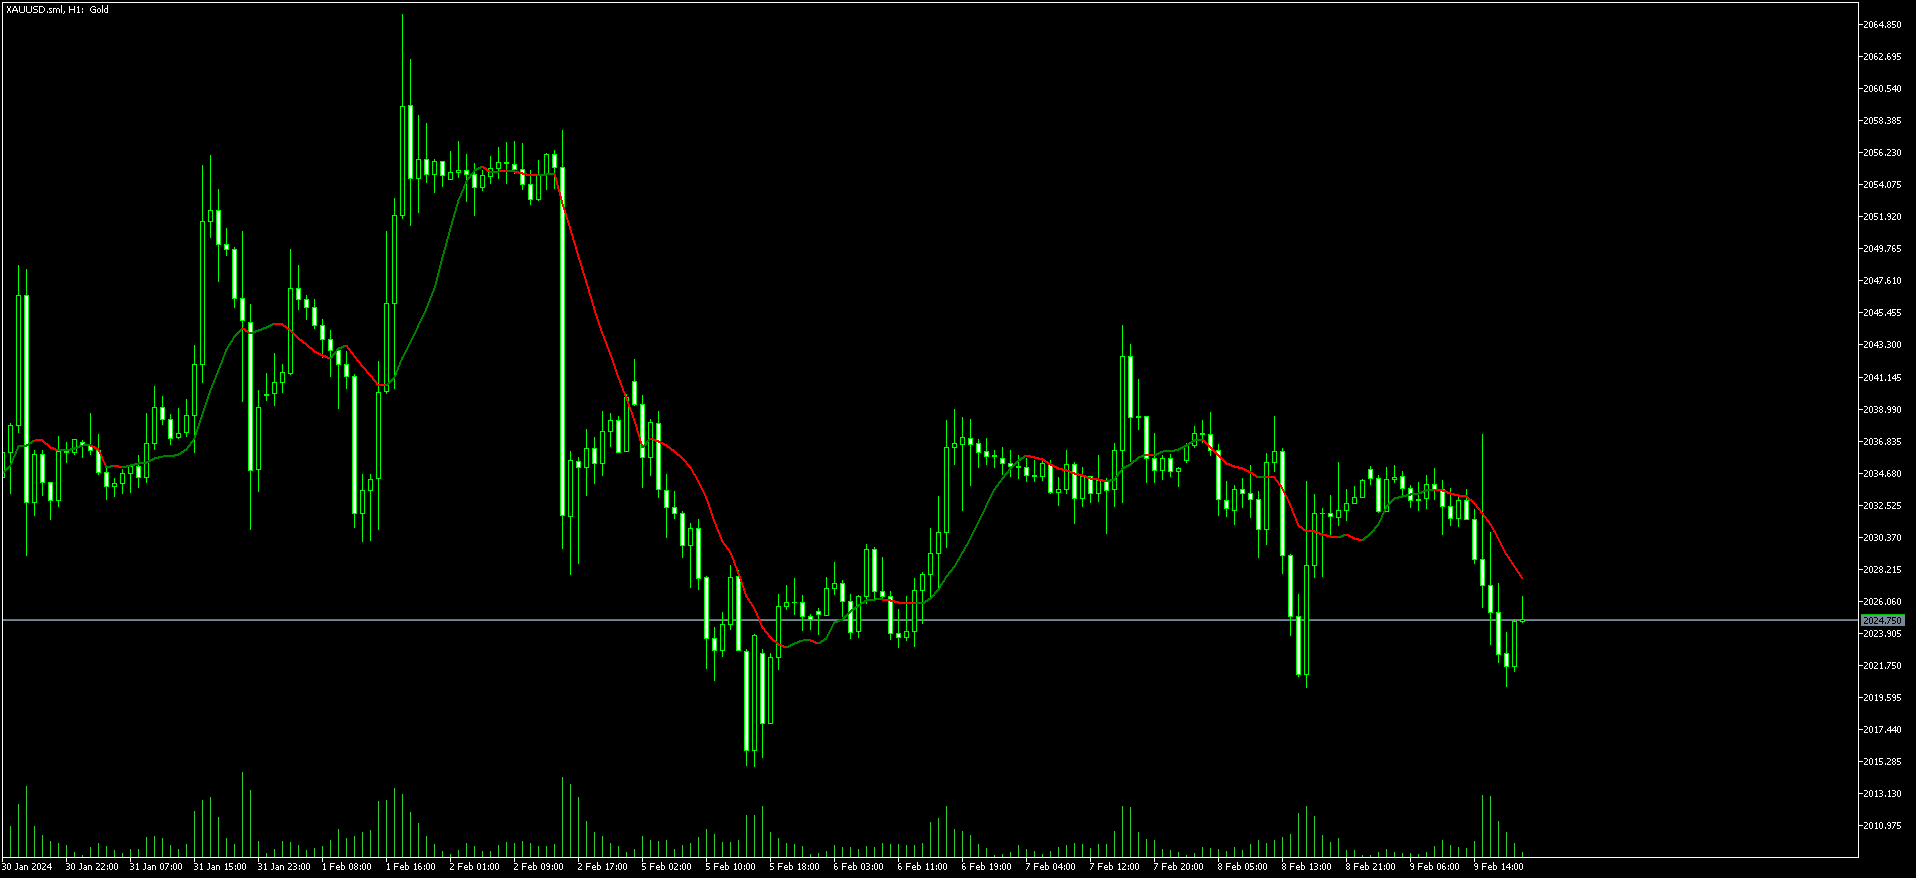
- Color-Coded Visuals: Utilizes a vibrant color scheme to distinguish between different periods, making it easier to identify bullish or bearish trends at a glance.
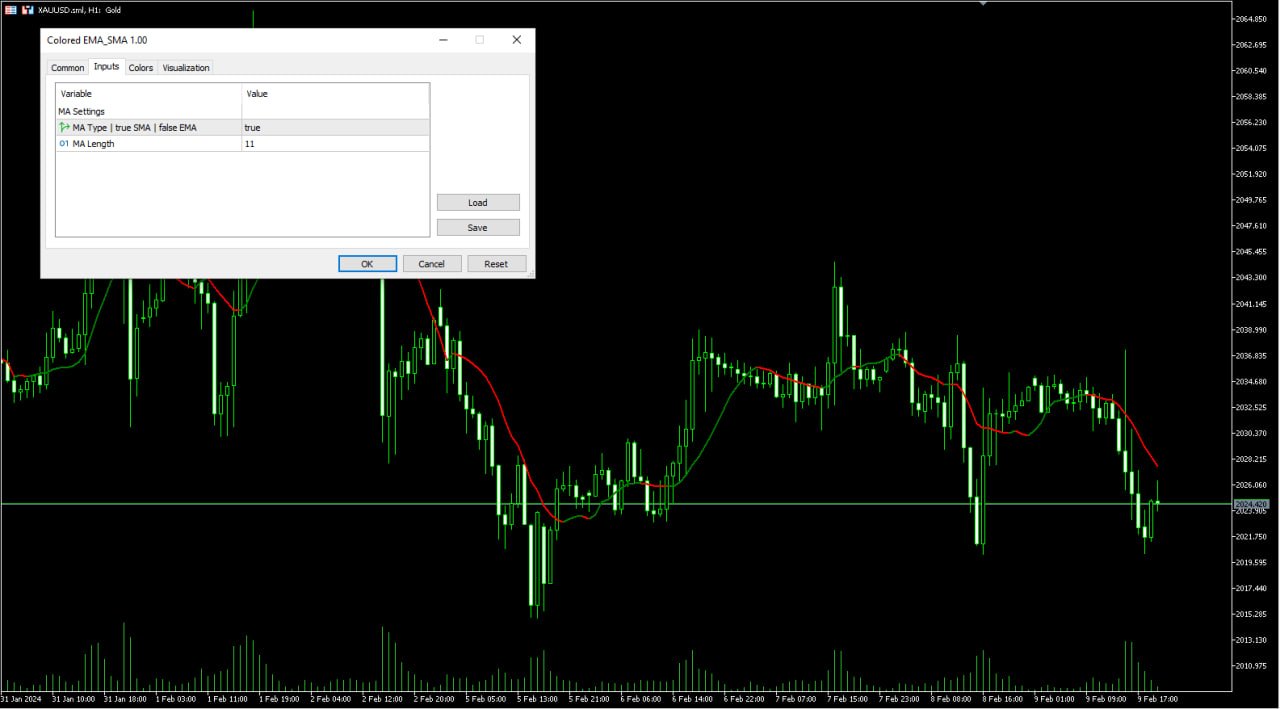
- Customizable Periods: Offers flexibility by allowing users to adjust the periods for both the EMA and SMA, tailoring the analysis to their specific trading strategy.
- Real-Time Updates: Dynamically updates with each new price data, ensuring traders have the most current information at their fingertips.
- User-Friendly Interface: Designed with simplicity in mind, making it accessible for both novice traders and seasoned analysts.
Benefits:
- Enhanced Decision Making: Provides a clearer picture of market dynamics, helping traders make informed decisions based on the synthesis of EMA and SMA data.
- Risk Management: By identifying trend reversals and momentum shifts early, traders can better manage their risk and protect their investments.
- Strategic Planning: Helps in the development of robust trading strategies by highlighting potential entry and exit points.
Whether you're a day trader looking to capitalize on short-term movements or an investor analyzing long-term trends, the Colored EMA/SMA Indicator is an invaluable tool in your trading arsenal. Experience a new level of clarity and precision in your market analysis, and navigate the financial markets with confidence.