• Información general
  • Comentarios
  • Discusión
  • Novedades

Pips On Candles

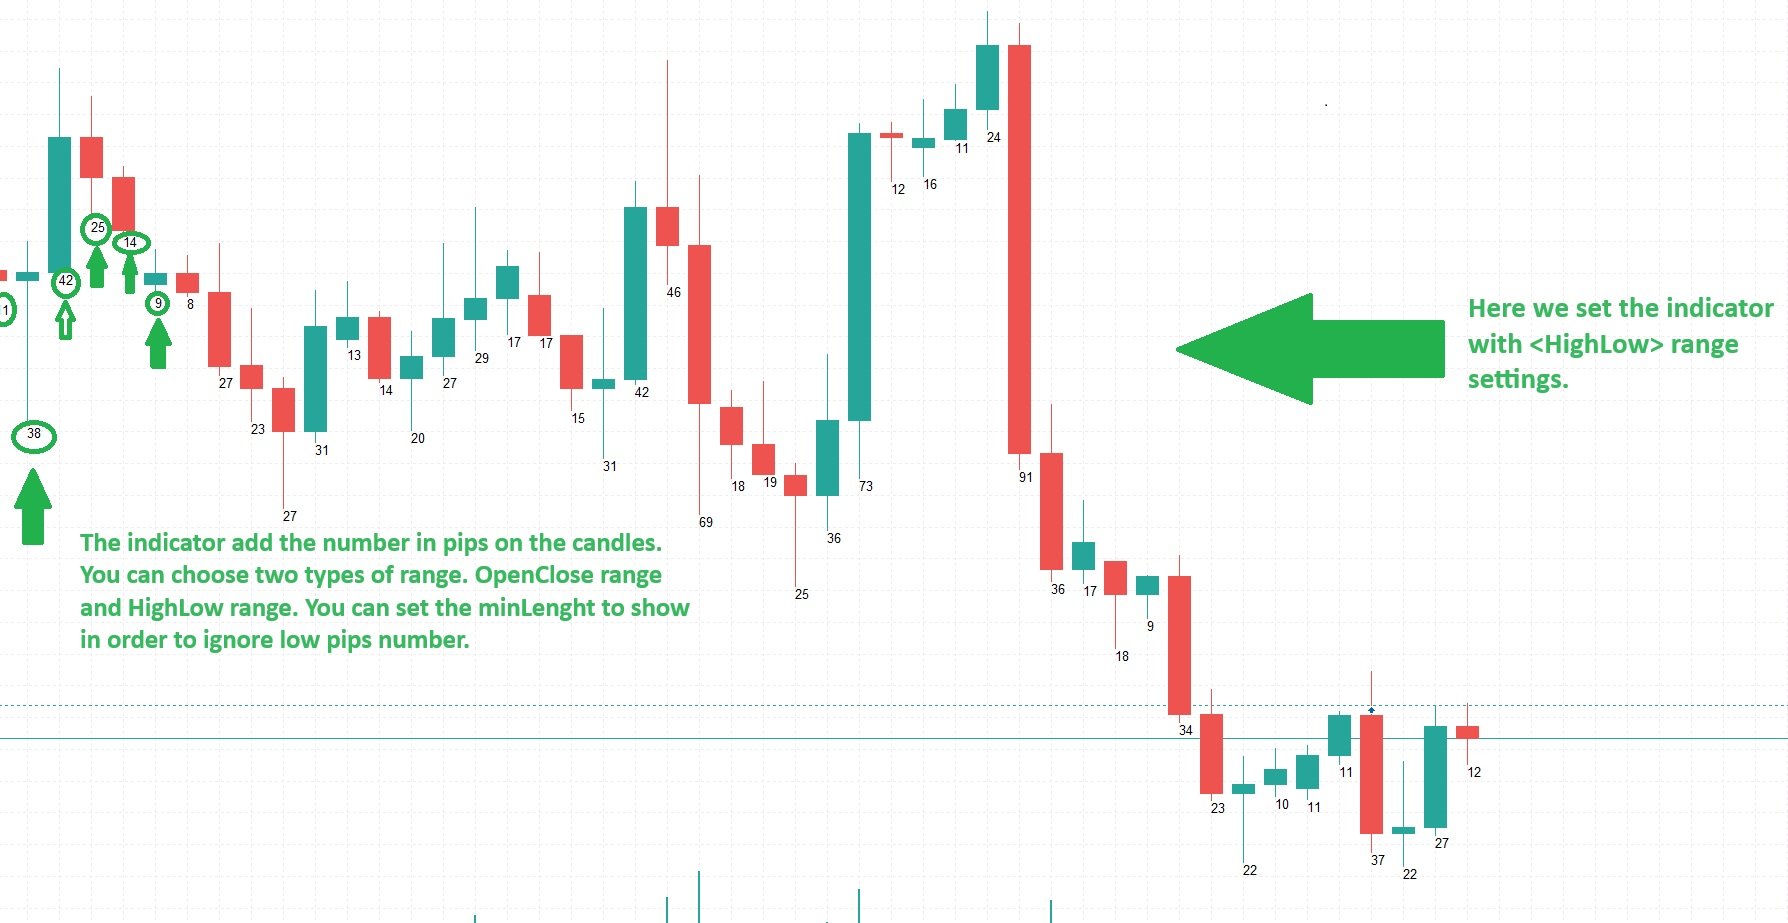
Pips on Candles shows the number of pips involved in each candle on the chart. It is possible to set 3 different ranges for counting on each single candle via the RangeType parameter:

  • With "HighLow" you count the pips present between the minimum and the maximum. The number is shown under each candlestick on the chart.
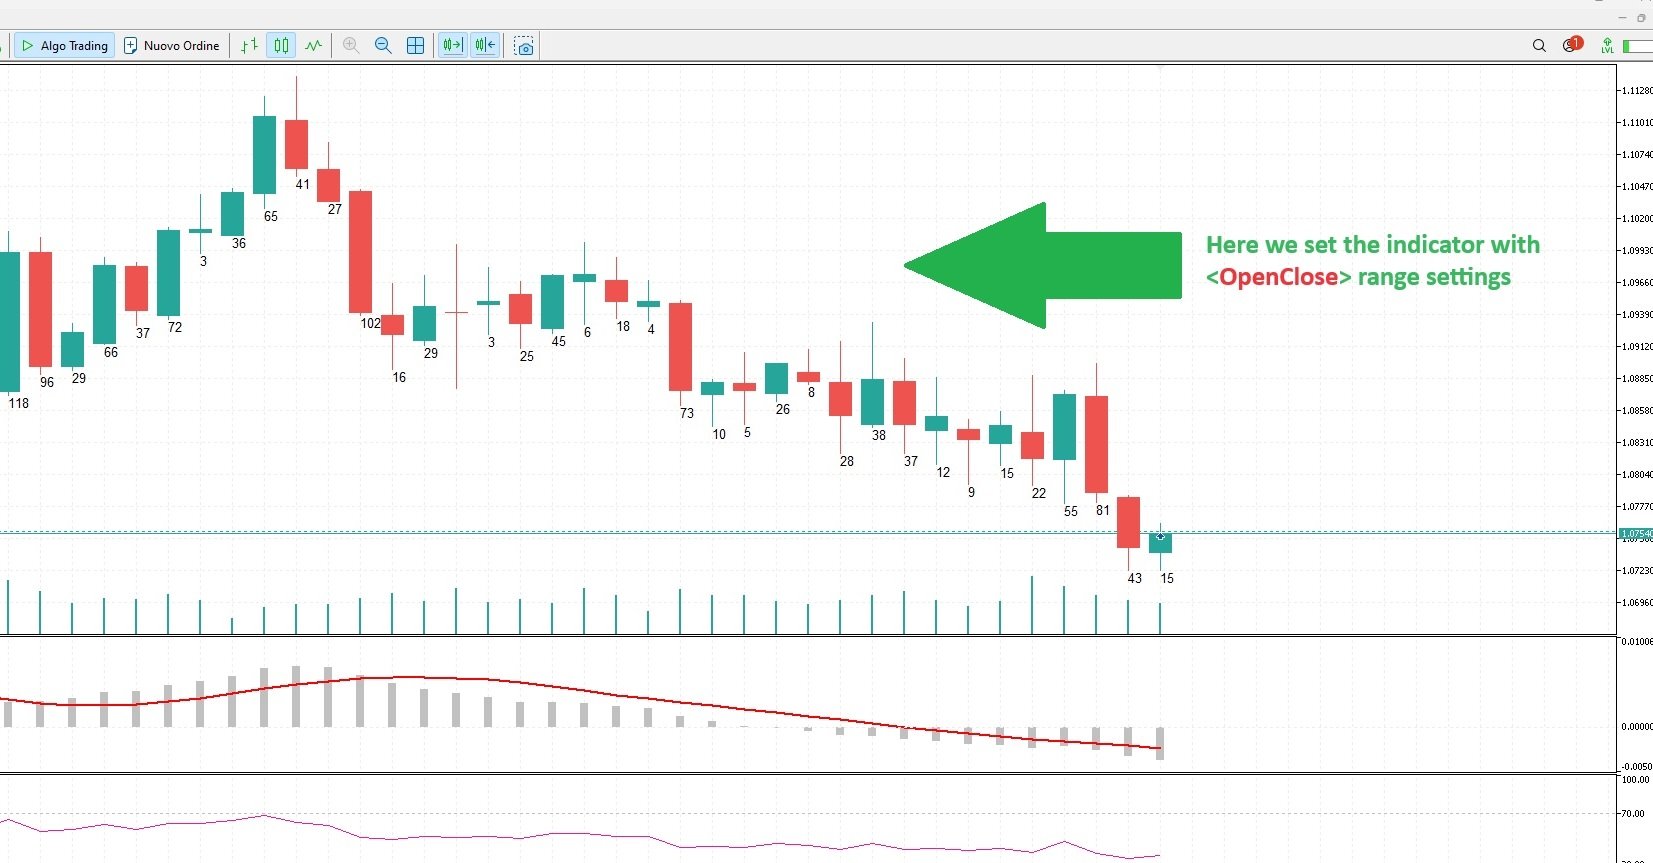
  • With "OpenClose" you count the pips present between the opening and closing price of the candle. The number is shown under each candlestick on the chart.
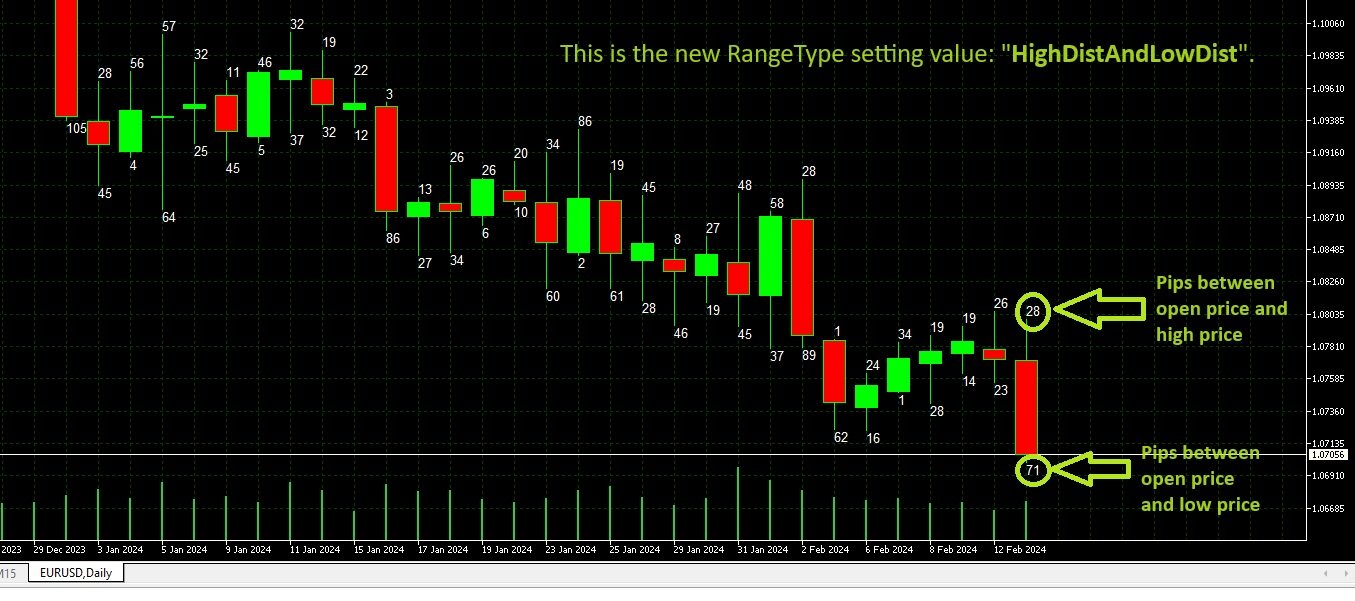
  • With "HighDistAndLowDist" two things are counted:
                    • the number of pips between the opening price and the high. The number is shown above each candlestick on the chart.
                    • the number of pips between the opening price and the low. The number is shown under each candlestick on the chart.

Feature Highlights

  • Size, Color and Font are configurable.
  • Optimized to reduce CPU usage.
  • "Pips On Candle" works on all assets and timeframes.

Input Parameters

  • FontColor --> Default is BlackFontSize --> Default is 10
  • FontType --> Default is Arial
  • MinLength --> Default is 2 . This parameter indicates the minimum number of Pips that must be counted on a candle in order to show them on the chart. For example if set to 10, all candles on which less than 10 pips are counted will not show the number under the candle.
  • RangeType--> Default is HighLow . This parameter determines how to count pips:
              • If set with "HighLow", the pips present between the maximum price and the minimum price of the candle are counted.
              • If set with "OpenClose", the pips present between the opening and closing price are counted
              • If set with "HighDistAndLowDist" it counts both the pips between the opening price and the high and the pips between the opening price and the low.

If you still have any questions, please do not hesitate to contact me: https://www.mql5.com/en/users/alastor87 

Productos recomendados
Fibonacci and RSI Demo version MQL5
Carlos Daniel Vazquez Rosas
4 (1)
Fibonacci and RSI. Demo versión only works with GBPUSD. For full version, please, visit visit https://www.mql5.com/en/market/product/52101 The indicator is a combination of the Fibonacci and RSI indicators. Every time the price touches one of the fibonacci levels and the rsi condition is met, an audible alert and a text alert are generated. Parameters number_of_candles : It is the number of candles that will be calculated. If you put 100, the indicator will give you the maximum and min
FREE
The problem with trading candlestick patterns becomes obvious, after some experience in live markets. Hypothetical branching of candlestick patterns, are not necessary for successful trading. As a Price action trader, my principle is to keep things simple and consistent. My focus is on buying and selling pressure, which is visible in market structure. Trade Management and discipline are my secondary core elements. This indicator detect 4 Simple but Effective Price action Patterns! Yellow = Insi
Fibrillar
Vitalii Zakharuk
It is very easy to use the Fibrillar indicator, since the simplest is to look at the chart and act according to the indications of the colored arrows. The algorithm takes into account the measurement of prices, and this method also focuses on measuring each of the price drops (H / C, H / O, LC, LO) - which gives more detailed information, but also more averaged. When calculating this indicator, logarithmic gains are first calculated at the closing price, which allows you to filter out the tre
Fractal Channel Breakout MT5
KEENBASE SOFTWARE SOLUTIONS
KT Fractal Channel Breakout draws a continuous channel by connecting the successive Up and Down fractals. It provides alerts and also plots the Up and Down arrows representing the bullish and bearish breakout of the fractal channel. Features If you use Bill Williams fractals in your technical analysis, you must also include it in your trading arsenal. It can be very effective and useful for stop-loss trailing. A new market trend often emerges after a fractal channel breakout in a new directi
The megaphone pattern is another chart pattern used for technical analysis. There is usually a lot of volatility happening when you spot it in the wild….and volatility equals opportunity in the world of trading. This pattern is famous for its “broadening formation” and the price action also warns of the increased risk ahead. The megaphone chart pattern provides unique entries and exits off different sides of its structure. [ Installation Guide | Update Guide | Troubleshooting | FAQ | All Pro
KT COG Advanced MT5
KEENBASE SOFTWARE SOLUTIONS
KT COG is an advanced implementation of the center of gravity indicator presented by John F. Ehlers in the May 2002 edition of Technical Analysis of Stocks & Commodities magazine. It's a leading indicator which can be used to identify the potential reversal points with the minimum lag. The COG oscillator catches the price swings quite effectively. MT4 version of the same indicator is available here KT COG Advanced MT4 Calculation of COG The COG indicator is consist of the two lines. The mai
Este indicador de múltiples marcos de tiempo y múltiples símbolos identifica patrones de ruptura de alta probabilidad. Lo hace identificando banderines y triángulos fuertes y simétricos. Este patrón       NO   aparece muy a menudo en períodos de tiempo más altos. Pero cuando lo hace, es una configuración de muy alta probabilidad. El indicador también incluye un escáner de barras interiores. Por ejemplo, puede usarse para detectar un tipo especial de formación de barras internas que está formada
Binary Absorption
Bogdan Kupinsky
5 (1)
Бинарный индикатор находит свечной паттерн "Поглощение" и рисует соответствующий сигнал для входа рынок. Имеет встроенные фильтры и панель для просчета количества успешных сделок. Особенности Работает для всех валютных пар и любых таймфреймов. Индикатор рассматривает комбинацию из 2-х или 3-х свечей в зависимости от настроек. Имеется возможность фильтровать сигналы путем настройки количества свечей одного цвета (тренда) до образования паттерна. Присутствует панель для отображения точности
Higher High Lower Low MT5
KEENBASE SOFTWARE SOLUTIONS
KT Higher High Lower Low marks the following swing points with their respective S/R levels: Higher High: The swing high made by the price that is higher than the previous high. Lower High: The swing high made by the price that is lower than the previous high. Lower Low: The swing low made by the price that is lower than the previous low.  Higher Low: The swing low made by the price that is higher than the previous low.   Features The intensity of swing high and swing low can be adjusted by cha
Candlestick Pattern Teller
Flavio Javier Jarabeck
5 (1)
Minions Labs' Candlestick Pattern Teller It shows on your chart the names of the famous Candlesticks Patterns formations as soon as they are created and confirmed. No repainting. That way beginners and also professional traders who have difficulties in visually identifying candlestick patterns will have their analysis in a much easier format. Did you know that in general there are 3 types of individuals: Visual, Auditory, and Kinesthetic? Don't be ashamed if you cannot easily recognize Candlest
Zigzag Oscillador
Ignacio Agustin Mene Franco
Zigzag Oscillador .  es un indicador programado para cazar cada punto del zigzag de la vela ! como en primer plano de zigzag este oscilador lo lleva a simples medidas ,  para captar cada rebote del piso al techo !  ideal para hacer scalping y intradiario .  sirve para cualquier temporalidad ! para todos los pares de forex ! para todos los pares de indices sinteticos ideal para los volatility 75 y demas jumps !  Buen Profit ! World Inversor . 
Tops and Bottoms Indicator
Josue De Matos Silva
4.8 (5)
Tops & Bottoms Indicator FREE   Tops abd Bottoms:   An effective indicator for your trades The tops and bottoms indicator helps you to find  ascending and descending channel formations with indications of ascending and/or descending tops and bottoms. In addition, it  show possibles  opportunities with a small yellow circle when the indicator encounters an impulse formation. This indicator provide to you  more security and speed in making entry decisions. Also test our FREE advisor indicator:
FREE
Trend Side - un indicador técnico para determinar la tendencia. Es un conjunto de varias estrategias comerciales completas. El indicador utiliza un sistema avanzado de filtrado de tendencias, tiene un panel estadístico, calcula los niveles de entrada y salida, y calcula el nivel de Trailing Stop dinámico. Apto para cualquier tipo de símbolos, nunca redibuja sus señales y resultados. Una herramienta integral para el comercio de tendencias profesional. El conjunto del indicador Trend Side tambi
The   Three Inside Up   candlestick pattern is formed by three candles. Here’s how to identify the Three Inside Up candlestick pattern: The first candle must be bearish The second candle must be bullish The close of the second candle should ideally be above the 50% level of the body of the first one The third candle should close above the first one This 3-candle bullish candlestick pattern is a reversal pattern, meaning that it’s used to find bottoms. For this reason, we want to see this patter
KT Inside Bar MT5
KEENBASE SOFTWARE SOLUTIONS
KT Inside Bar plots the famous inside bar pattern in which the bar carries a lower high and higher low compared to the previous bar. The last bar is also known as the mother bar. On smaller time-frames, the inside bar sometimes appears similar to a triangle pattern. Features Also plots entry, stop-loss, and take-profit levels with the inside bar pattern. No complex inputs and settings. Erase unwanted levels when the price reaches the entry line in either direction. All Metatrader alerts incl
Liquidity Oscillator
Paolo Scopazzo
5 (1)
A powerful oscillator that provide Buy and Sell signals by calculating the investor liquidity. The more liquidity the more buy possibilities. The less liquidity the more sell possibilities. Please download the demo and run a backtest! HOW IT WORKS: The oscillator will put buy and sell arrow on the chart in runtime only . Top value is 95 to 100 -> Investors are ready to buy and you should follow. Bottom value is 5 to 0 -> Investors are ready to sell and you should follow. Alert + sound will app
This is the famous Sunflower indicator for Metatrader5. This indicator marks possible tops and bottoms on price charts. The indicator identifies tops and bottoms in the asset's price history, keep in mind that the current sunflower of the last candle repaints, as it is not possible to identify a top until the market reverses and it is also not possible to identify a bottom without the market stop falling and start rising. If you are looking for a professional programmer for Metatrader5, please
Engulfing Candlestick Bulkowski The engulfing candlestick is a well-known candle pattern composed of two candles. This indicator for showing engulfing candlestick that describe by Thomas Bulkowski. If you need for MetaTrader 4 version, please visit here: https://www.mql5.com/en/market/product/34193 Feature Highlights Show bullish engulfing and bearish engulfing. Customizable "Up Symbol". Customizable "Down Symbol". Customizable symbol distance from candlestick. Customizable "Down Color". Cus
DYJ Super Trend Wave es un sistema de negociación de picos y valles altamente preciso. Este indicador busca los puntos más altos y más bajos de la línea de velas al entrar y salir del mercado. El precio de entrada está cerca del punto más alto o más bajo. El tipo de notificación de la señal se ha agregado a dyj supertrend. Cuando se genera una señal multi-espacial, Se pueden utilizar los siguientes tipos de señales de notificación: Alert mailSend, MobilePush. Input InpSignalPeriod = 10 Ba
"Pattern 123" is an indicator-a trading system built on a popular pattern, pattern 123. This is the moment when we expect a reversal on the older trend and enter the continuation of the small trend, its 3rd impulse. The indicator displays signals and markings on an open chart. You can enable/disable graphical constructions in the settings. The indicator has a built-in notification system   (email, mobile terminal, standard terminal alert). "Pattern 123" has a table that displays signals fr
This indicator plots in the candles the divergence found in the selected indicator and can also send a notification by email and / or to the cell phone. Works on all TIMEFRAMES. Meet Our Products   He identifies the divergences in the indicators: Relative Strength Index (RSI); Moving Average Convergence and Divergence (MACD); Volume Balance (OBV) and;. iStochastic Stochastic Oscillator  (STOCHASTIC). It is possible to choose the amplitude for checking the divergence and the indicator has
Volume Zone Fractal
Eduardo Da Costa Custodio Santos
VZO Plus es un indicador que muestra las regiones de sobrecompra y sobreventa en función del volumen negociado. # Cuando la línea del indicador está entre -40 y -60 está sobrevendida #Cuando la línea del indicador está entre 40 y 60, hay sobrecompra. Fuera de estas regiones, el mercado sigue su camino natural por inercia. Por encima de la línea verde, significa que el mercado es positivo, Otra forma de analizar el indicador es a través de regiones de divergencia. Cuando tenemos la parte inferior
FRB Candle Time
Fernando Baratieri
FRB Candle Time  Indicator showing the time left for the next candle You can edit font color and size. Very important indicator for Traders. To move time, just click on it and move the mouse to where you want to leave it. After positioning the time where you want it, click again or press "ESC" and the time will stay where you left it. Settings font color Font size Background color
Basing Candles
Abdelkhabir Yassine Alaoui
Basing Candles indicator is an automatic indicator that detects and marks basing candles on the chart. A basing candle is a candle with body length less than 50% of its high-low range. A basing candle or basing candlestick is a trading indicator whose body length is less than half of its range between the highs and lows. That's less than 50% of its range. The indicator highlights the basing candles using custom candles directly in the main chart of the platform. The percentage criterion can be
FREE
True Day
Aurthur Musendame
5 (1)
True Days is a tool designed specifically for the trader who wants to catch intraday volatility in price charts.  True day makes it easier for the trader to avoid trading in the dead zone - a period in time where markets are considered dead or non volatile. The trader can concentrate on finding opportunities only during periods of profound market movements. By default the indicator gives you a true day starting at 02:00 to 19:00 hours GMT+2. You can adjust according to your Time Zone. By deafult
FREE
ACB Breakout Arrows MT5
KEENBASE SOFTWARE SOLUTIONS
5 (1)
The ACB Breakout Arrows indicator provides a crucial entry signal in the market by detecting a special breakout pattern. The indicator constantly scans the chart for a settling momentum in one direction and provide the accurate entry signal right before the major move. Get multi-symbol and multi-timeframe scanner from here - Scanner for ACB Breakout Arrows MT 5 Key features Stoploss   and Take Profit levels are provided by the indicator. Comes with a MTF Scanner dashboard which tracks the br
QuantumAlert Stoch Navigator is a free indicator available for MT4/MT5 platforms, its work is to provide "alerts" when the market is inside "overbought and oversold" regions in the form of "buy or sell" signals. This indicator comes with many customization options mentioned in the parameter section below, user can customise these parameters as needful. Join our   MQL5 group , where we share important news and updates. You are also welcome to join our private channel as well, contact me for the p
FREE
KT Horizontal Lines MT5
KEENBASE SOFTWARE SOLUTIONS
In MetaTrader, plotting multiple   horizontal lines   and then tracking their respective price levels can be a hassle. This indicator automatically plots multiple horizontal lines at equal intervals for setting price alerts, plotting support and resistance levels, and other manual purposes. This indicator is suitable for Forex traders who are new and looking for chances to make quick profits from buying and selling. Horizontal lines can help traders find possible areas to start trading when the
Este es el índice direccional medio personalizado de Gekko (ADX), una versión personalizada del famoso indicador ADX. Use el ADX regular y aproveche tres cálculos de señales de entrada y diferentes formas de recibir alertas cada vez que haya un posible punto de entrada o salida. Entradas Period: Periodo para el cálculo del ADX; PlotSignalType: Cómo el indicador calculará las señales de entrada (oscilación): 1- ShowSwingsOnTrendLevel : Mostrar señales para los cambios de confirmación de tendenc
WanaScalper
Isaac Wanasolo
1 (1)
A scalping indicator based on mathematical patterns, which on average gives signals with relatively small SL, and also occasionally helps to catch big moves in the markets (more information in the video) This indicator has three main types of notifications: The first type warns of a possible/upcoming signal on the next bar The second type indicates the presence of a ready signal to enter the market/open a position The third type is for SL and TP levels - you will be notified every time price r
Los compradores de este producto también adquieren
Primero que todo, vale la pena enfatizar que este Sistema de Trading es un Indicador No Repintado, No Redibujado y No Retrasado, lo que lo hace ideal tanto para el trading manual como para el automatizado. El "Sistema de Trading Inteligente MT5" es una solución completa de trading diseñada para traders nuevos y experimentados. Combina más de 10 indicadores premium y presenta más de 7 estrategias de trading robustas, lo que lo convierte en una opción versátil para diversas condiciones del merca
Atomic Analyst MT5
Issam Kassas
4.82 (11)
En primer lugar, vale la pena enfatizar que este Indicador de Trading no repinta, no redibuja y no se retrasa, lo que lo hace ideal tanto para el trading manual como para el automatizado. El Analista Atómico es un Indicador de Acción del Precio PA que utiliza la fuerza y el impulso del precio para encontrar una mejor ventaja en el mercado. Equipado con filtros avanzados que ayudan a eliminar ruidos y señales falsas, y aumentan el potencial de trading. Utilizando múltiples capas de indicadores
FX Volume MT5
Daniel Stein
4.94 (17)
Obtenga su actualización diaria del mercado con detalles y capturas de pantalla a través de nuestro Morning Briefing aquí en mql5 y en Telegram ! FX Volume es el PRIMER y ÚNICO indicador de volumen que proporciona una visión REAL del sentimiento del mercado desde el punto de vista de un bróker. Proporciona una visión impresionante de cómo los participantes institucionales del mercado, como los brokers, están posicionados en el mercado Forex, mucho más rápido que los informes COT. Ver esta info
Quantum Trend Sniper
Bogdan Ion Puscasu
5 (37)
Introduciendo       Indicador Quantum Trend Sniper   , el innovador indicador MQL5 que está transformando la forma en que identificas y negocias los cambios de tendencia. Desarrollado por un equipo de comerciantes experimentados con experiencia comercial de más de 13 años,       Indicador de francotirador de tendencia cuántica       está diseñado para impulsar su viaje comercial a nuevas alturas con su forma innovadora de identificar cambios de tendencia con una precisión extremadamente alta.
Gold Stuff mt5
Vasiliy Strukov
4.89 (166)
Gold Stuff mt5: un indicador de tendencia diseñado específicamente para el oro, también se puede usar en cualquier instrumento financiero. El indicador no se vuelve a dibujar ni se retrasa. El marco de tiempo recomendado es H1. IMPORTANTE! Póngase en contacto conmigo inmediatamente después de la compra para obtener instrucciones y bonificación! PARÁMETROS Draw Arrow-incl.desactivado. dibujar flechas en el gráfico. Alerts-incl.desactivado.alertas de sonido. E-mail notification-incl.desacti
Trend Screener Pro MT5
STE S.S.COMPANY
4.89 (61)
Desbloquee el poder del comercio de tendencias con el indicador Trend Screener: ¡su solución definitiva para el comercio de tendencias impulsada por lógica difusa y un sistema multidivisa!Mejore su comercio de tendencias con Trend Screener, el revolucionario indicador de tendencias impulsado por lógica difusa. Es un poderoso indicador de seguimiento de tendencias que combina más de 13 herramientas y funciones premium y 3 estrategias comerciales, lo que lo convierte en una opción versátil para co
RelicusRoad Pro MT5
Relicus LLC
4.82 (22)
Ahora $ 147 (aumentando a $ 499 después de algunas actualizaciones) - Cuentas ilimitadas (PC o Mac) Manual de usuario de RelicusRoad + Videos de capacitación + Acceso al grupo privado de Discord + Estado VIP UNA NUEVA MANERA DE VER EL MERCADO RelicusRoad es el indicador comercial más poderoso del mundo para divisas, futuros, criptomonedas, acciones e índices, y brinda a los comerciantes toda la información y las herramientas que necesitan para mantenerse rentables. Brindamos análisis téc
Ante todo, vale la pena enfatizar que esta Herramienta de Trading es un Indicador No Repintado, No Redibujado y No Retrasado, lo que la hace ideal para el trading profesional. El Indicador de Conceptos de Acción del Precio Inteligente es una herramienta muy potente tanto para traders nuevos como experimentados. Combina más de 20 indicadores útiles en uno solo, combinando ideas avanzadas de trading como el Análisis del Trader del Círculo Interior y Estrategias de Trading de Conceptos de Dinero
Este es un genial indicador para MT5 que ofrece señales precisas para entrar en una transacción sin redibujar. Se puede aplicar a cualquier activo financiero: fórex, criptomonedas, metales, acciones, índices. Nos dará valoraciones bastante precisas y nos dirá cuándo es mejor abrir y cerra una transacción. Eche un vistazo  al vídeo  (6:22), ¡contiene un ejemplo de procesamiento de una sola señal que ha amortizado el indicador! La mayoría de los tráders mejoran sus resultados comerciales durante l
FX Power MT5 NG
Daniel Stein
5 (4)
Obtenga su actualización diaria del mercado con detalles y capturas de pantalla a través de nuestro Morning Briefing aquí en mql5 y en Telegram ! FX Power MT5 NG es la nueva generación de nuestro popular medidor de fuerza de divisas, FX Power. ¿Y qué ofrece este medidor de fuerza de nueva generación? Todo lo que le encantaba del FX Power original PLUS Análisis de fuerza de ORO/XAU Resultados de cálculo aún más precisos Períodos de análisis configurables individualmente Límite de cálculo persona
Advanced Supply Demand MT5
Bernhard Schweigert
4.53 (15)
¡Actualmente con 33% de descuento! ¡La mejor solución para cualquier tráder principiante o experto! Este indicador es una herramienta comercial única, de alta calidad y asequible, porque incorpora una serie de características patentadas y una nueva fórmula. Con esta actualización, podrá mostrar zonas de doble marco temporal. No solo podrá mostrar un marco temporal más alto, sino también mostrar ambos, el marco temporal del gráfico MÁS el marco temporal más alto: MOSTRANDO ZONAS ANIDADAS. A todos
Auto Order Block with break of structure based on ICT and Smart Money Concepts Futures Break of Structure ( BoS )             Order block ( OB )            Higher time frame Order block / Point of Interest ( POI )    shown on current chart           Fair value Gap ( FVG ) / Imbalance   ,  MTF      ( Multi Time Frame )    Volume Imbalance     ,  MTF          vIMB Gap’s Equal High / Low’s     ,  MTF             EQH / EQL Liquidity               Current Day High / Low           HOD /
XQ Indicator MetaTrader 5
Marzena Maria Szmit
5 (1)
Step into the realm of Forex trading with confidence and precision using XQ, a cutting-edge Forex indicator designed to elevate your trading game to unprecedented heights. Whether you're a seasoned trader or just stepping into the world of currency exchange, XQ Forex Indicator empowers you with the insights and signals needed to make informed trading decisions. The signal conditions are a combination of three indicators, and XQ Forex Indicator only display  medium and long-term trends . The ind
ICT, SMC, SMART MONEY CONCEPTS, SMART MONEY, Smart Money Concept, Support and Resistance, Trend Analysis, Price Action, Market Structure, Order Blocks, BOS/CHoCH,   Breaker Blocks ,  Momentum Shift,   Supply&Demand Zone/Order Blocks , Strong Imbalance,   HH/LL/HL/LH,    Fair Value Gap, FVG,  Premium  &   Discount   Zones, Fibonacci Retracement, OTE, Buy Side Liquidity, Sell Side Liquidity, BSL/SSL Taken, Equal Highs & Lows, MTF Dashboard, Multiple Time Frame, BigBar, HTF OB, HTF Market Structure
Blahtech Supply Demand MT5
Blahtech Limited
4.57 (14)
Was: $299  Now: $99   Supply Demand uses previous price action to identify potential imbalances between buyers and sellers. The key is to identify the better odds zones, not just the untouched ones. Blahtech Supply Demand indicator delivers functionality previously unavailable on any trading platform. This 4-in-1 indicator not only highlights the higher probability zones using a multi-criteria strength engine, but also combines it with multi-timeframe trend analysis, previously confirmed swings
Conviértase en un Breaker Trader y obtenga beneficios de los cambios en la estructura del mercado a medida que se invierte el precio. El indicador de ruptura de bloque de órdenes identifica cuándo una tendencia o movimiento de precio se acerca al agotamiento y está listo para revertirse. Le alerta sobre cambios en la estructura del mercado que generalmente ocurren cuando una reversión o un retroceso importante están a punto de suceder. El indicador utiliza un cálculo patentado que identific
El Indicador de Cuadrados de Gann es una herramienta poderosa de análisis de mercado basada en el artículo "Fórmula Matemática para Predicciones de Mercado" escrito por W.D. Gann, que se basa en conceptos matemáticos para el análisis. Incorpora elementos de las técnicas de Gann relacionadas con los cuadrados de 144, 90 y 52, así como el cuadrado de 9. Además, incluye el método del  sobre cómo combinar el cuadrado de 9 con canales y patrones de estrellas. Manual del Usuario y Modo de Uso: Antes d
AW Trend Predictor MT5
AW Trading Software Limited
4.76 (54)
La combinación de niveles de tendencia y ruptura en un sistema. Un algoritmo de indicador avanzado filtra el ruido del mercado, determina la tendencia, los puntos de entrada y los posibles niveles de salida. Las señales indicadoras se registran en un módulo estadístico, que le permite seleccionar las herramientas más adecuadas, mostrando la efectividad del historial de señales. El indicador calcula las marcas Take Profit y Stop Loss. Manual e instrucciones ->   AQUÍ   / Versión MT4 ->   AQUÍ Có
The Volume by Price Indicator for MetaTrader 5 features Volume Profile and Market Profile TPO (Time Price Opportunity). Get valuable insights out of currencies, equities and commodities data. Gain an edge trading financial markets. Volume and TPO histogram bar and line charts. Volume Footprint charts. TPO letter and block marker charts including split structures. Versatile segmentation and compositing methods. Static, dynamic and flexible ranges with relative and/or absolute visualizations. Lay
TrendLine PRO MT5
Evgenii Aksenov
4.78 (49)
El indicador Trend Line PRO es una estrategia comercial independiente. Muestra el cambio de tendencia, el punto de entrada a la transacción, así como calcula automáticamente tres niveles de Take Profit y la protección contra la pérdida de Stop Loss Trend Line PRO es perfecto para todos los símbolos de Meta Trader: monedas, metales, criptomonedas, acciones e índices Ventajas de Trend Line PRO: Nunca vuelve a dibujar sus señales Posibilidad de utilizar como estrategia independiente Tiene tres niv
MetaBands M5
Vahidreza Heidar Gholami
4.67 (3)
MetaBands utiliza algoritmos potentes y únicos para dibujar canales y detectar tendencias para que pueda proporcionar a los traders puntos potenciales para entrar y salir de operaciones. Es un indicador de canal junto con un potente indicador de tendencia. Incluye diferentes tipos de canales que se pueden fusionar para crear nuevos canales simplemente utilizando los parámetros de entrada. MetaBands utiliza todos los tipos de alertas para notificar a los usuarios sobre eventos del mercado. Caract
Introduciendo       Quantum Breakout PRO   , el innovador indicador MQL5 que está transformando la forma en que comercia con Breakout Zones. Desarrollado por un equipo de comerciantes experimentados con experiencia comercial de más de 13 años,       Desglose cuántico PRO       está diseñado para impulsar su viaje comercial a nuevas alturas con su innovadora y dinámica estrategia de zona de ruptura. El indicador de ruptura cuántica le dará flechas de señal en las zonas de ruptura con 5 zonas
Owl Smart Levels MT5
Sergey Ermolov
4.47 (36)
Versión MT4  |  FAQ El Indicador Owl Smart Levels es un sistema comercial completo dentro de un indicador que incluye herramientas de análisis de mercado tan populares como los fractales avanzados de Bill Williams , Valable ZigZag que construye la estructura de onda correcta del mercado y los niveles de Fibonacci que marcan los niveles exactos de entrada. en el mercado y lugares para tomar ganancias. Descripción detallada de la estrategia Instrucciones para trabajar con el indicador Asesor de c
Gartley Hunter Multi
Siarhei Vashchylka
5 (5)
Gartley Hunter Multi - An indicator for searching for harmonic patterns simultaneously on dozens of trading instruments and on all classic timeframes: (m1, m5, m15, m30, H1, H4, D1, Wk, Mn). Manual (Be sure to read before purchasing) | Version for MT4 Advantages 1. Patterns: Gartley, Butterfly, Shark, Crab. Bat, Alternate Bat, Deep Crab, Cypher 2. Simultaneous search for patterns on dozens of trading instruments and on all classic timeframes 3. Search for patterns of all possible sizes. Fr
Trend Line Map Pro MT5
STE S.S.COMPANY
4.67 (9)
El indicador Trend Line Map es un complemento para Trend Screener Indicator. Funciona como un escáner para todas las señales generadas por el evaluador de tendencias (Trend Line Signals). Es un escáner de líneas de tendencia basado en el indicador de evaluación de tendencias. Si no tiene el indicador Trend Screener Pro, Trend Line Map Pro no funcionará. It's a Trend Line Scanner based on Trend Screener Indicator. If you don't have Trend Screener Pro Indicator,     the Trend Line Map Pro will
TrendDecoder Premium MT5
Christophe, Pa Trouillas
5 (1)
Identifique los rangos y los próximos movimientos probables  |  Obtenga las señales más tempranas y la fuerza de las Tendencias   |  Obtener salidas claras antes de reversión   |  Detecte los niveles de Fibo que el precio pondrá a prueba   |  Indicador no repintado y no retardado - ideal para la trading manual y automatizada - adecuado para todos los activos y todas las unidades temporales 69$   para el lanzamiento - luego de nuevo a >>   $ 149 Después de la compra,   póngase en contacto con mi
TPSpro TRENDPRO  - is a trend indicator that automatically analyzes the market and provides information about the trend and each of its changes, as well as giving signals for entering trades without redrawing! The indicator uses each candle, analyzing them separately. referring to different impulses - up or down impulse. Exact entry points into transactions for currencies, crypto, metals, stocks, indices!  -  Version MT4                  DETAILED DESCRIPTION        /       TRADING SETUPS       
Was: $249  Now: $99   Market Profile defines a number of day types that can help the trader to determine market behaviour. A key feature is the Value Area, representing the range of price action where 70% of trading took place. Understanding the Value Area can give traders valuable insight into market direction and establish the higher odds trade. It is an excellent addition to any system you may be using. Inspired by Jim Dalton’s book “Mind Over Markets”, this indicator is designed to suit the
Golden Spikes Detector
Batsirayi L Marango
5 (1)
Golden Spikes Detector Este indicador se basa en una estrategia avanzada principalmente para negociar picos en índices de auge y caída. Se implementaron algoritmos complejos para detectar únicamente entradas de alta probabilidad. Alerta sobre posibles entradas de Compra y Venta. Para negociar picos en el corredor Deriv o Binary, solo acepte las alertas Buy Boom y Sell Cash. Se optimizó para cargarse en un período de tiempo de 5 minutos, aunque se realiza un análisis de múltiples períodos de tiem
Matrix Arrow Indicator MT5
Juvenille Emperor Limited
5 (14)
Matrix Arrow Indicator MT5   es una tendencia única 10 en 1 que sigue un indicador   100% sin repintado   de marcos temporales múltiples que se puede usar en todos los símbolos/instrumentos:   divisas ,   materias primas ,   criptomonedas ,   índices ,   acciones .  Matrix Arrow Indicator MT5  determinará la tendencia actual en sus primeras etapas, recopilando información y datos de hasta 10 indicadores estándar, que son: Índice de movimiento direccional promedio (ADX) Índice de canales de prod
Filtro:
No hay comentarios
Respuesta al comentario
Versión 1.1 2024.02.13
Pips on Candles shows the number of pips contained in each candle on the chart. The new 1.1 versione introduced a new feature that can be configured via the RangeType parameter.

+New input value:

RangeType --> This parameter determines how to count pips on candles. There are now 3 possible values ​​to set:

- "HighLow" --> display the pips present between the maximum price and the minimum price of the candle. Already present in the previous version.
- "OpenClose" --> display the pips present between the opening and closing price. Already present in the previous version.
- "HighDistAndLowDist" --> this is the new Feature of this new version. The feature is described below:

+New feature "HighDistAndLowDist" RangeType:

The new feature display on each candle 2 number:

+ Number above the candle display the number of pips between the opening price and the high
+ Number below the candle display the number of pips between the opening price and the low

Please remember that "Pips On Candle" works for every asset and on every timeframes.