ICT Market Structure
- Indicadores
- Yong Jie Su
- Versión: 1.0
- Activaciones: 10
Si estás buscando un indicador confiable para operar con el concepto ICT, la Estructura de Mercado ICT proporciona un manual de usuario para los traders que utilizan estrategias más avanzadas.
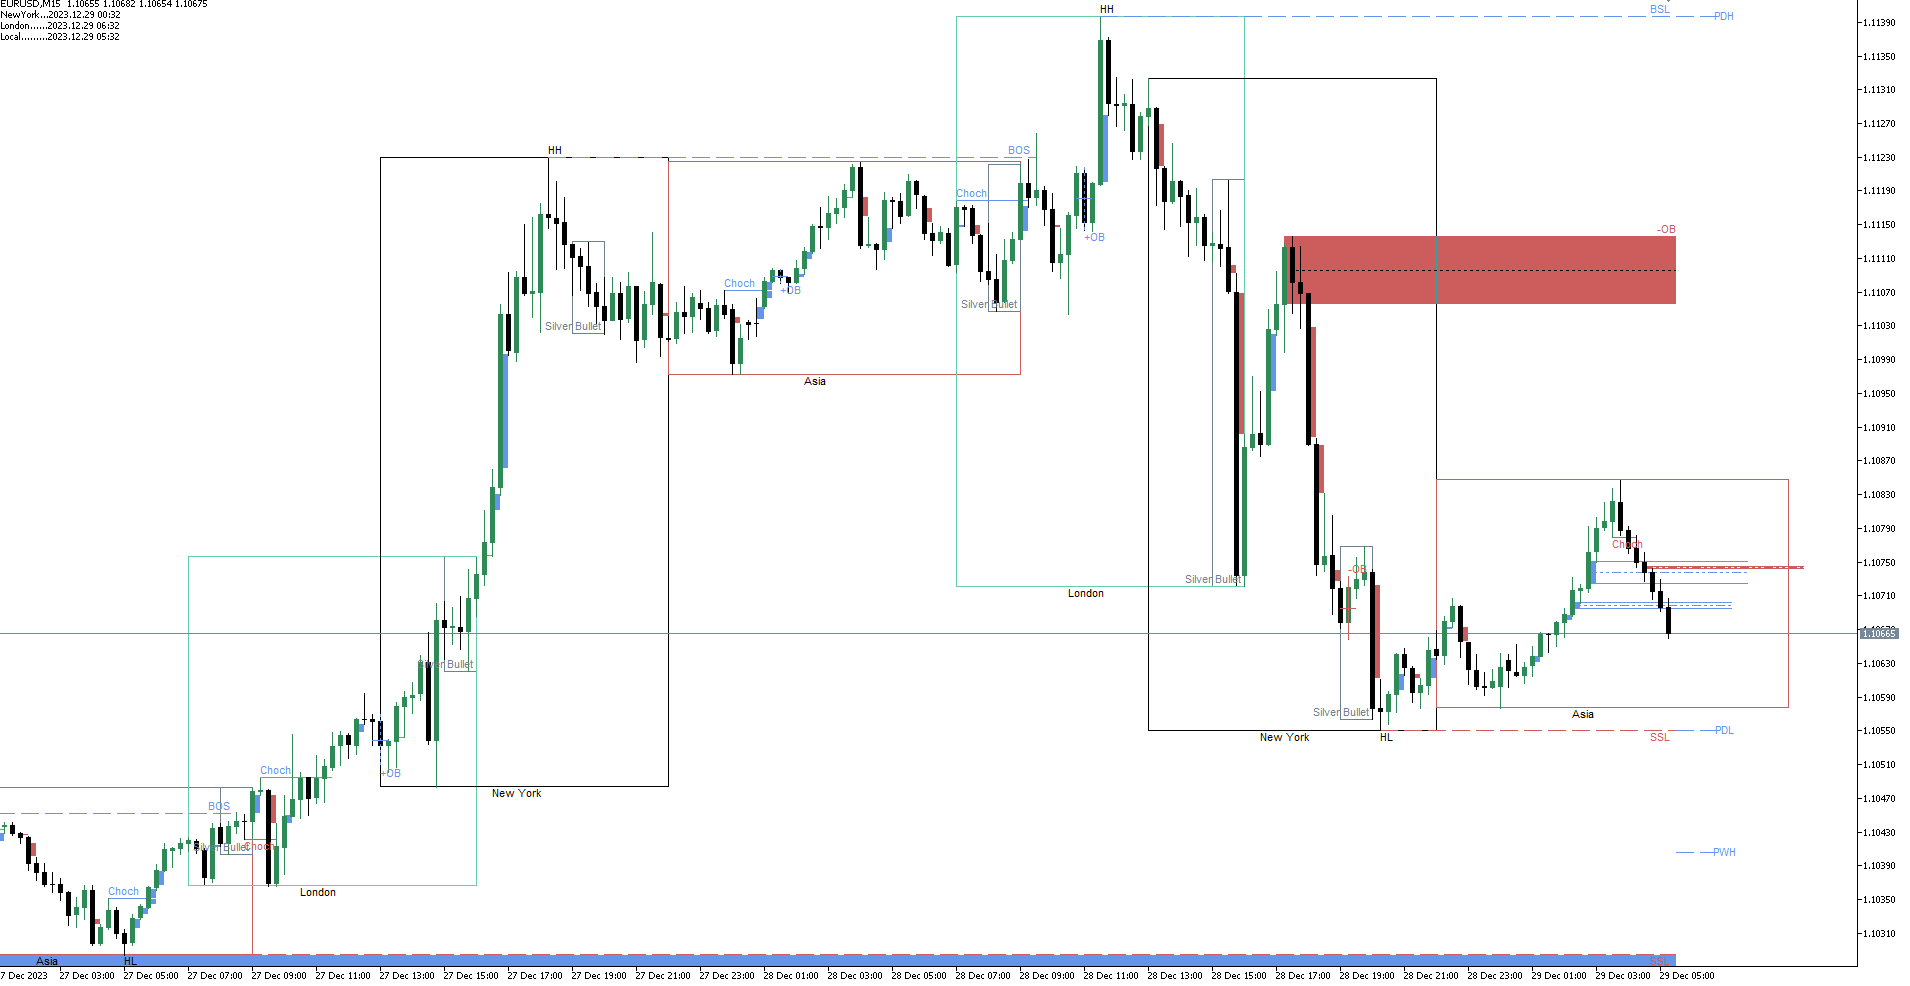
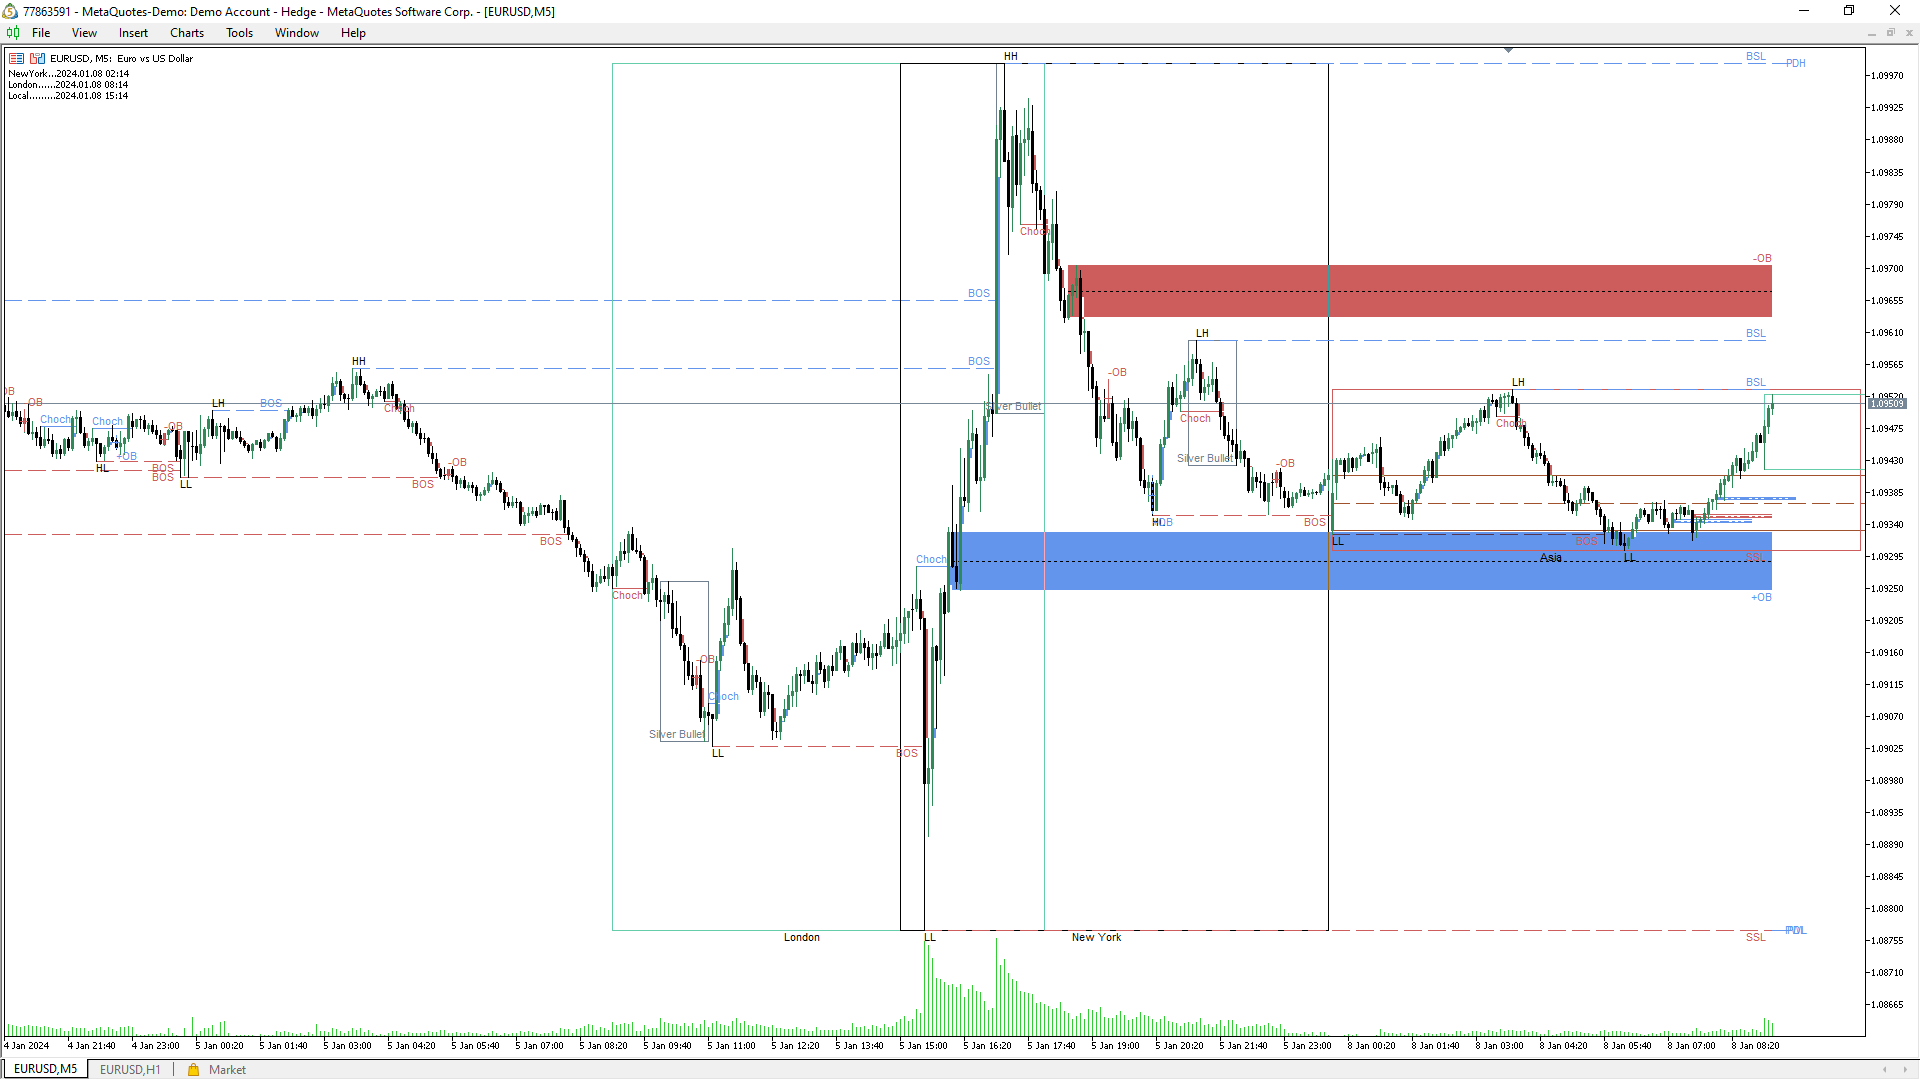
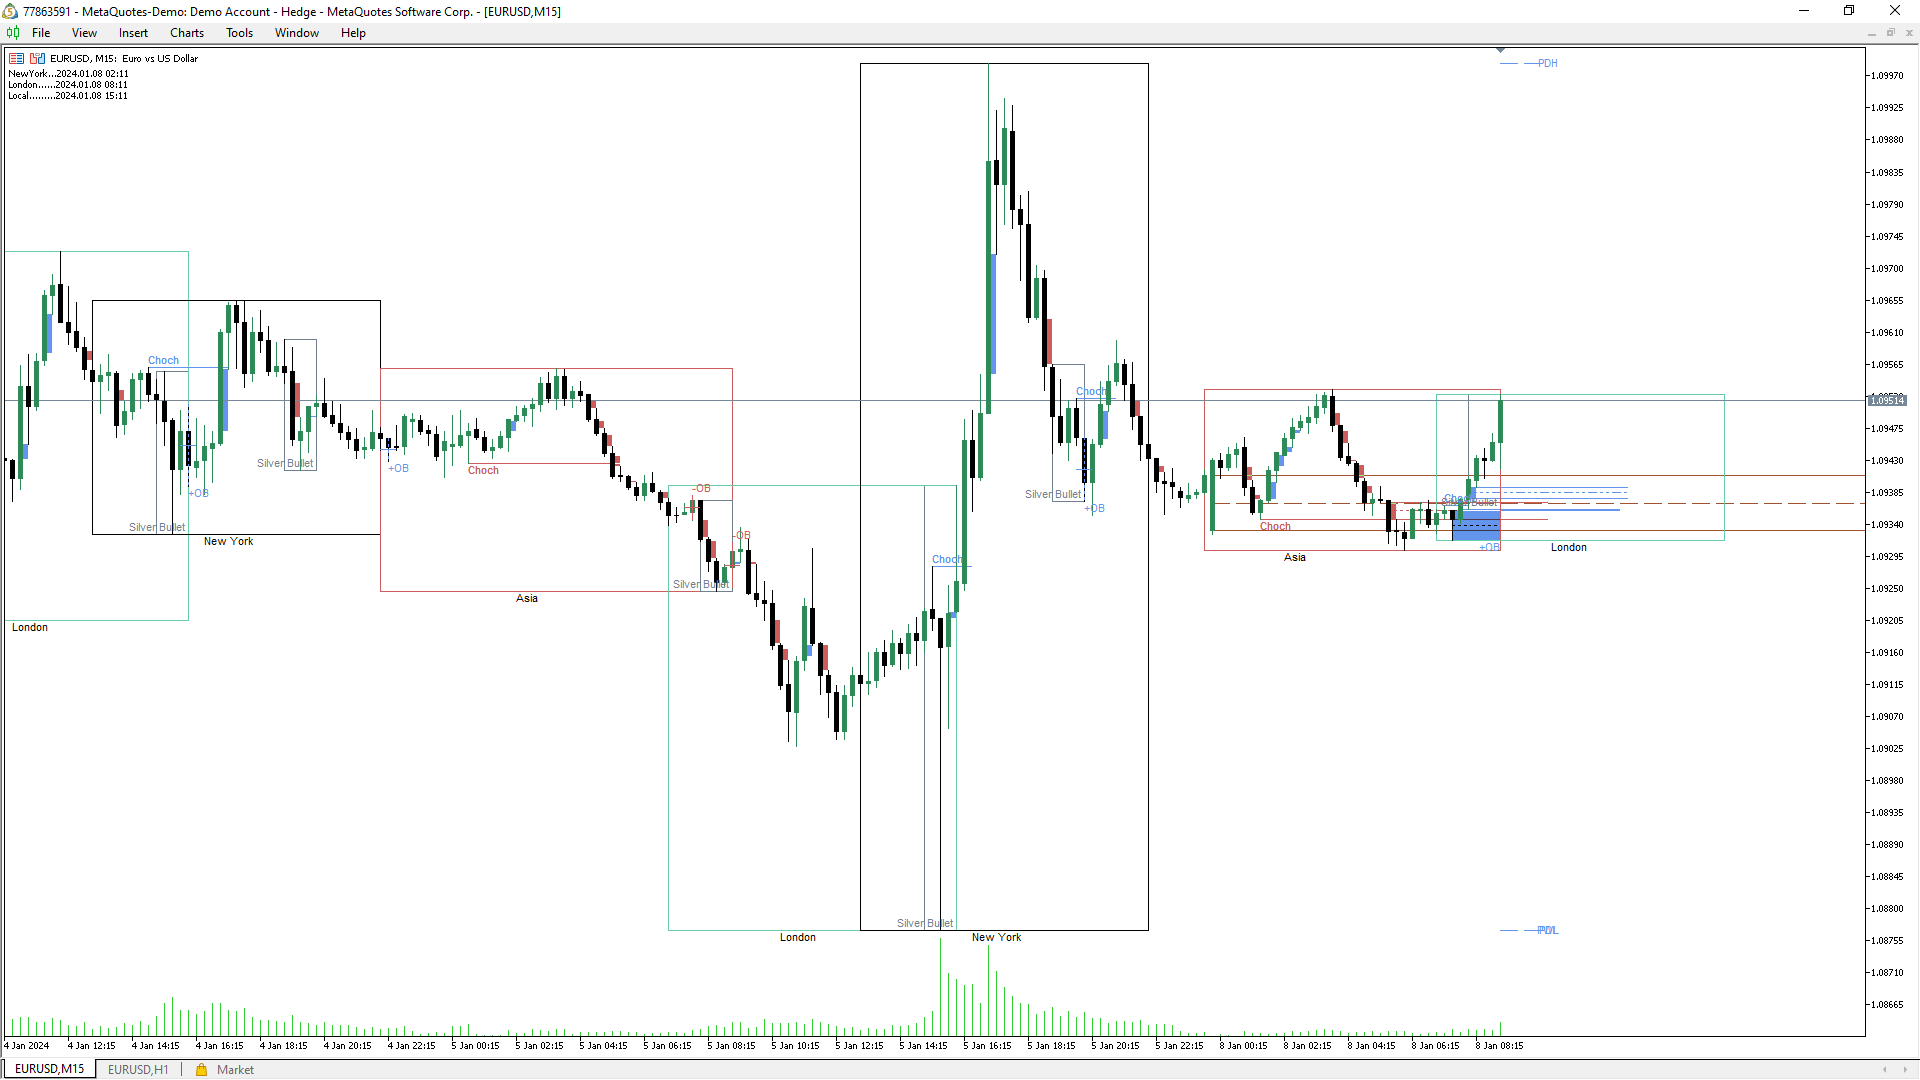
Este indicador todo en uno se enfoca en los Conceptos ICT (Conceptos de Dinero Inteligente). La Estructura de Mercado ICT intenta comprender cómo operan las instituciones, ayudando a predecir sus movimientos. Al comprender y utilizar esta estrategia, los traders pueden obtener valiosos conocimientos sobre los movimientos del mercado y encontrar entradas y salidas más prácticas basadas en la acción del precio.
Aquí hay una breve introducción a algunas de las características:
- Indicador sin repintar, sin redibujar y sin retraso.
- Bloques de orden (alcistas y bajistas), bloques de orden con métricas de volumen y alerta formada.
- Estructura de mercado en tiempo real y estructura de oscilación altos y bajos (HH, HL, LL, LH) con alerta formada.
- Ruptura de estructura (BOS), cambio de carácter (CHoCH) / cambio de momento (MS).
- Etiquetado de bloques rompedores con alerta formada.
- Detección de brecha de valor justo (FVG alcista y bajista) con alerta formada.
- Mostrar el tiempo de la bala de plata.
- Mostrar las sesiones de trading por horario: Nueva York, Londres, Asia.
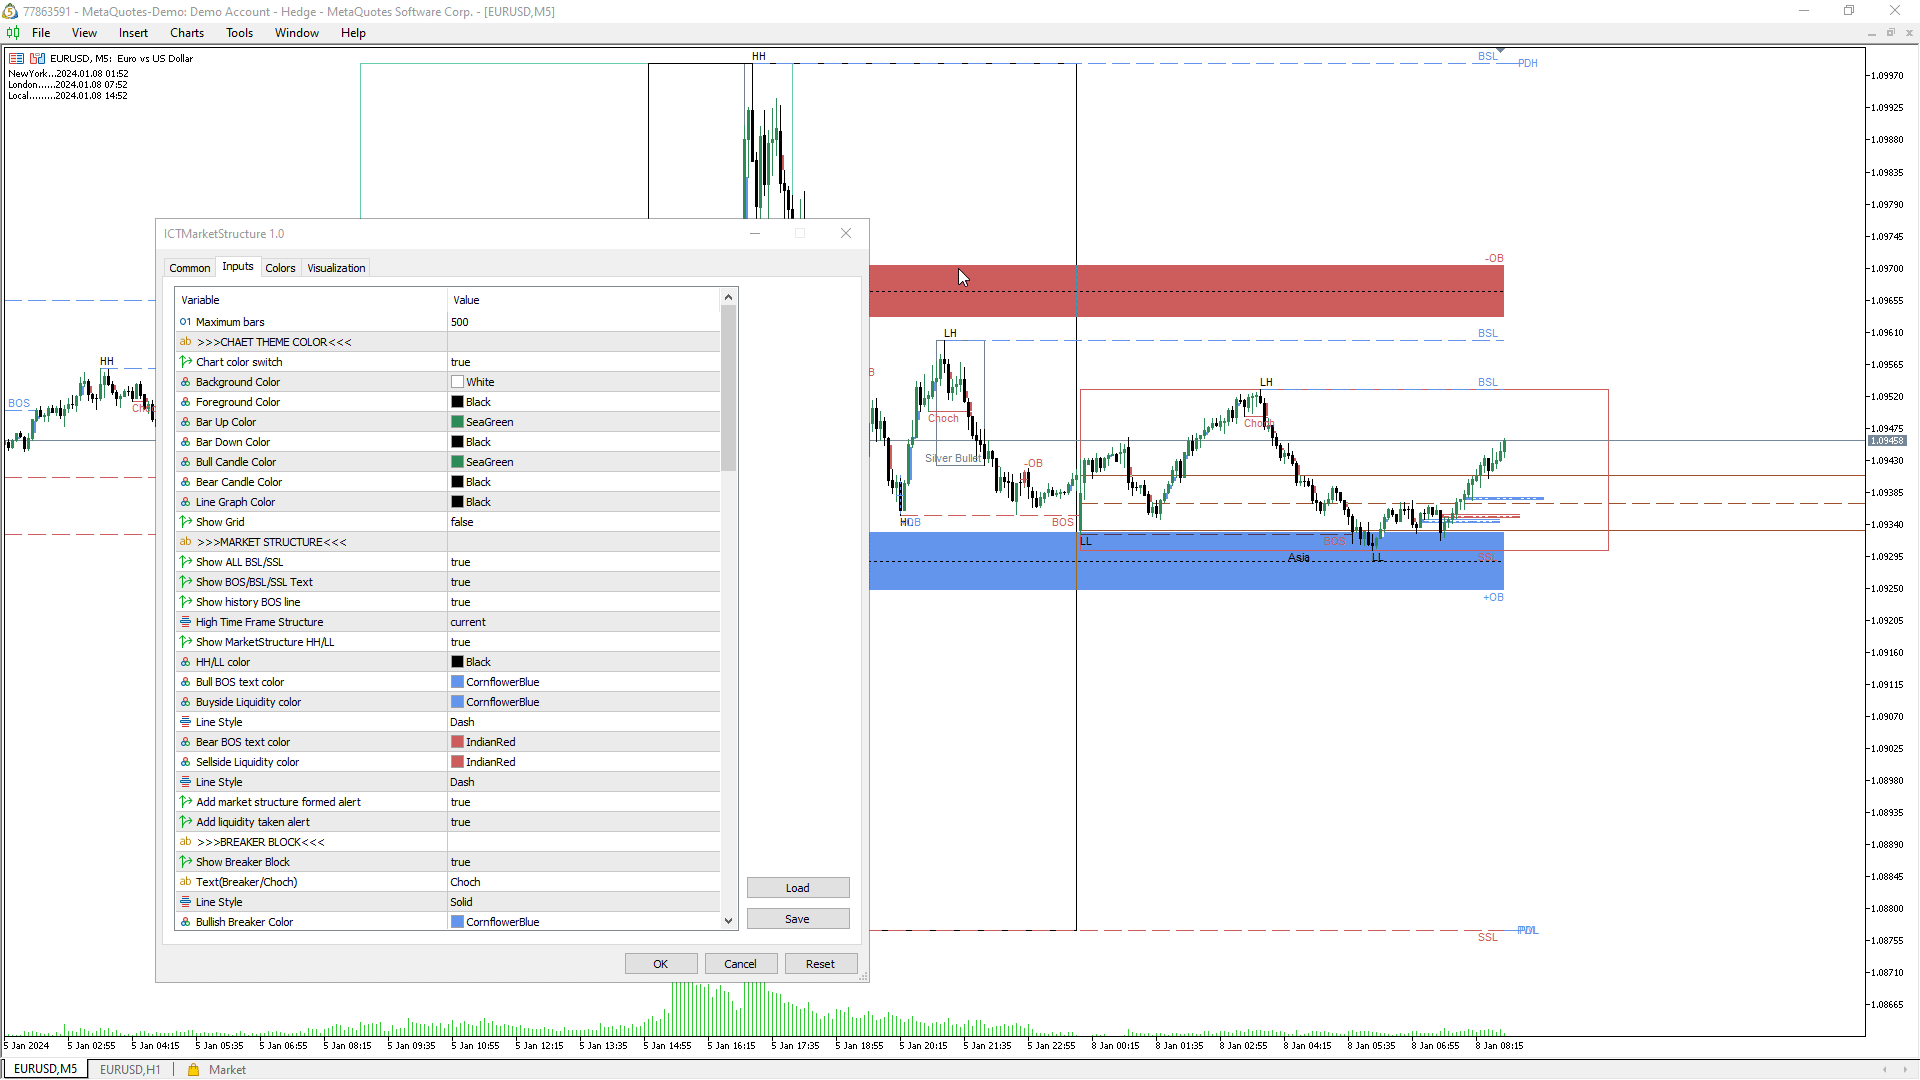
- Mostrar los colores de todo el texto y el bloque se pueden personalizar.
Temas relacionados:
Perspectiva institucional, análisis de liquidez, trading institucional, predicciones de mercado, movimiento de precios, instituciones de trading, análisis de tendencias, acción del precio, estructura de mercado, bloque de orden, soporte resistencia, BOS CHOCH, cambio de momento, oferta demanda, desequilibrio fuerte, máximos más altos, mínimos más bajos, valor justo, retroceso de Fibonacci, máximos iguales, mínimos iguales, multi-tiempo, panel de multi-tiempo, tiempo alto, estructura de tiempo alto, vacíos de liquidez, estructura de mercado, zona horaria, sesiones de mercado, alto bajo anterior, análisis técnico, piscina de liquidez, manipulación de mercado, sentimiento de mercado, análisis de precios, visión de mercado, participantes de mercado, análisis de volumen, psicología de mercado, flujo de órdenes, interpretación de mercado, pronóstico de mercado, patrones de trading, estrategias de trading
Very good implementation of Inner Circle Trading (ICT) for traders who want to trade with SMC strategies. Good support from the developer for questions and suggestions. Sehr gute implementierung von Inner Circle Trading (ICT) für Trader die mit SMC-Strategien handeln wollen. Gute Unterstützung bei Fragen und Anregungen vom Entwickler.