BoS MT5
- Indicadores
- Kekeletso Mofokeng
- Versión: 1.30
- Actualizado: 1 enero 2024
- Activaciones: 10
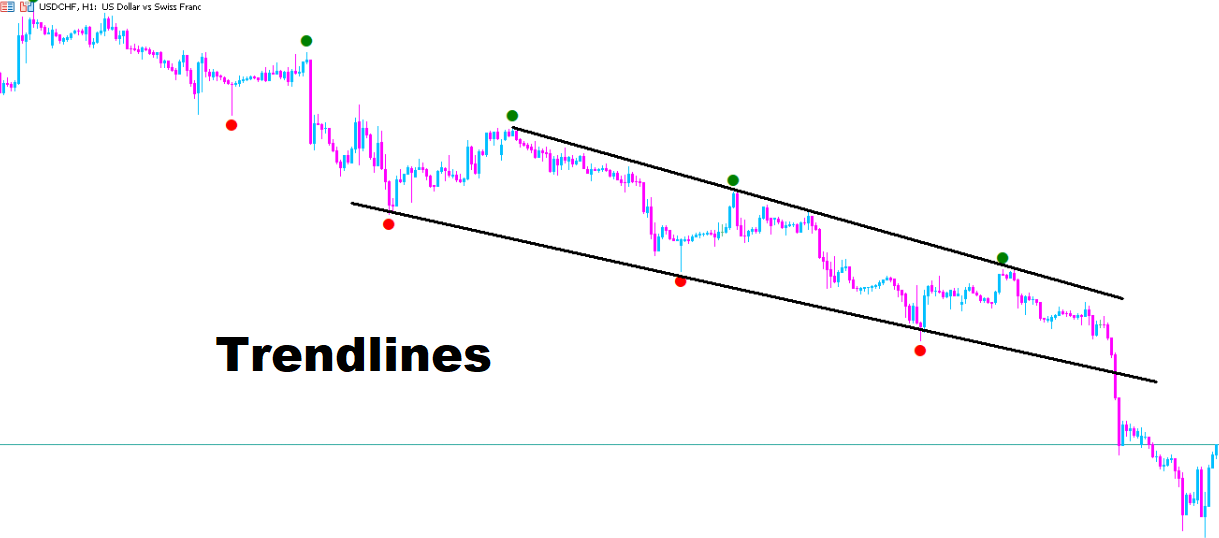
The indicator simplifies the hustle of trying to find market highs and lows. The indicator uses a method called break of structure - a break of structure is simply the process of forming a higher high on an uptrend without first creating a lower low and a lower low on a downtrend without first developing a higher high in other words a break of structure is a change in price behavior and signals a shift in market momentum. That being said the indicator is the ace card every trader should have.
Features
- BoS shows the important market highs and lows and previous market turning points
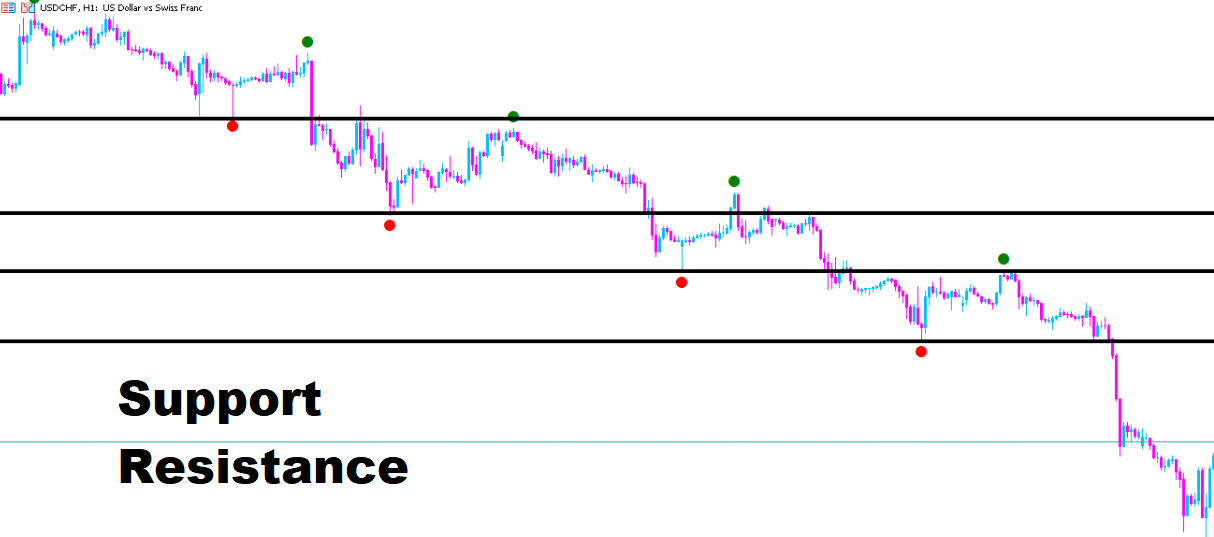
- BoS is also able to show possible support and resistance
- Multiple currency pairs supported
- Very easy to use and very customizable
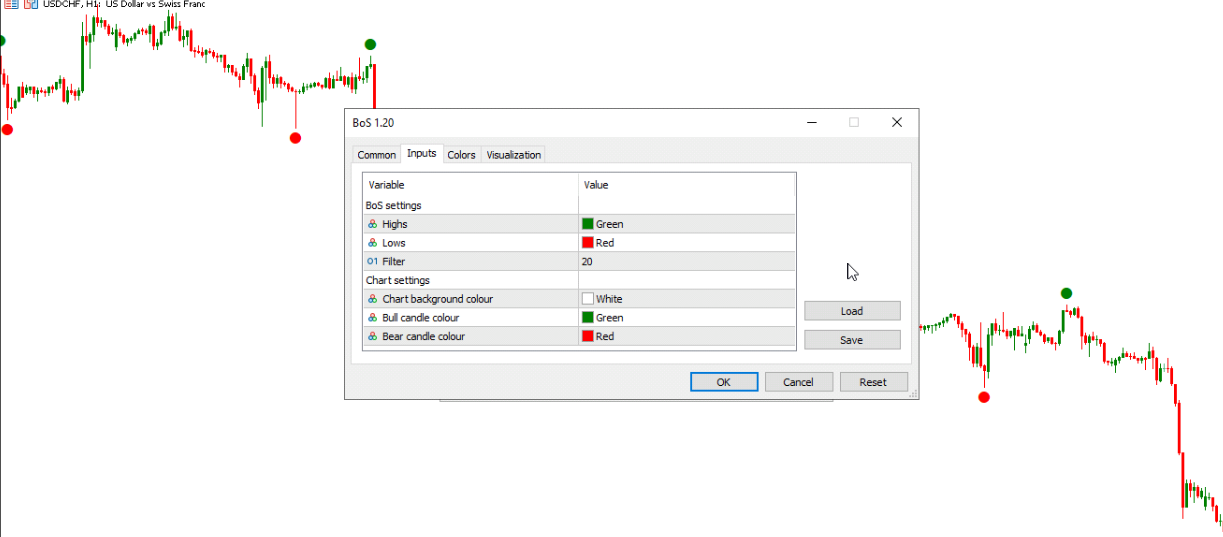
Inputs
- Highs: Here you choose which colour the High should be
- Lows: Here you choose which colour the Low FVG should be
- Filter: Here you choose the frequency of the Highs and Lows
- Chart background colour: Here you choose the background colour of the Chart
- Bull candle colour: Here you choose the colour of the bull/buy candle
- Bear candle colour: Here you choose the colour of the bear/sell candle
The lower the Filter points the more Highs and Lows you'll see even those of no significance!!!
Your feedback is much appreciated and please contact me telegram or by mail: kekeletsomfkg@gmail.com