MTF Fair Value Gaps Alerts
- Indicadores
- Jose Miranda Ramos
- Versión: 1.0
- Activaciones: 10
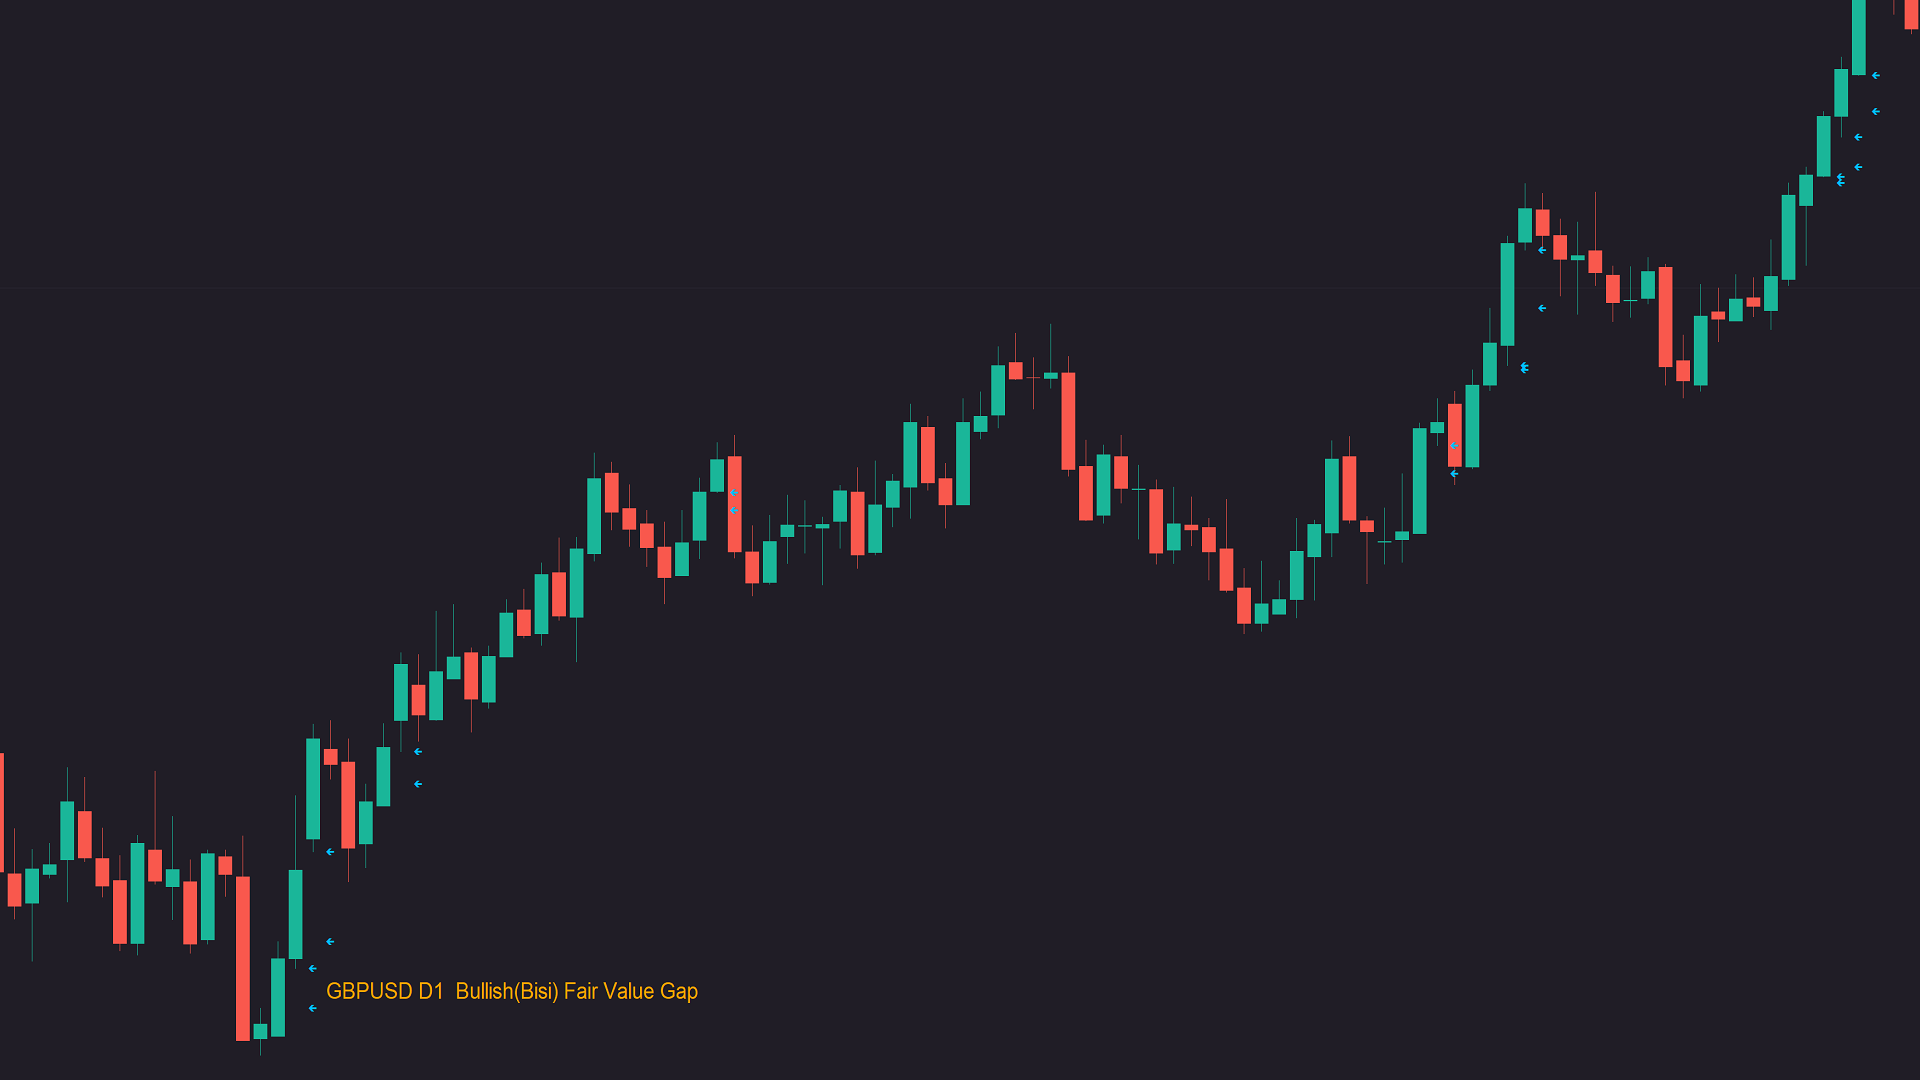
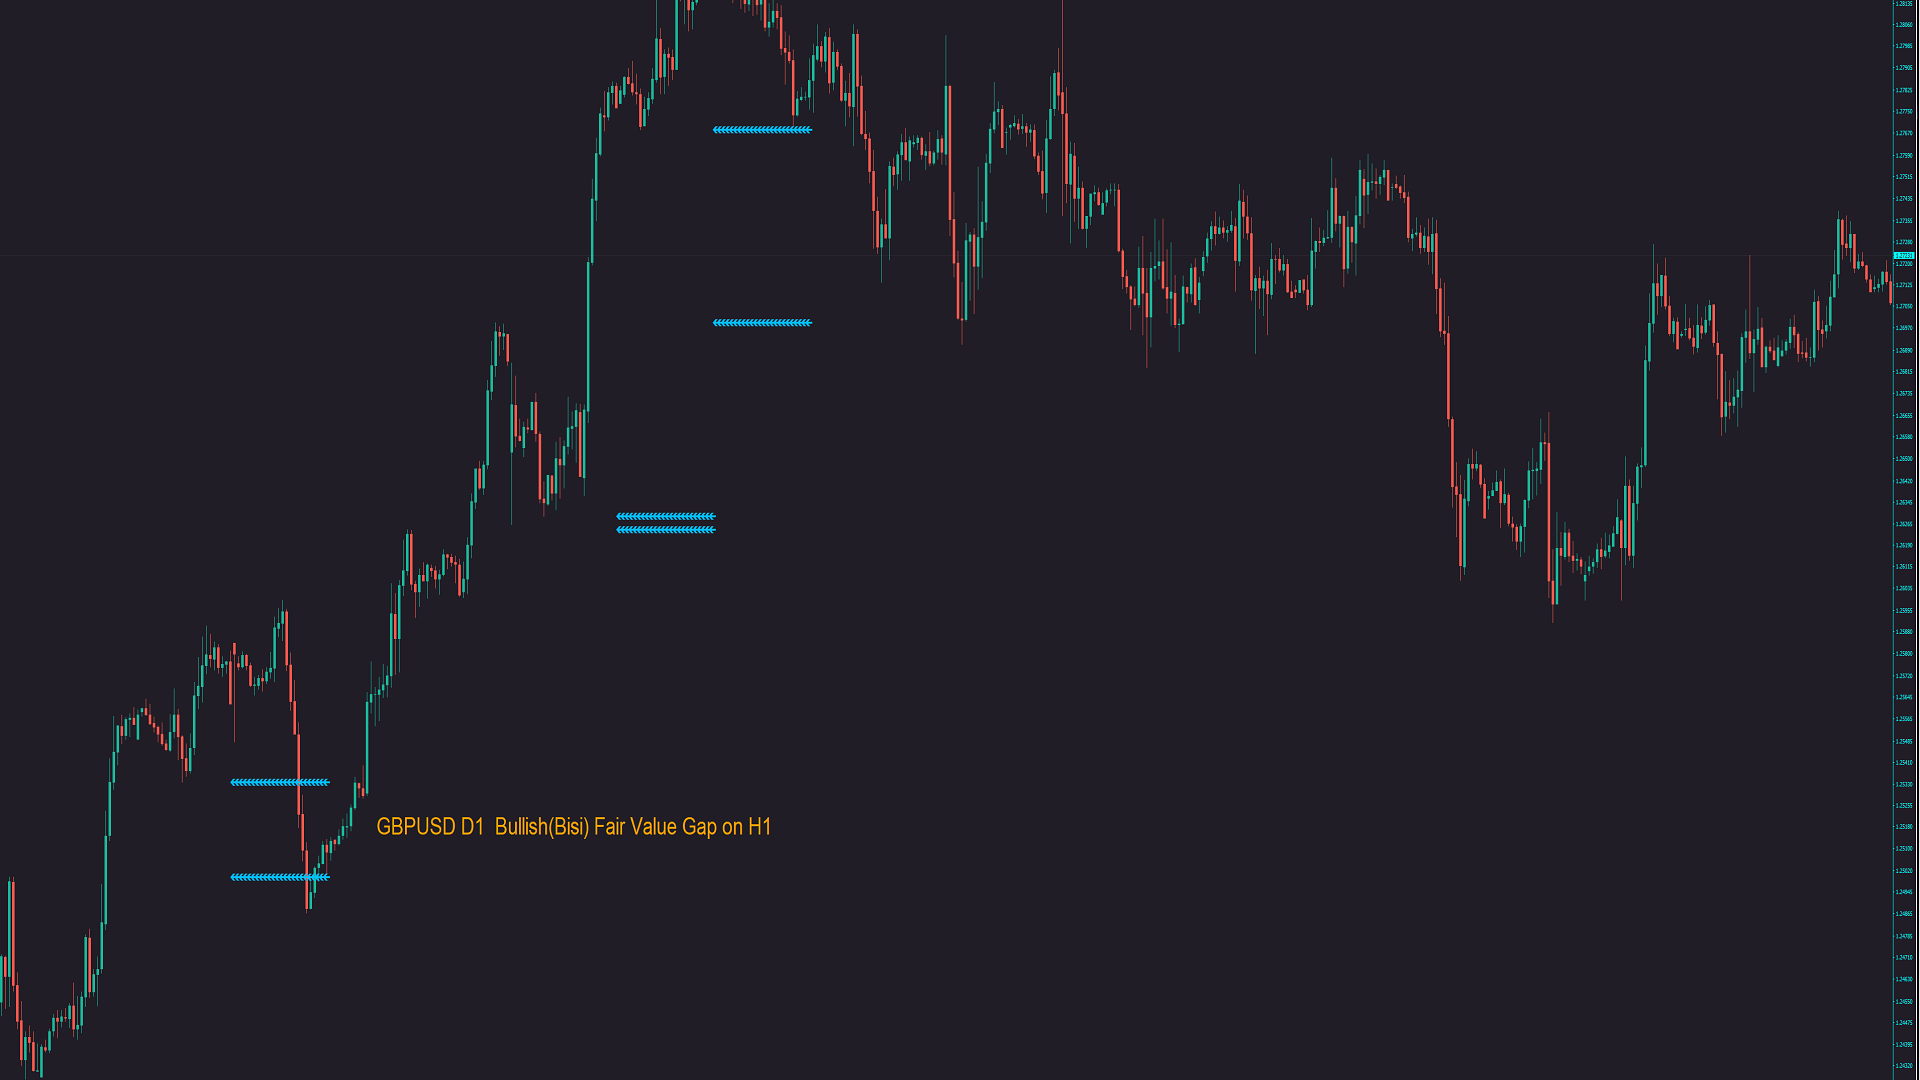
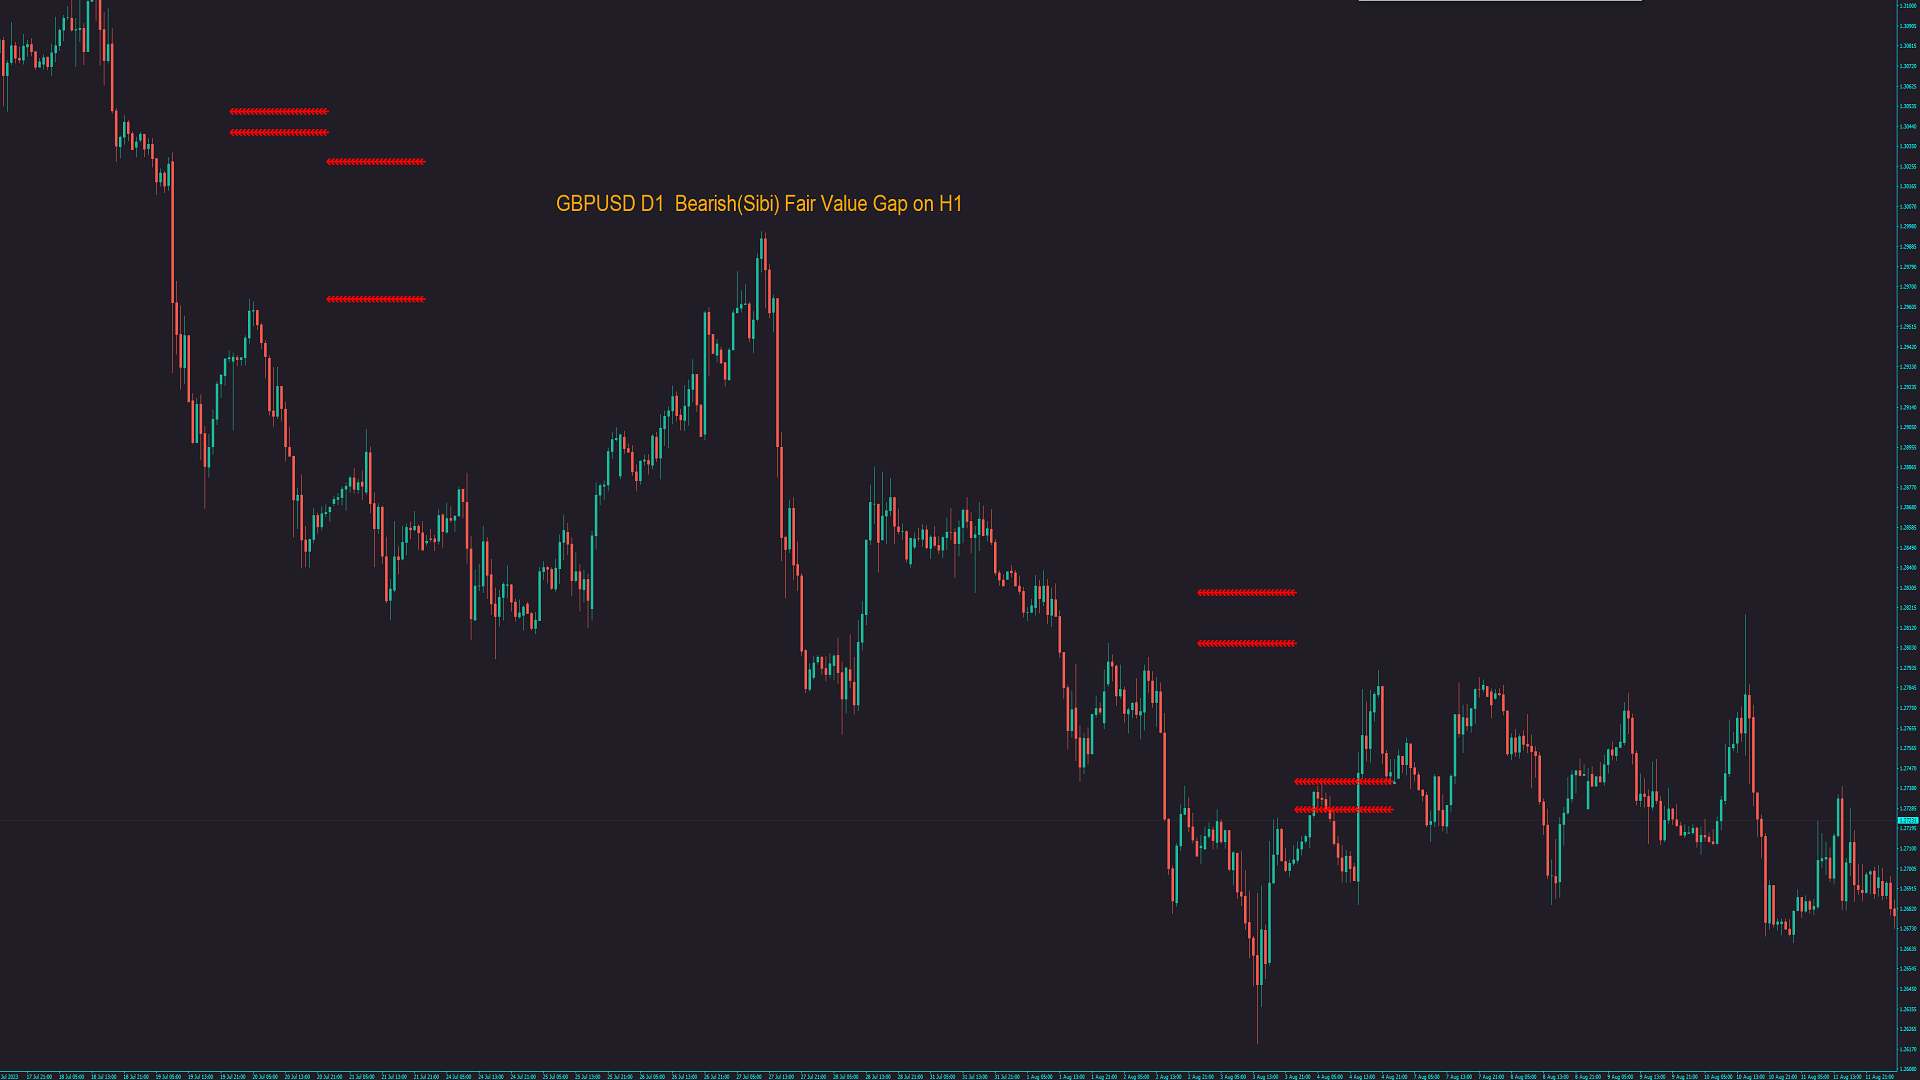
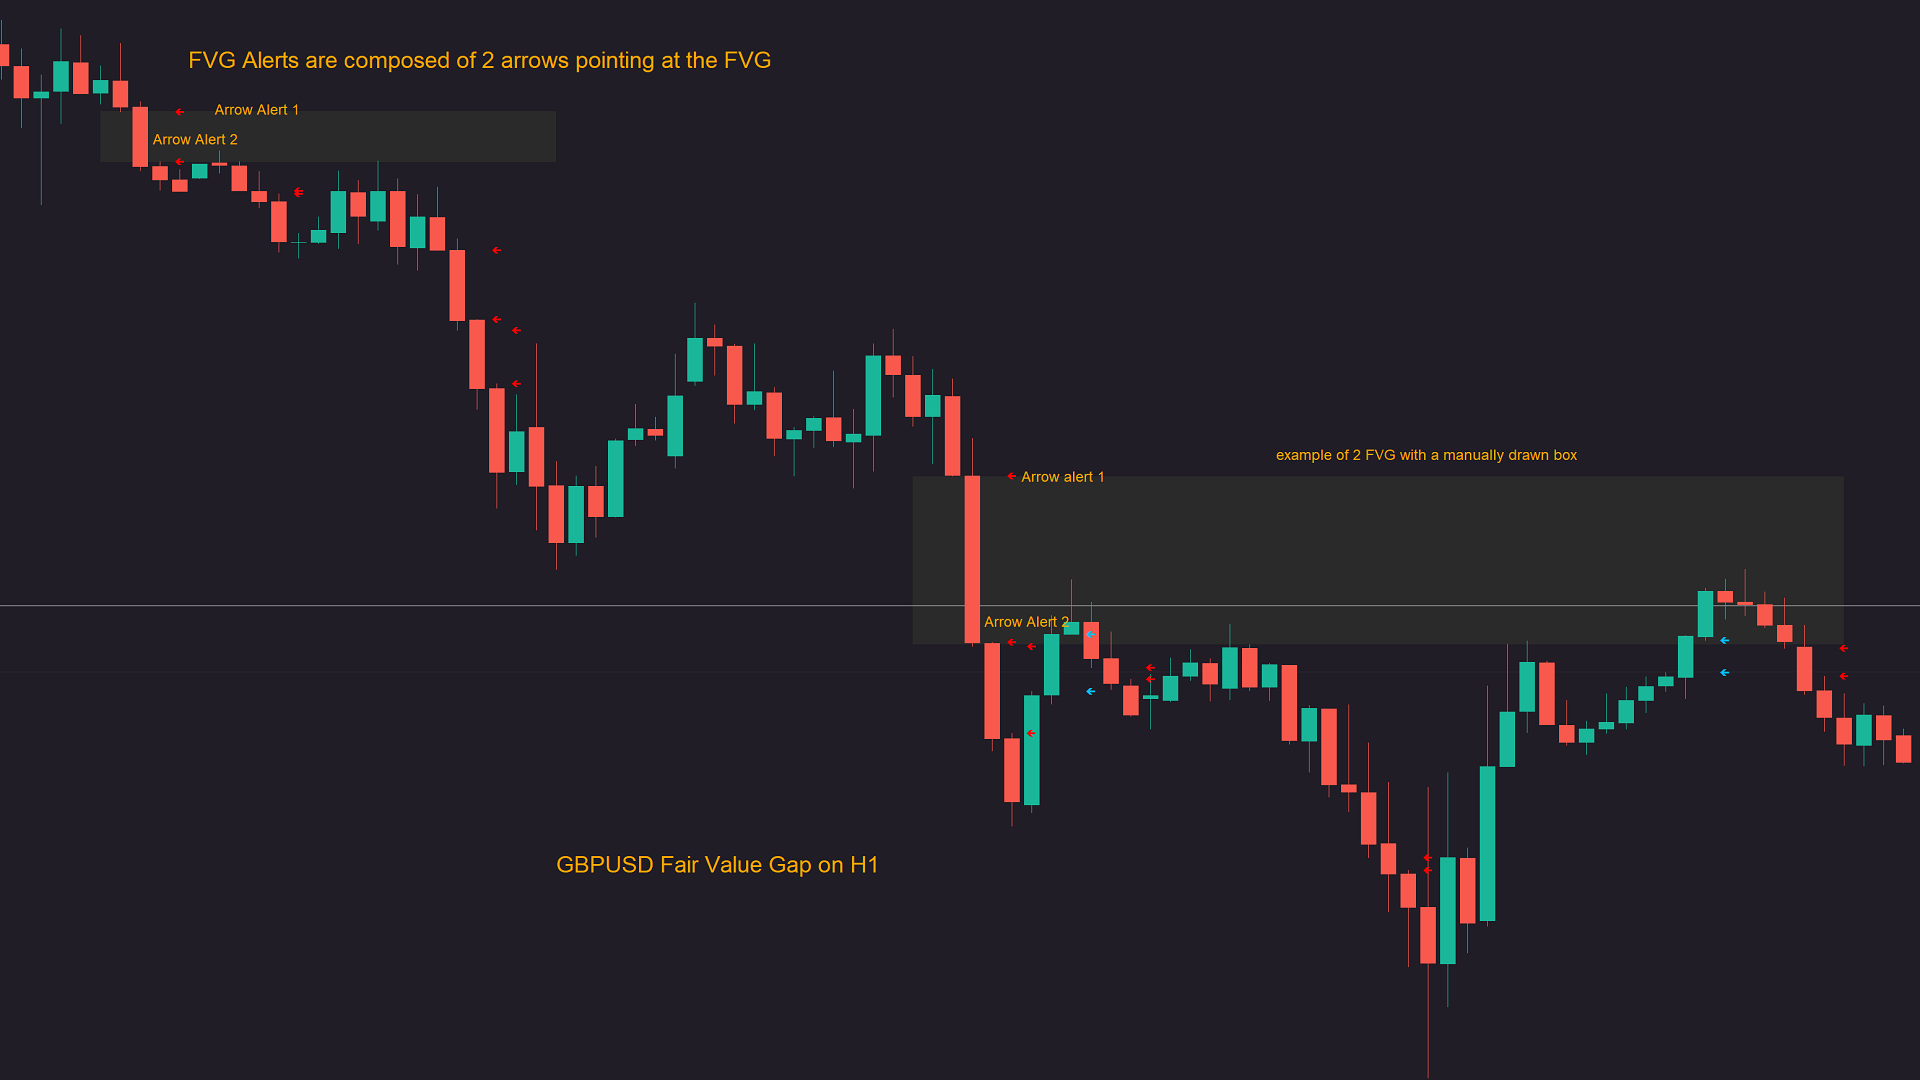
MTF Fair Value Gaps Alerts indicator is based on Fair Value Gaps (FVG), Volume imbalance (VI) and Gaps. This indicator will create 2 arrows pointing to the left showing the area of the FVG, VI and Gaps and will never repaint after the candle has been closed.
Inputs:
TF (Timeframe of the Alert For Current timeframe use CURRENT)
barshilft: the barshift needs to be the same timeframe as the above TF. barshift format (CURRENT, M1, M5, M15, M30, H1, H4, D1, W1, MN)
Send Email:
Audible Alert
Push Notifications
Types of alerts:
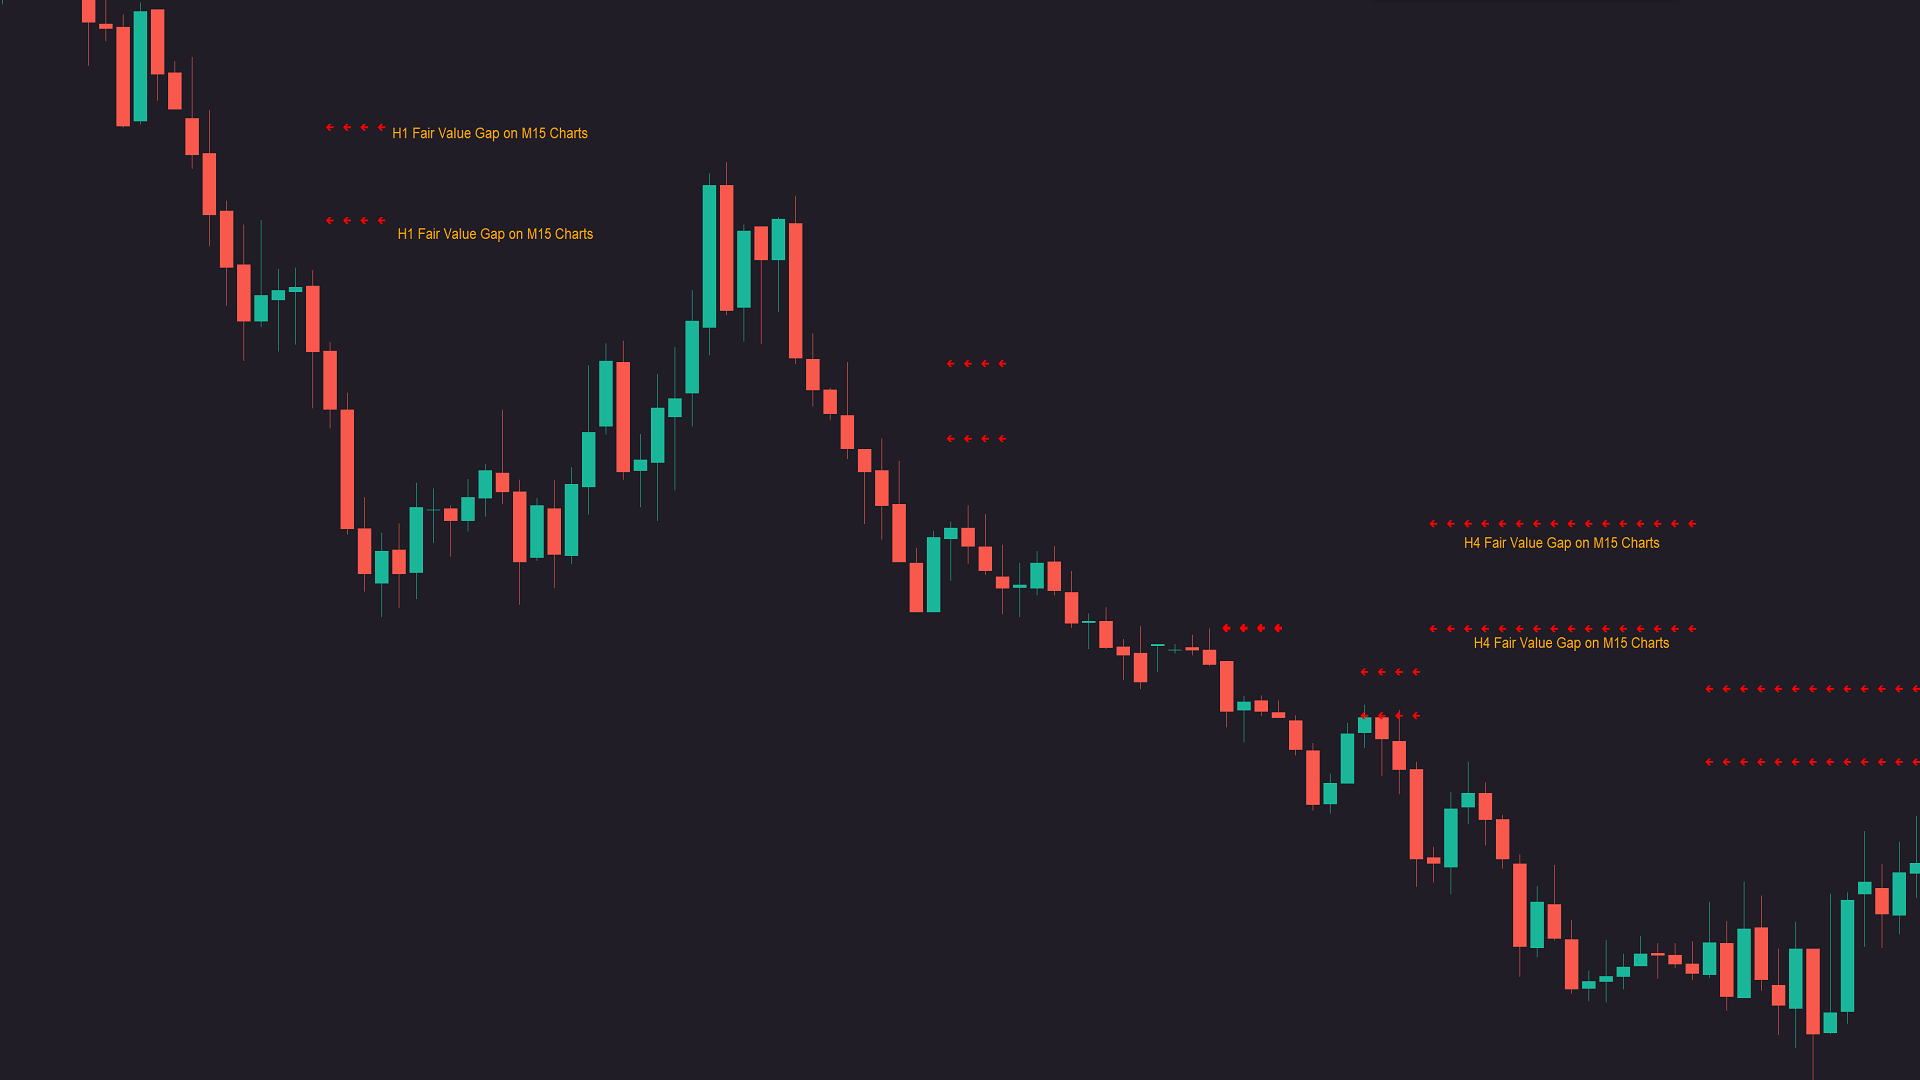
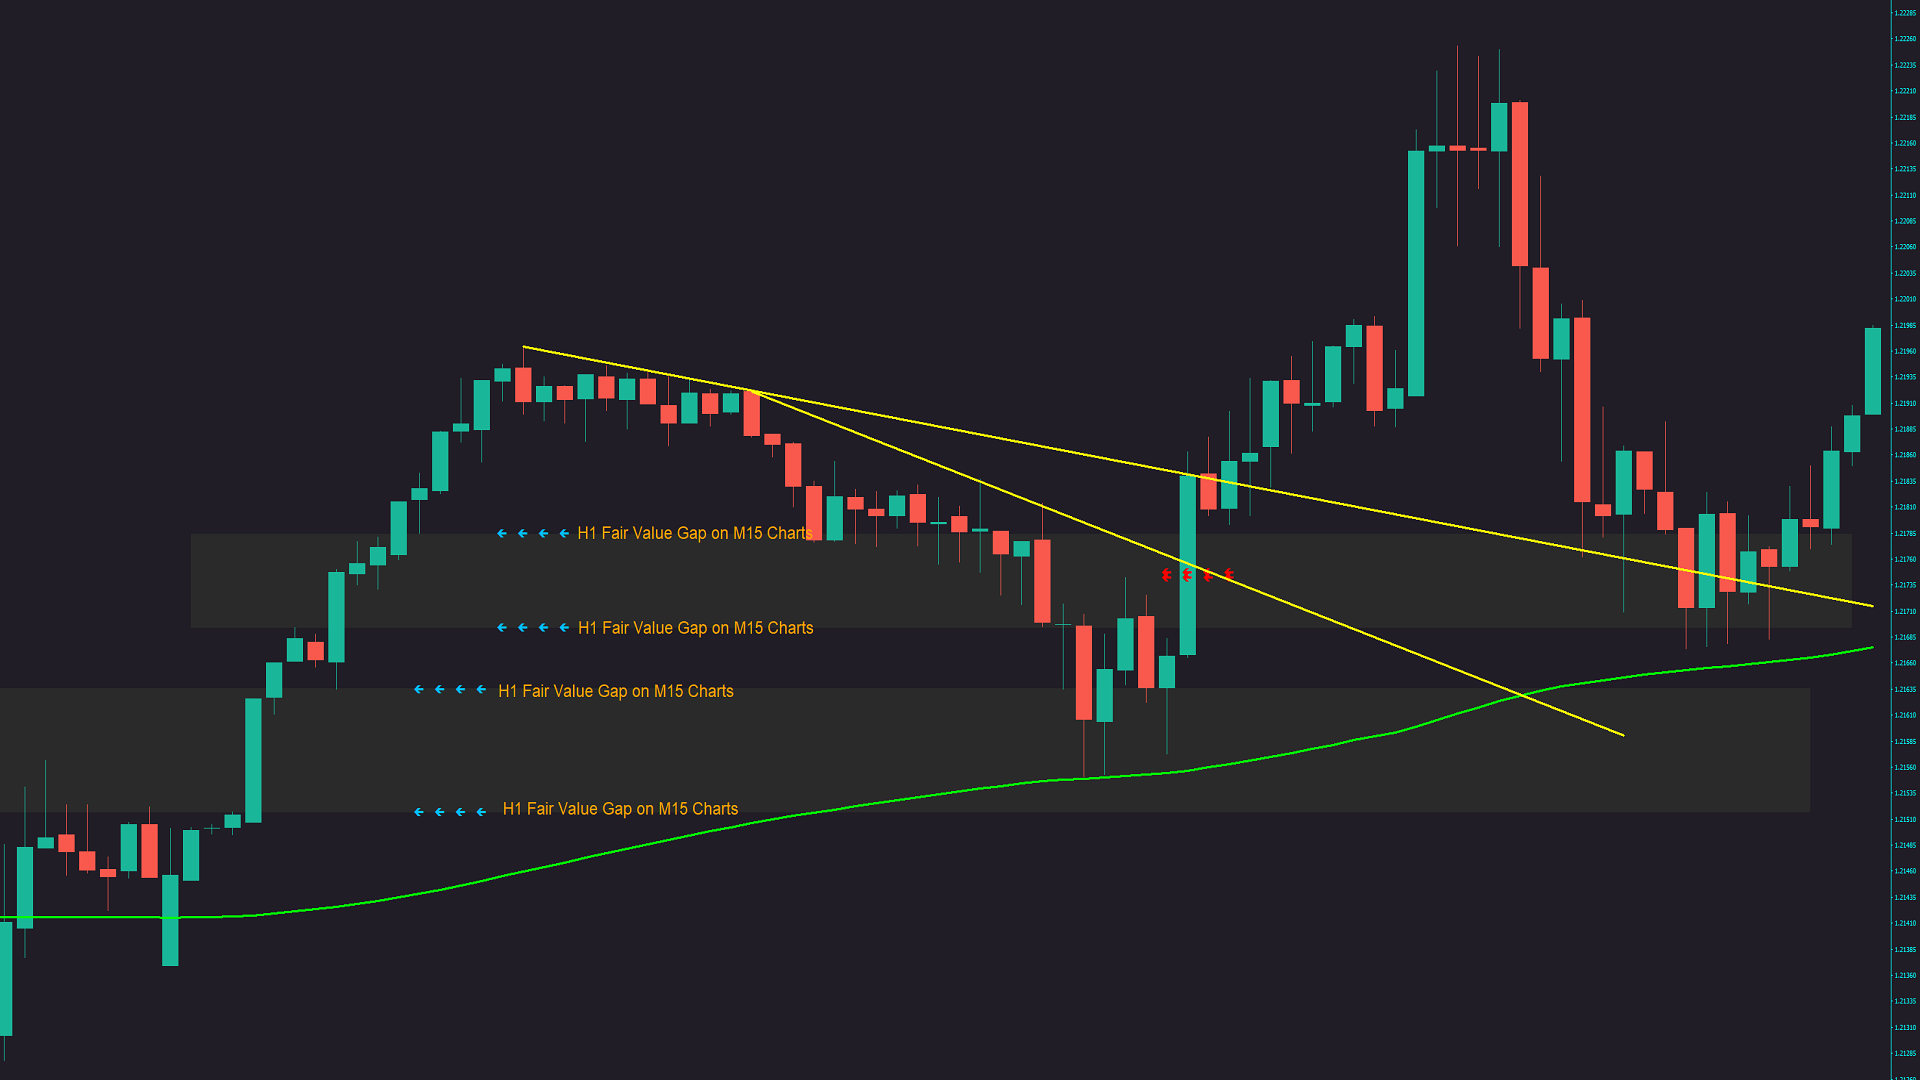
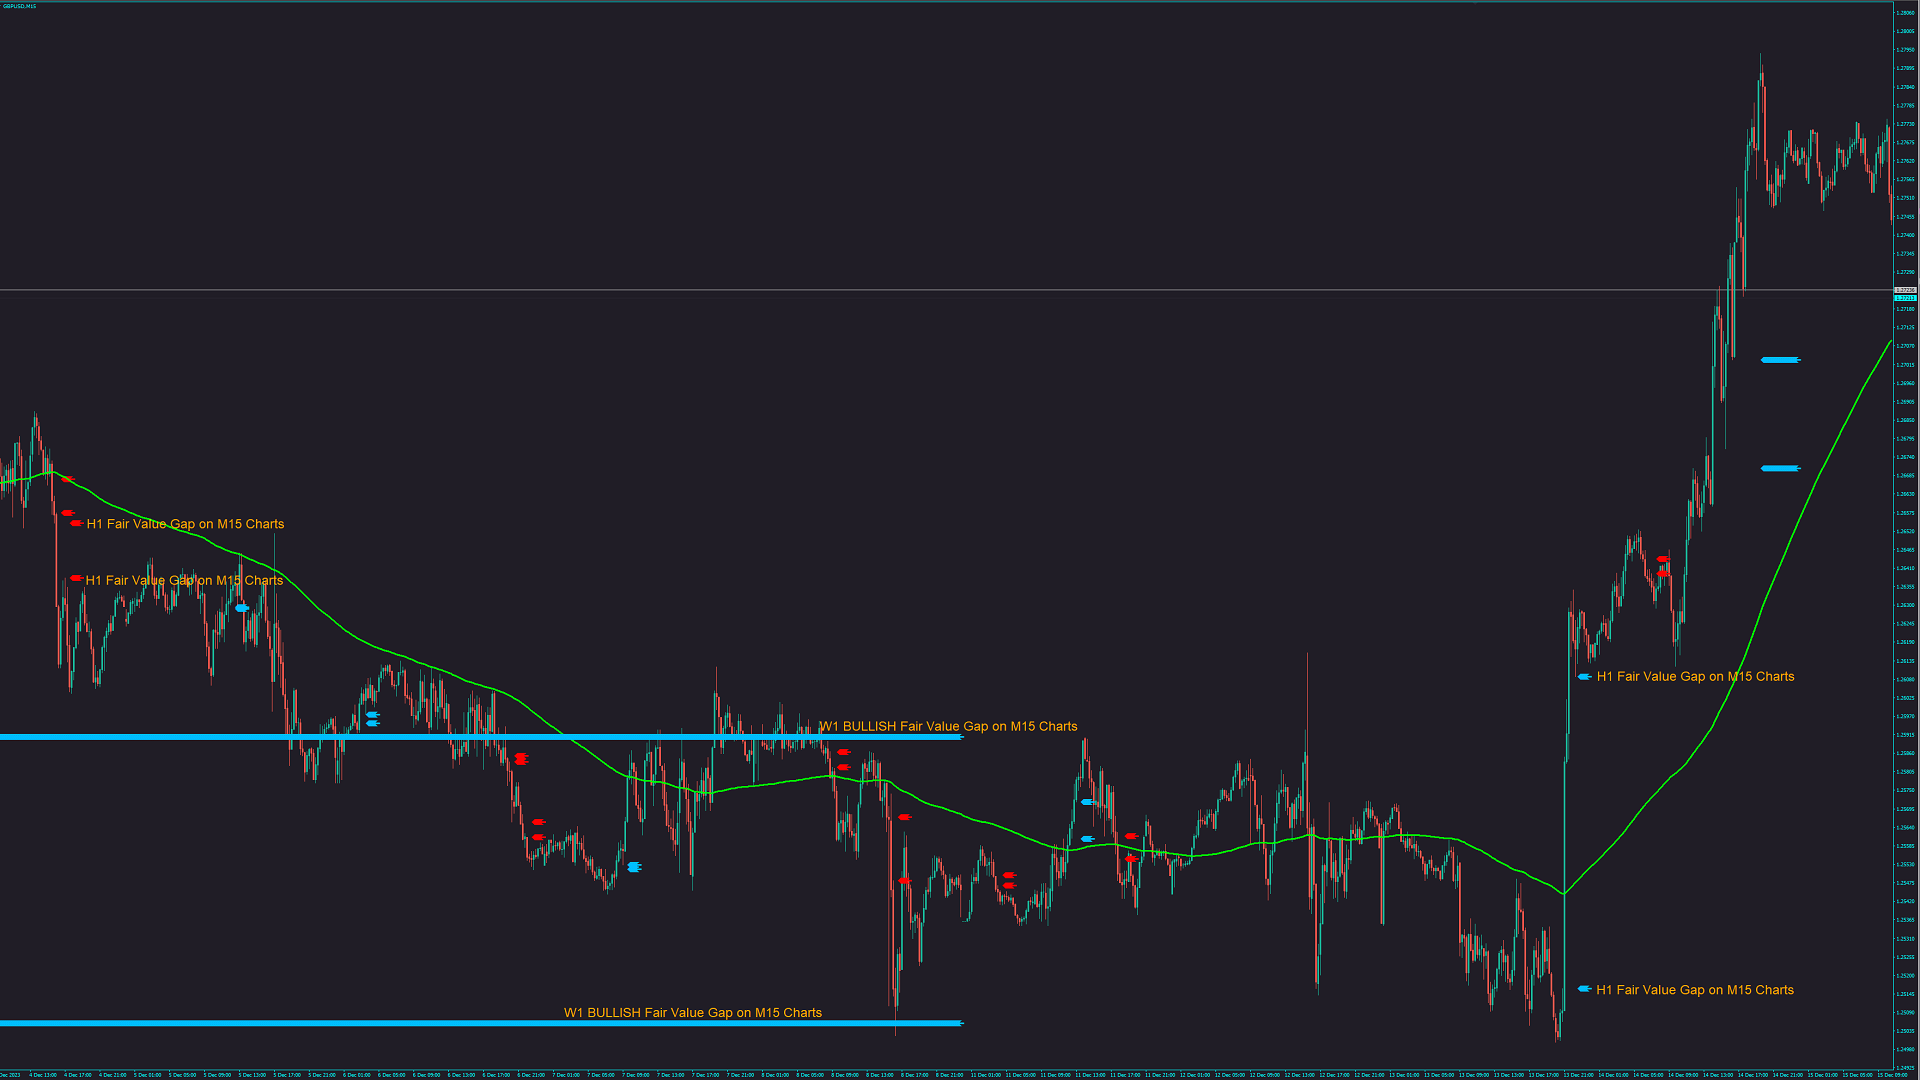
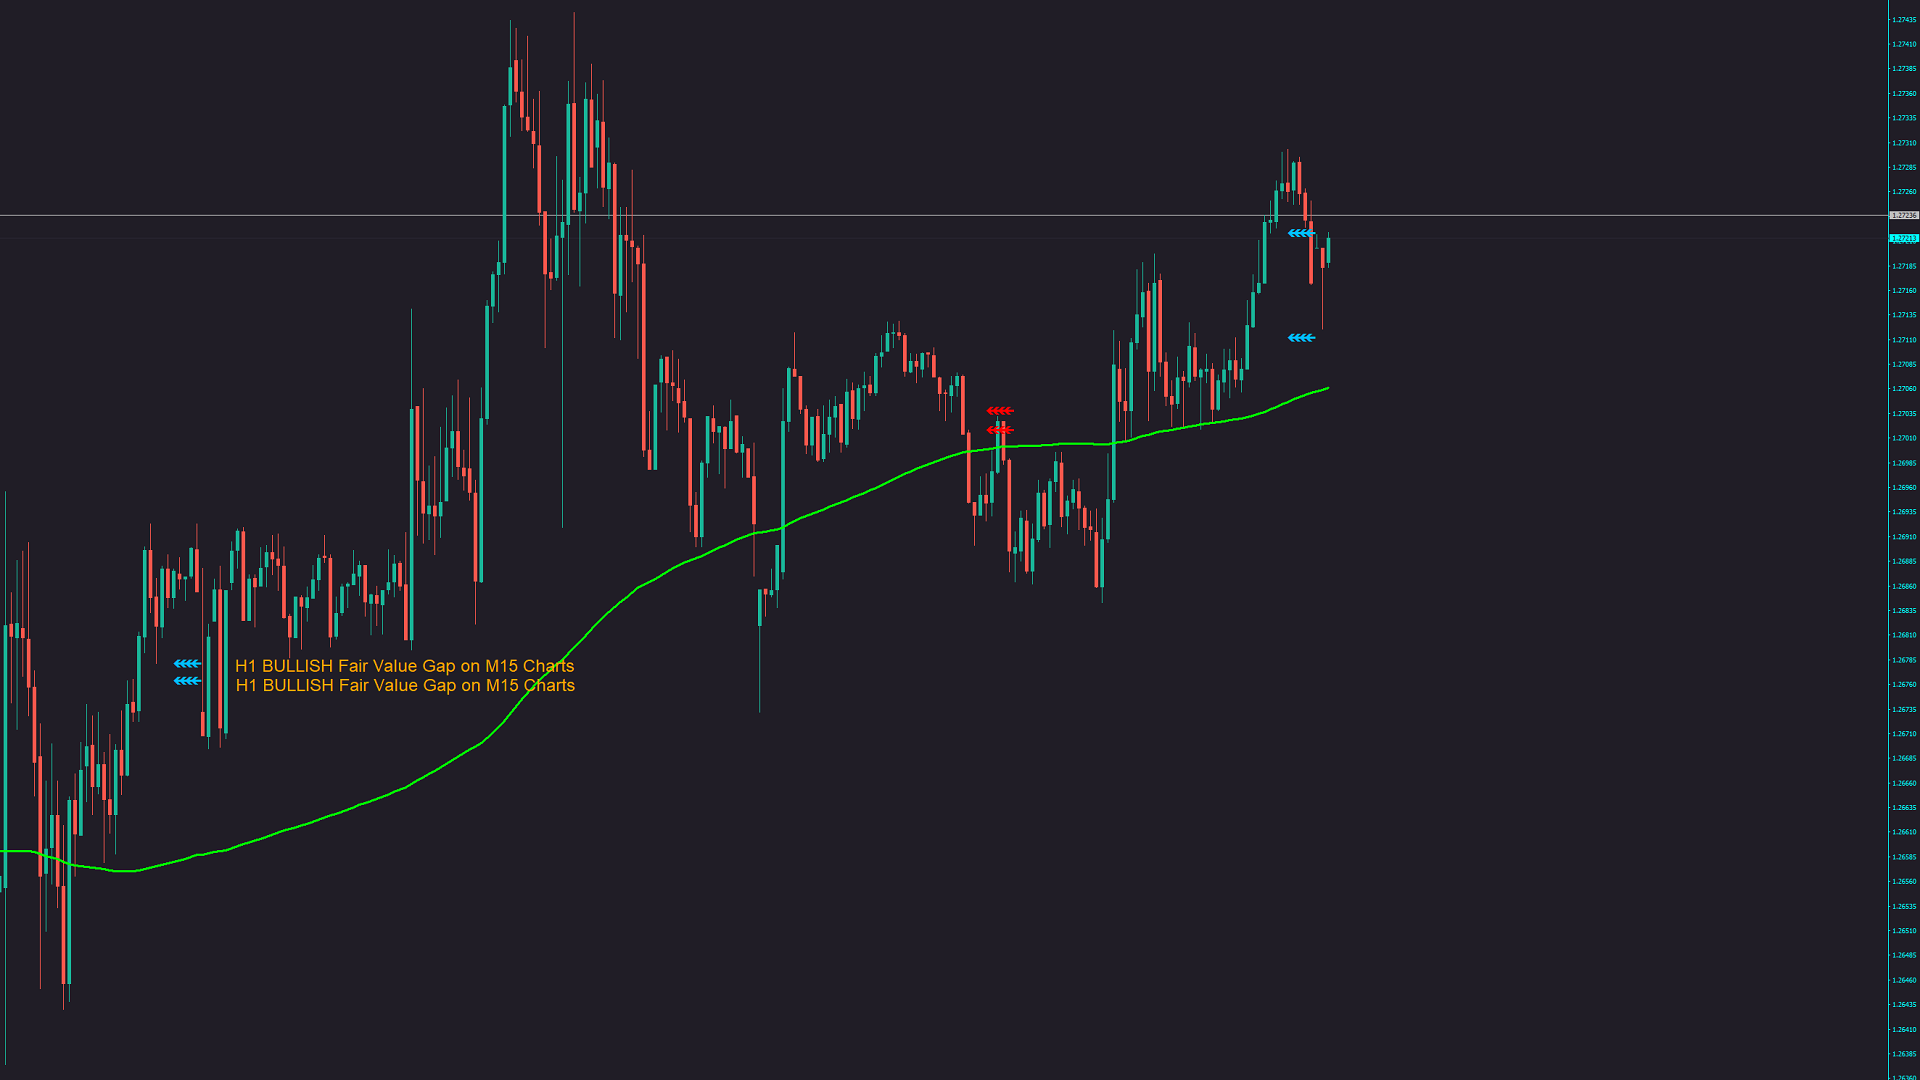
Fair Value Gaps:
- Buy Side Imbalance Sell Side inefficiency (BISI) - Imbalance where the buy side was offered but the sell side wasn't'.
- Sell Side Imbalance Buy side inefficiency (SIBI) - Imbalance where the buy side was offered but the sell side wasn't'.
Volume Imbalance
- VI- Difference between the volume of buy orders (bid volume) and sell orders (ask volume) at a specific price level.
Gaps
- Gaps- are spaces on a chart that emerge when the price of the financial instrument significantly changes, with little or no trading in between.
Best Practices:
- Use this indicator with your current analysis.
- When you load the indicator you don't see the higher time frame data on the current that means MT4 has not loaded all the higher time frame data on the current chart just switch to the indicator time frame and then go back to your current time frame and it should have all the data available.
- If Pair is in a downtrend use the Bearish alerts if in an uptrend use the bullish alerts.
- For better illustration when you get an alert draw a rectangular box from the center of the top arrow to the center of the bottom arrow and then expand the box to the right and and that will be your Support and resistance areas.
- If you add a higher time frame to a lower time frame you will receive more than one arrow back to back for until it completes the time frame. example if you add H1 alerts on the M15 you will receive 4 arrows back to back.
Alert Format:
- Audible Alerts- option plays a sound and triggers a popup window when an alert shows up.
- Email alerts.
- Push notifications - Receive push notifications to your Mobile meta trader app.
Indicator Timeframes relations:
- For M1 charts use M1, M5, M30 alerts
- For M5 use use M5, M30, H1
- For M15 use M15 H1, H4 and D1
- For H30 use M30, H1, H4 and D1
- For H1 use H1, H4 and D1 W1
- For H4 use H4, D1 and W1
- For D1 use D1, W1 and MN
- for W1 use W1, MN
Optional: If using a Moving Average for buy and sell zone
For Technical support after purchase contact me here via MQL5
PLEASE TAKE NOTICE: For best results use this indicator as an extra tools after you have completed your regular analysis and use it for alerts based on such analysis.