• Información general
  • Comentarios
  • Discusión

Supply demand zone confirm MT5

Forex traders often observe increased market activity near Supply and Demand zones, which are levels formed based on zones where strong price movements have previously occurred.

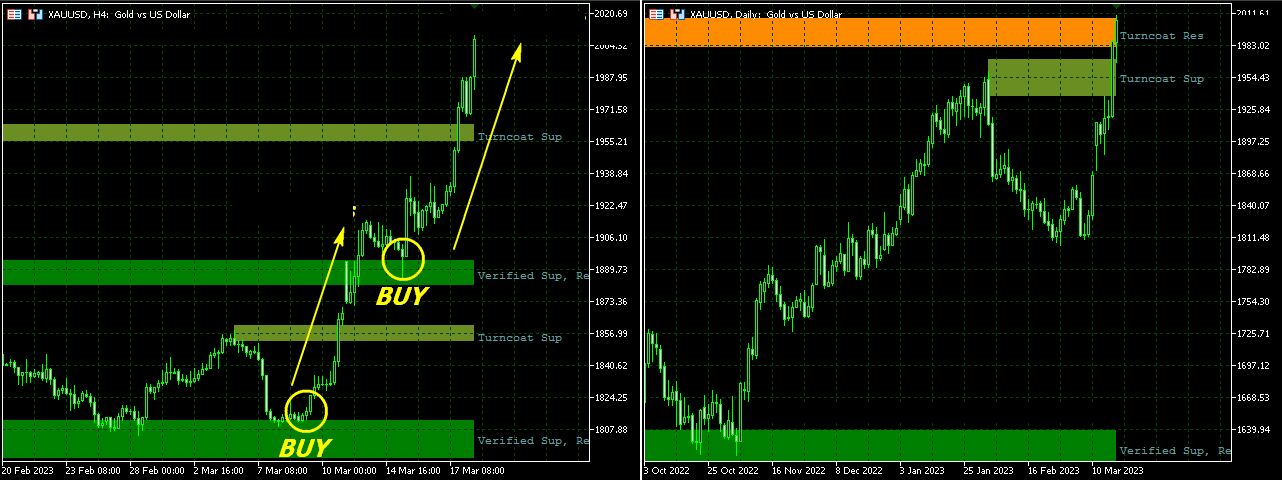
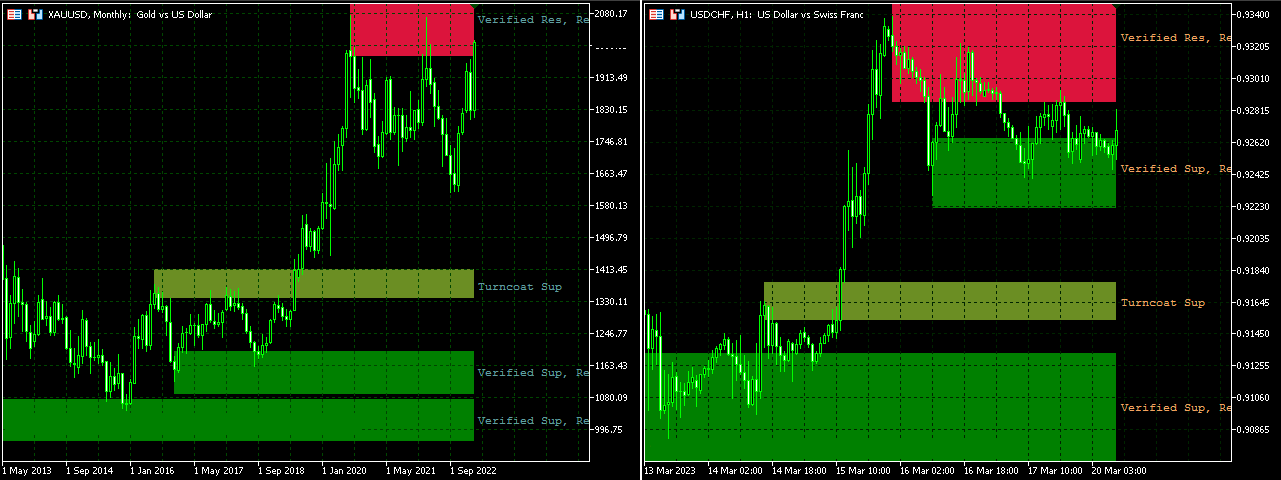
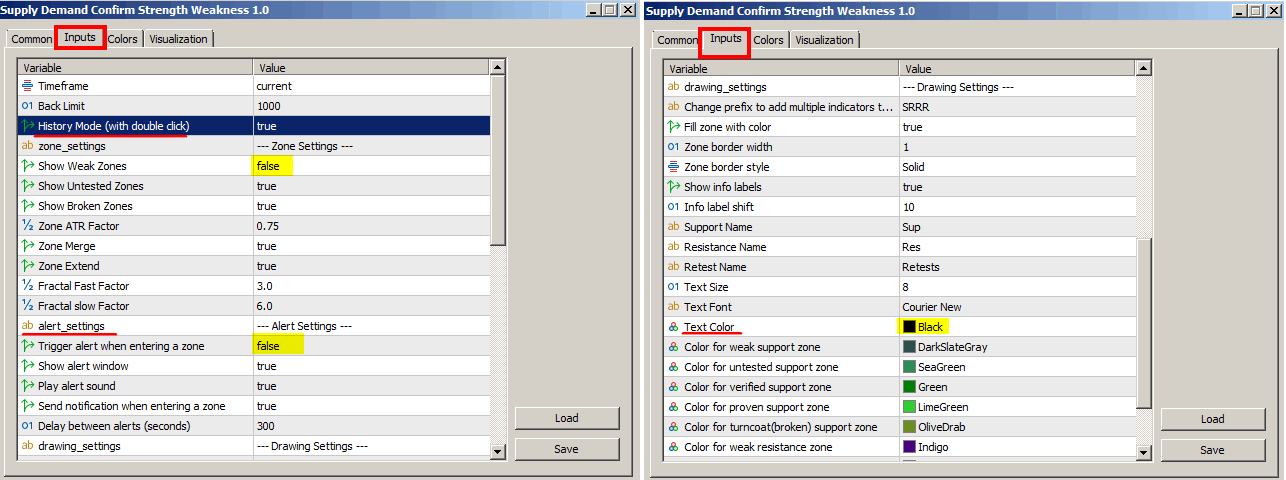
The Supply Demand Strong Weak Confirm Indicator utilizes fractals and the ATR indicator to identify and plot support and resistance zones on the price chart. These zones are categorized as follows:

- Weak: significant high and low points in the trend.
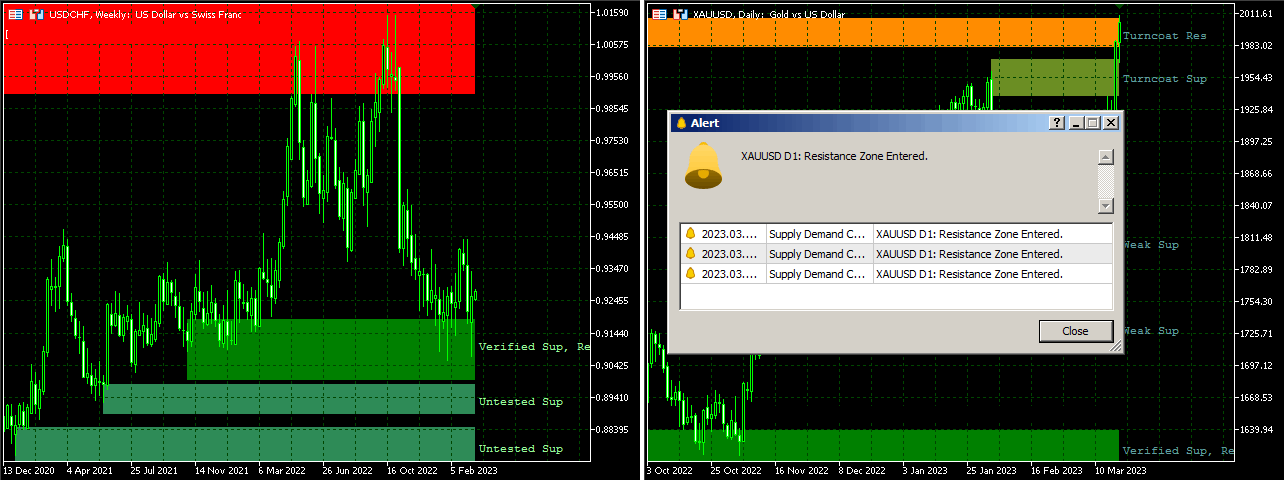
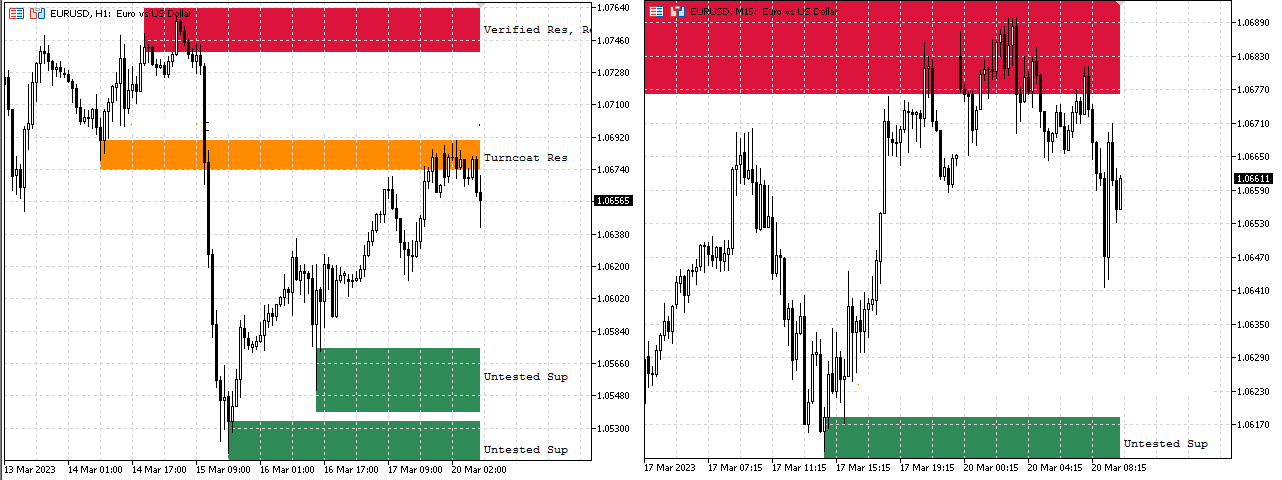
- Untested: crucial turning points in the price chart that the price has not revisited.
- Verified: robust zones where the price touched previously but failed to break.
- Proven: verified zones where the price failed to break at least four times.
- Broken: zones that the price has successfully breached (not applicable to weak zones).

By setting the "HistoryMode" parameter to true, traders can double-click on any point in the price chart to view the Support and Resistance zones at that point.

Supply and Demand zones are more reliable indicators on higher timeframes, as lower timeframes tend to have more market noise. Additionally, the effectiveness of these zones increases with the frequency of price tests.
Productos recomendados
All Harmonics 26
Alexey Isavnin
3.8 (5)
Harmonic patterns are characteristic series of price movements with respect to Fibonacci levels, which statistically precede price reversals. This indicator searches for harmonic patterns. It is capable of recognising 26 classical and non-classical harmonic patterns : Classical Gartley Butterfly Alternate Butterfly Bat Alternate Bat Crab Deep Crab Three Drives Non-classical Shark Alternate Shark Cypher 5-0 Anti Gartley Anti Butterfly Anti Alternate Butterfly Anti Bat Anti Alternate Bat Anti Crab
The   Supply and Demand Zones indicator   is one of the best tools we have ever made. This great tool automatically draws supply and demand zones, the best places for opening and closing positions. It has many advanced features such as multi timeframe zones support, displaying the width of zones, alert notifications for retouched zones, and much more. Because of market fractality, this indicator can be used for any kind of trading. Whether you are a positional, swing, or intraday trader does no
Price Breakout pattern Scanner is the automatic scanner for traders and investors. It can detect following patterns automatically from your chart. Head and Shoulder - Common tradable pattern. Reverse Head and Shoulder - This pattern is the reverse formation of the Head and Shoulder. Double Top - When the price hits resistance level twice and decline toward the support level, the trader can anticipate sudden bearish breakout through the support level. Double Bottom - The double bottom pattern is
El patrón 123 es uno de los patrones de gráficos más populares, potentes y flexibles. El patrón se compone de tres puntos de precio: un fondo, un pico o valle, y un retroceso de Fibonacci entre 38.2% y 71.8%. Un patrón se considera válido cuando el precio se rompe más allá del último pico o valle, momento en el que el indicador traza una flecha, levanta una alerta y se puede colocar el comercio. [ Guía de instalación | Guía de actualización | Solución de problemas | FAQ | Todos los productos ]
Awesome Oscillator by Bill Williams with the ability to fine-tune and replace the averaging algorithms of the indicator, which significantly expands the possibilities of using this oscillator in algorithmic trading and brings it closer in its properties to such an indicator as the MACD. To reduce price noise, the final indicator is processed with an additional Smooth averaging. The indicator has the ability to give alerts, send mail messages and push signals when the direction of movement of th
Introduction to Chart Pattern MT Chart Pattern MT is a chart pattern scanner to detect the triangle pattern, falling wedge pattern, rising wedge pattern, channel pattern and so on. Chart Pattern MT uses highly sophisticated chart pattern detection algorithm. However, we have designed it in the easy to use with intuitive user interface. Chart Pattern MT will show all the patterns in your chart in the most efficient format for your trading. You do not have to do tedious manual pattern detection an
PZ Swing Trading MT5
PZ TRADING SLU
5 (4)
Swing Trading es el primer indicador diseñado para detectar oscilaciones en la dirección de la tendencia y posibles oscilaciones de reversión. Utiliza el enfoque de intercambio de línea de base, ampliamente descrito en la literatura comercial. El indicador estudia varios vectores de precios y tiempos para rastrear la dirección de la tendencia agregada y detecta situaciones en las que el mercado está sobrevendido o sobrecomprado y listo para corregir. [ Guía de instalación | Guía de actualización
Accelerator Oscillator by Bill Williams   with the ability to fine-tune and replace the averaging algorithms of the indicator, which significantly expands the possibilities of using this oscillator in algorithmic trading and brings it closer in its properties to such an indicator as MACD. To reduce price noise, the final indicator is processed with an additional Smooth averaging.  The indicator has the ability to give alerts, send mail messages and push signals when the direction of movement
Cumulative delta indicator As most traders believe, the price moves under the pressure of market buying or selling. When someone redeems an offer standing in the cup, the deal is a "buy". If someone pours into the bid standing in the cup - the deal goes with the direction of "sale". The delta is the difference between purchases and sales. A cumulative delta - the difference between the cumulative sum of purchases and sales for a certain period of time. It allows you to see who is currently contr
KT Renko Patterns MT5
KEENBASE SOFTWARE SOLUTIONS
KT Renko Patterns scans the Renko chart brick by brick to find some famous chart patterns that are frequently used by traders across the various financial markets. Compared to the time-based charts, patterns based trading is easier and more evident on Renko charts due to their uncluttered appearance. KT Renko Patterns features multiple Renko patterns, and many of these patterns are extensively explained in the book titled Profitable Trading with Renko Charts by Prashant Shah. A 100% automate
Introduction to X3 Chart Pattern Scanner X3 Cherart Pattern Scanner is the non-repainting and non-lagging indicator detecting X3 chart patterns including Harmonic pattern, Elliott Wave pattern, X3 patterns, and Japanese Candlestick patterns. Historical patterns match with signal patterns. Hence, you can readily develop the solid trading strategy in your chart. More importantly, this superb pattern scanner can detect the optimal pattern of its kind. In addition, you can switch on and off individu
Candle hunter
Ruslan Khasanov
5 (1)
Indicador para análisis gráfico. Marca los principales patrones de velas japonesas en el gráfico. Por el momento, el siguiente conjunto de patrones está disponible para el comerciante:  - Bearish/Bullish Abandoned Baby;  - Bearish Advance Block;  - Bearish Deliberation;  - Bearish/Bullish Belt Hold;  - Bearish/Bullish Engulfing;  - Bearish Shooting Star;  - Bearish Evening Star;  - Bearish Evening Doji Star;  - Bearish/Bullish Doji Star;    - Bearish/Bullish Tri-Star;  - Bearish Hanging Man;  -
This plots  Fibonacci deviation levels above and below a moving average of the price. Companion indicator to the " Golden Bull Wave Trader "  expert advisor which uses volume\price trend to determine price reversals. https://www.mql5.com/en/market/product/56291 The expert advisor and this indicator were created in order to: Identify ideal and repeatable trade entries with high level of certainty Create a day trading strategy which doesn’t require a hard SL and TP Use alternate risk management me
Mean Reversion Supply Demand Indicator Mean Reversion Supply Demand is the indicator to detect the important supply demand zone in your chart. The concept of supply demand trading relies on the quantity mismatching between buying and selling volumes in the financial market. Typically, supply demand zone serves to predict the turning point. The wave pattern, for any supply demand zone to work as an successful trade, looks like the price must touch the base zone, move away and then return to zone
Was: $249  Now: $99   Market Profile defines a number of day types that can help the trader to determine market behaviour. A key feature is the Value Area, representing the range of price action where 70% of trading took place. Understanding the Value Area can give traders valuable insight into market direction and establish the higher odds trade. It is an excellent addition to any system you may be using. Inspired by Jim Dalton’s book “Mind Over Markets”, this indicator is designed to suit the
El indicador calcula y traza automáticamente los niveles de soporte y resistencia de Fibonacci, una de las herramientas más efectivas para el análisis de mercado. El cálculo utiliza los datos de precios promediados para el período y el marco de tiempo seleccionados. El mínimo y el máximo para este período se toman como inicio y final del movimiento. Los niveles de Fibonacci le permiten ver puntos de referencia potenciales, alrededor de los cuales el movimiento del precio puede ralentizarse o rev
Owl Smart Levels MT5
Sergey Ermolov
4.47 (36)
Versión MT4  |  FAQ El Indicador Owl Smart Levels es un sistema comercial completo dentro de un indicador que incluye herramientas de análisis de mercado tan populares como los fractales avanzados de Bill Williams , Valable ZigZag que construye la estructura de onda correcta del mercado y los niveles de Fibonacci que marcan los niveles exactos de entrada. en el mercado y lugares para tomar ganancias. Descripción detallada de la estrategia Instrucciones para trabajar con el indicador Asesor de c
The Accumulation / Distribution is an indicator which was essentially designed to measure underlying supply and demand. It accomplishes this by trying to determine whether traders are actually accumulating (buying) or distributing (selling). This indicator should be more accurate than other default MT5 AD indicator for measuring buy/sell pressure by volume, identifying trend change through divergence and calculating Accumulation/Distribution (A/D) level. Application: - Buy/sell pressure: above
Bienvenido al indicador de reconocimiento Ultimate Harmonic Patterns Este indicador detecta el patrón de Gartley, el patrón de murciélago y el patrón de cifrado en función de HH y LL de la estructura de precios y los niveles de Fibonacci, y cuando se alcanzan ciertos niveles de fib, el indicador mostrará el patrón en el gráfico. Este indicador es una combinación de mis otros 3 indicadores que detecta patrones avanzados Características : Algoritmo avanzado para detectar el patrón con alta precisi
An indicator of pattern #30 ("Island Reversal") from Encyclopedia of Chart Patterns by Thomas N. Bulkowski (two gaps, the second gap is in the direction of the first one). Parameters: Alerts - show alert when an arrow appears   Push - send a push notification when an arrow appears (requires configuration in the terminal) GapSize - minimum gap size in points ArrowType - a symbol from 1 to 17 ArrowVShift - vertical shift of arrows in pixels ShowLevels - show levels ColUp - color of an upward line
Los Patrones Armónicos son ideales para predecir puntos de giro en el mercado. Estos patrones ofrecen una alta tasa de éxito y numerosas oportunidades de operación en un solo día de trading. Nuestro indicador identifica los Patrones Armónicos más populares basados en los principios descritos en la literatura de Trading Armónico. NOTAS IMPORTANTES: El indicador no repinta, no se retrasa (detecta un patrón en el punto D) y no se redibuja (el patrón es válido o cancelado). CÓMO USARLO: Arrastre y s
The balance of supply and demand is a simple and effective market analysis method. The supply and demand diagram can show you in advance, even before the trend reversal, where the supply ends and the demand is already emerging, where the demand ends and the supply is emerging, while substantially increasing the probability of making a deal in the right direction and with a high profit factor. Indicator signals The indicator uses the price/volume values to generate signals: ED – excess demand.
Surf Board
Mohammadal Alizadehmadani
Benefits of the Surfboard indicator : Entry signals without repainting If a signal appears and is confirmed, it does NOT disappear anymore, unlike indicators with repainting, which lead to major financial losses because they can show a signal and then remove it. perfect opening of trades The indicator algorithms allow you to find the Peak and floor position to enter a deal (buy or sell an asset), which increases the success rate for each and every trader using it. Surfboard works with any asse
Prices move for many reasons and these can vary from one operator to another: software, private and institutional traders simultaneously contribute to the formation of the price, making predictive art very difficult. However, there are measurable factors that bind the price to an underlying trend in line with the physical reality that the financial asset represents: these are the macroeconomic indicators. Large investors use this information wisely to set their strategies. Understanding these m
Renko Plus
Eadvisors Software Inc.
With Renko Plus you can use the features in the Indicator functionality, just add it to the Metatrader5 chart.             The Renko chart is a type of chart, developed by the Japanese, that is constructed using price movement rather than standardized prices and time intervals like most charts. It is believed to be named after the Japanese word for bricks, "renga", as the graphic looks like a series of bricks.             A new brick is created when the price moves a specified p
Fractal 358 Plus
Renato Fridschtein
Fractal 358 Plus is a predictive indicator that provides the clearest sight of price movements. Identifying graphic patterns such as Caixote (Crate), Pivot and Inside Candle , it shows entries and exits spots, as well as threats to your trades in the markets. It comes ready to use with B3 Mini Index (WIN$ series) and can be adjusted to use with any asset and timeframe. Fractal 358 unravels price movement Based on the Fibonacci sequence, Fractal 358 is a new and different way of reading and un
WAPV Weis Wave Chart Forex
Eduardo Da Costa Custodio Santos
El Weis Wave Chart Forex para MT5 es un indicador de precio y volumen. La lectura de Precio y Volumen fue ampliamente difundida a través de Richard Demille Wyckoff en base a las tres leyes creadas por él: Oferta y Demanda, Causa y Efecto y Esfuerzo vs. Resultado. En 1900, R.Wyckoff ya utilizaba el gráfico de ondas en sus análisis. Muchos años después, alrededor de 1990, David Weis Automatizó el gráfico de ondas de R. Wyckoff y hoy os traemos la evolución del gráfico de ondas de David Weis. Muest
M & W Pattern Pro is an advanced scanner for M and W patters , it uses extra filters to ensure scanned patterns are profitable. The indicator can be used with all symbols and time frames. The indicator is a non repaint indicator with accurate statistics calculations. To use , simply scan the most profitable pair using the statistics dashboard accuracy , then enter trades on signal arrow and exit at the TP and SL levels. STATISTICS : Accuracy 1 : This is the percentage of the times price hit
An indicator of pattern #31 ("Long Island") from Encyclopedia of Chart Patterns by Thomas N. Bulkowski. The second gap is in the opposite direction. Parameters: Alerts - show alert when an arrow appears   Push - send a push notification when an arrow appears (requires configuration in the terminal) GapSize - minimum gap size in points ArrowType - a symbol from 1 to 17 ArrowVShift - vertical shift of arrows in points   ShowLevels - show levels ColUp - color of an upward line ColDn - color of a
"Support and Resistance" is a fundamental concept in technical analysis for trading stocks, currencies, or other assets in financial markets. Here's how to use it: Identifying Support Support is a price level where buying is strong. When the price drops to this level, there tends to be significant buying activity, preventing the price from falling further. Identifing Support: Look for the lowest points in a given period and find levels where the price has bounced back up multiple times. Usage:
Los compradores de este producto también adquieren
Primero que todo, vale la pena enfatizar que este Sistema de Trading es un Indicador No Repintado, No Redibujado y No Retrasado, lo que lo hace ideal tanto para el trading manual como para el automatizado. El "Sistema de Trading Inteligente MT5" es una solución completa de trading diseñada para traders nuevos y experimentados. Combina más de 10 indicadores premium y presenta más de 7 estrategias de trading robustas, lo que lo convierte en una opción versátil para diversas condiciones del merca
Atomic Analyst MT5
Issam Kassas
4.27 (11)
En primer lugar, vale la pena enfatizar que este Indicador de Trading no repinta, no redibuja y no se retrasa, lo que lo hace ideal tanto para el trading manual como para el automatizado. El Analista Atómico es un Indicador de Acción del Precio PA que utiliza la fuerza y el impulso del precio para encontrar una mejor ventaja en el mercado. Equipado con filtros avanzados que ayudan a eliminar ruidos y señales falsas, y aumentan el potencial de trading. Utilizando múltiples capas de indicadores
FX Volume MT5
Daniel Stein
4.94 (17)
Obtenga su actualización diaria del mercado con detalles y capturas de pantalla a través de nuestro Morning Briefing aquí en mql5 y en Telegram ! FX Volume es el PRIMER y ÚNICO indicador de volumen que proporciona una visión REAL del sentimiento del mercado desde el punto de vista de un bróker. Proporciona una visión impresionante de cómo los participantes institucionales del mercado, como los brokers, están posicionados en el mercado Forex, mucho más rápido que los informes COT. Ver esta info
Quantum Trend Sniper
Bogdan Ion Puscasu
5 (37)
Introduciendo       Indicador Quantum Trend Sniper   , el innovador indicador MQL5 que está transformando la forma en que identificas y negocias los cambios de tendencia. Desarrollado por un equipo de comerciantes experimentados con experiencia comercial de más de 13 años,       Indicador de francotirador de tendencia cuántica       está diseñado para impulsar su viaje comercial a nuevas alturas con su forma innovadora de identificar cambios de tendencia con una precisión extremadamente alta.
Gold Stuff mt5
Vasiliy Strukov
4.89 (166)
Gold Stuff mt5: un indicador de tendencia diseñado específicamente para el oro, también se puede usar en cualquier instrumento financiero. El indicador no se vuelve a dibujar ni se retrasa. El marco de tiempo recomendado es H1. IMPORTANTE! Póngase en contacto conmigo inmediatamente después de la compra para obtener instrucciones y bonificación! PARÁMETROS Draw Arrow-incl.desactivado. dibujar flechas en el gráfico. Alerts-incl.desactivado.alertas de sonido. E-mail notification-incl.desacti
Trend Screener Pro MT5
STE S.S.COMPANY
4.89 (61)
Desbloquee el poder del comercio de tendencias con el indicador Trend Screener: ¡su solución definitiva para el comercio de tendencias impulsada por lógica difusa y un sistema multidivisa!Mejore su comercio de tendencias con Trend Screener, el revolucionario indicador de tendencias impulsado por lógica difusa. Es un poderoso indicador de seguimiento de tendencias que combina más de 13 herramientas y funciones premium y 3 estrategias comerciales, lo que lo convierte en una opción versátil para co
RelicusRoad Pro MT5
Relicus LLC
4.82 (22)
Ahora $ 147 (aumentando a $ 499 después de algunas actualizaciones) - Cuentas ilimitadas (PC o Mac) Manual de usuario de RelicusRoad + Videos de capacitación + Acceso al grupo privado de Discord + Estado VIP UNA NUEVA MANERA DE VER EL MERCADO RelicusRoad es el indicador comercial más poderoso del mundo para divisas, futuros, criptomonedas, acciones e índices, y brinda a los comerciantes toda la información y las herramientas que necesitan para mantenerse rentables. Brindamos análisis téc
Ante todo, vale la pena enfatizar que esta Herramienta de Trading es un Indicador No Repintado, No Redibujado y No Retrasado, lo que la hace ideal para el trading profesional. El Indicador de Conceptos de Acción del Precio Inteligente es una herramienta muy potente tanto para traders nuevos como experimentados. Combina más de 20 indicadores útiles en uno solo, combinando ideas avanzadas de trading como el Análisis del Trader del Círculo Interior y Estrategias de Trading de Conceptos de Dinero
Este es un genial indicador para MT5 que ofrece señales precisas para entrar en una transacción sin redibujar. Se puede aplicar a cualquier activo financiero: fórex, criptomonedas, metales, acciones, índices. Nos dará valoraciones bastante precisas y nos dirá cuándo es mejor abrir y cerra una transacción. Eche un vistazo  al vídeo  (6:22), ¡contiene un ejemplo de procesamiento de una sola señal que ha amortizado el indicador! La mayoría de los tráders mejoran sus resultados comerciales durante l
FX Power MT5 NG
Daniel Stein
5 (4)
Obtenga su actualización diaria del mercado con detalles y capturas de pantalla a través de nuestro Morning Briefing aquí en mql5 y en Telegram ! FX Power MT5 NG es la nueva generación de nuestro popular medidor de fuerza de divisas, FX Power. ¿Y qué ofrece este medidor de fuerza de nueva generación? Todo lo que le encantaba del FX Power original PLUS Análisis de fuerza de ORO/XAU Resultados de cálculo aún más precisos Períodos de análisis configurables individualmente Límite de cálculo persona
Advanced Supply Demand MT5
Bernhard Schweigert
4.53 (15)
¡Actualmente con 33% de descuento! ¡La mejor solución para cualquier tráder principiante o experto! Este indicador es una herramienta comercial única, de alta calidad y asequible, porque incorpora una serie de características patentadas y una nueva fórmula. Con esta actualización, podrá mostrar zonas de doble marco temporal. No solo podrá mostrar un marco temporal más alto, sino también mostrar ambos, el marco temporal del gráfico MÁS el marco temporal más alto: MOSTRANDO ZONAS ANIDADAS. A todos
Auto Order Block with break of structure based on ICT and Smart Money Concepts Futures Break of Structure ( BoS )             Order block ( OB )            Higher time frame Order block / Point of Interest ( POI )    shown on current chart           Fair value Gap ( FVG ) / Imbalance   ,  MTF      ( Multi Time Frame )    Volume Imbalance     ,  MTF          vIMB Gap’s Equal High / Low’s     ,  MTF             EQH / EQL Liquidity               Current Day High / Low           HOD /
XQ Indicator MetaTrader 5
Marzena Maria Szmit
5 (1)
Step into the realm of Forex trading with confidence and precision using XQ, a cutting-edge Forex indicator designed to elevate your trading game to unprecedented heights. Whether you're a seasoned trader or just stepping into the world of currency exchange, XQ Forex Indicator empowers you with the insights and signals needed to make informed trading decisions. The signal conditions are a combination of three indicators, and XQ Forex Indicator only display  medium and long-term trends . The ind
ICT, SMC, SMART MONEY CONCEPTS, SMART MONEY, Smart Money Concept, Support and Resistance, Trend Analysis, Price Action, Market Structure, Order Blocks, BOS/CHoCH,   Breaker Blocks ,  Momentum Shift,   Supply&Demand Zone/Order Blocks , Strong Imbalance,   HH/LL/HL/LH,    Fair Value Gap, FVG,  Premium  &   Discount   Zones, Fibonacci Retracement, OTE, Buy Side Liquidity, Sell Side Liquidity, BSL/SSL Taken, Equal Highs & Lows, MTF Dashboard, Multiple Time Frame, BigBar, HTF OB, HTF Market Structure
Blahtech Supply Demand MT5
Blahtech Limited
4.57 (14)
Was: $299  Now: $99   Supply Demand uses previous price action to identify potential imbalances between buyers and sellers. The key is to identify the better odds zones, not just the untouched ones. Blahtech Supply Demand indicator delivers functionality previously unavailable on any trading platform. This 4-in-1 indicator not only highlights the higher probability zones using a multi-criteria strength engine, but also combines it with multi-timeframe trend analysis, previously confirmed swings
Conviértase en un Breaker Trader y obtenga beneficios de los cambios en la estructura del mercado a medida que se invierte el precio. El indicador de ruptura de bloque de órdenes identifica cuándo una tendencia o movimiento de precio se acerca al agotamiento y está listo para revertirse. Le alerta sobre cambios en la estructura del mercado que generalmente ocurren cuando una reversión o un retroceso importante están a punto de suceder. El indicador utiliza un cálculo patentado que identific
El Indicador de Cuadrados de Gann es una herramienta poderosa de análisis de mercado basada en el artículo "Fórmula Matemática para Predicciones de Mercado" escrito por W.D. Gann, que se basa en conceptos matemáticos para el análisis. Incorpora elementos de las técnicas de Gann relacionadas con los cuadrados de 144, 90 y 52, así como el cuadrado de 9. Además, incluye el método del  sobre cómo combinar el cuadrado de 9 con canales y patrones de estrellas. Manual del Usuario y Modo de Uso: Antes d
AW Trend Predictor MT5
AW Trading Software Limited
4.76 (54)
La combinación de niveles de tendencia y ruptura en un sistema. Un algoritmo de indicador avanzado filtra el ruido del mercado, determina la tendencia, los puntos de entrada y los posibles niveles de salida. Las señales indicadoras se registran en un módulo estadístico, que le permite seleccionar las herramientas más adecuadas, mostrando la efectividad del historial de señales. El indicador calcula las marcas Take Profit y Stop Loss. Manual e instrucciones ->   AQUÍ   / Versión MT4 ->   AQUÍ Có
The Volume by Price Indicator for MetaTrader 5 features Volume Profile and Market Profile TPO (Time Price Opportunity). Get valuable insights out of currencies, equities and commodities data. Gain an edge trading financial markets. Volume and TPO histogram bar and line charts. Volume Footprint charts. TPO letter and block marker charts including split structures. Versatile segmentation and compositing methods. Static, dynamic and flexible ranges with relative and/or absolute visualizations. Lay
TrendLine PRO MT5
Evgenii Aksenov
4.78 (49)
El indicador Trend Line PRO es una estrategia comercial independiente. Muestra el cambio de tendencia, el punto de entrada a la transacción, así como calcula automáticamente tres niveles de Take Profit y la protección contra la pérdida de Stop Loss Trend Line PRO es perfecto para todos los símbolos de Meta Trader: monedas, metales, criptomonedas, acciones e índices Ventajas de Trend Line PRO: Nunca vuelve a dibujar sus señales Posibilidad de utilizar como estrategia independiente Tiene tres niv
MetaBands M5
Vahidreza Heidar Gholami
4.67 (3)
MetaBands utiliza algoritmos potentes y únicos para dibujar canales y detectar tendencias para que pueda proporcionar a los traders puntos potenciales para entrar y salir de operaciones. Es un indicador de canal junto con un potente indicador de tendencia. Incluye diferentes tipos de canales que se pueden fusionar para crear nuevos canales simplemente utilizando los parámetros de entrada. MetaBands utiliza todos los tipos de alertas para notificar a los usuarios sobre eventos del mercado. Caract
Introduciendo       Quantum Breakout PRO   , el innovador indicador MQL5 que está transformando la forma en que comercia con Breakout Zones. Desarrollado por un equipo de comerciantes experimentados con experiencia comercial de más de 13 años,       Desglose cuántico PRO       está diseñado para impulsar su viaje comercial a nuevas alturas con su innovadora y dinámica estrategia de zona de ruptura. El indicador de ruptura cuántica le dará flechas de señal en las zonas de ruptura con 5 zonas
Gartley Hunter Multi
Siarhei Vashchylka
5 (5)
Gartley Hunter Multi - An indicator for searching for harmonic patterns simultaneously on dozens of trading instruments and on all classic timeframes: (m1, m5, m15, m30, H1, H4, D1, Wk, Mn). Manual (Be sure to read before purchasing) | Version for MT4 Advantages 1. Patterns: Gartley, Butterfly, Shark, Crab. Bat, Alternate Bat, Deep Crab, Cypher 2. Simultaneous search for patterns on dozens of trading instruments and on all classic timeframes 3. Search for patterns of all possible sizes. Fr
Trend Line Map Pro MT5
STE S.S.COMPANY
4.67 (9)
El indicador Trend Line Map es un complemento para Trend Screener Indicator. Funciona como un escáner para todas las señales generadas por el evaluador de tendencias (Trend Line Signals). Es un escáner de líneas de tendencia basado en el indicador de evaluación de tendencias. Si no tiene el indicador Trend Screener Pro, Trend Line Map Pro no funcionará. It's a Trend Line Scanner based on Trend Screener Indicator. If you don't have Trend Screener Pro Indicator,     the Trend Line Map Pro will
TrendDecoder Premium MT5
Christophe, Pa Trouillas
5 (1)
Identifique los rangos y los próximos movimientos probables  |  Obtenga las señales más tempranas y la fuerza de las Tendencias   |  Obtener salidas claras antes de reversión   |  Detecte los niveles de Fibo que el precio pondrá a prueba   |  Indicador no repintado y no retardado - ideal para la trading manual y automatizada - adecuado para todos los activos y todas las unidades temporales 69$   para el lanzamiento - luego de nuevo a >>   $ 149 Después de la compra,   póngase en contacto con mi
TPSpro TRENDPRO  - is a trend indicator that automatically analyzes the market and provides information about the trend and each of its changes, as well as giving signals for entering trades without redrawing! The indicator uses each candle, analyzing them separately. referring to different impulses - up or down impulse. Exact entry points into transactions for currencies, crypto, metals, stocks, indices!  -  Version MT4                  DETAILED DESCRIPTION        /       TRADING SETUPS       
Golden Spikes Detector
Batsirayi L Marango
5 (1)
Golden Spikes Detector Este indicador se basa en una estrategia avanzada principalmente para negociar picos en índices de auge y caída. Se implementaron algoritmos complejos para detectar únicamente entradas de alta probabilidad. Alerta sobre posibles entradas de Compra y Venta. Para negociar picos en el corredor Deriv o Binary, solo acepte las alertas Buy Boom y Sell Cash. Se optimizó para cargarse en un período de tiempo de 5 minutos, aunque se realiza un análisis de múltiples períodos de tiem
Matrix Arrow Indicator MT5
Juvenille Emperor Limited
5 (14)
Matrix Arrow Indicator MT5   es una tendencia única 10 en 1 que sigue un indicador   100% sin repintado   de marcos temporales múltiples que se puede usar en todos los símbolos/instrumentos:   divisas ,   materias primas ,   criptomonedas ,   índices ,   acciones .  Matrix Arrow Indicator MT5  determinará la tendencia actual en sus primeras etapas, recopilando información y datos de hasta 10 indicadores estándar, que son: Índice de movimiento direccional promedio (ADX) Índice de canales de prod
IX Power MT5
Daniel Stein
5 (2)
IX Power   lleva por fin la insuperable precisión de FX Power a los símbolos que no son de Forex. Determina con exactitud la intensidad de las tendencias a corto, medio y largo plazo de tus índices, acciones, materias primas, ETF e incluso criptodivisas favoritas. Puede   analizar todo lo   que su terminal le ofrece. Pruébalo y experimenta cómo   tu timing mejora significativamente   a la hora de operar. Características principales de IX Power Resultados de cálculo 100% precisos y sin rep
Strong Support mt5
Vasiliy Strukov
5 (9)
Los niveles de soporte y resistencia han sido durante mucho tiempo la herramienta más poderosa para el análisis del mercado. Strong Support el indicador construye los niveles de soporte en los mínimos locales del precio, y los niveles de resistencia en los máximos locales del precio. Mis otros desarrollos se pueden ver aquí Se recomienda usar junto con el indicador de tendencia, por ejemplo, Gold Stuff : esto le permitirá operar en la tendencia y al mismo tiempo determinar las zonas de cons
Otros productos de este autor
Introducing the "ADX VMA" Forex indicator for MT5 – a powerful tool combining the Average Directional Movement Index (ADX) and Volume-weighted Moving Average (VMA) to pinpoint market trends. Tailored for Metatrader 5, this indicator adapts to changing market volatility. Key Features: - Provides clear buy/sell signals for any currency pair and trading style. - Displays a dual-colored histogram beneath the main chart. - Simple buy logic: Green histogram indicates a bullish trend. - Simple sell
MT5 RSI Experiment: This indicator leverages the Relative Strength Index (RSI) and floating levels to pinpoint potential buy and sell signals. The code uses enums for prices and RSI calculation methods. These enums define indicator parameters. Input variables include RSI period, price type for RSI calculation, smoothing method, and look-back period with levels for floating levels. Index buffers store RSI fill, RSI up line, RSI middle line, RSI down line, and trend line data. For each ba
The MT4 Channel Standard Deviation Indicator automatically plots support and resistance channels on the price chart using price standard deviation. It indicates BULLISH and BEARISH market conditions and is suitable for both new and advanced forex traders. This indicator offers support, resistance, entry, and exit levels, along with stop-loss and take-profit points. It accurately identifies BULLISH and BEARISH market trends, making it effective for both intraday and long-term trading across va
ADX MA: The Ultimate Trend Strength Guide In forex trading, the Average Directional Index (ADX) is a vital indicator for gauging trend strength. Here's a streamlined approach to using ADX for effective trading: 1. Add ADX to your forex chart. 2. Interpret ADX values: <20 is weak, >40 is strong. 3. Identify trend direction: +DI above -DI indicates an upward trend, and vice versa. 4. Execute trades based on ADX and trend: Strong up trend, consider buying; strong down trend, consider selling;
In Forex trading, understanding support and resistance is crucial. Virtually every trading strategy incorporates these levels. MetaTrader lacks built-in support and resistance calculation features, but there's a solution— the Support and Resistance Lines indicator. This powerful MetaTrader indicator automatically calculates and displays support and resistance levels for any chosen currency pair or trading instrument. Benefits of the Support and Resistance Lines indicator: 1. Identify be
This pass-band oscillator reduces lag in market data by filtering out high and low frequencies. It uses two EMAs (Exponential Moving Averages) with periods of 40 and 60. Trigger points are added using an RMS cyclic envelope over the Signal line. The pass-band waveform output is calculated by summing its square over the last 50 bars and taking the square root to create trigger levels. Buy when the pass-band crosses above its -RMS line and short when it crosses below the RMS line. The indicat
The Waddah Attar Explosion (WAE) indicator is a potent tool in Forex trading, offering buy, sell, exit buy, and exit sell signals. It assesses trends as trend power and momentum as explosion power. Trend Direction: - Green bars indicate a bullish trend. - Red bars indicate a bearish trend. Signal Line: - A line serves as a threshold for momentum. Buy Trade Setup: **Entry:** Go long when a green bar crosses above the threshold. Place a stop loss below the entry candle. **Exit:** Close the
In MetaTrader, TP & SL values aren't visible when hovering over corresponding lines. Our indicator fixes this by showing values on-screen. It displays defined SL and TP values in your account currency, facilitating easy tracking of positions. Note : The indicator estimates values, excluding commissions, and allows customization of colors and distance from SL/TP lines.
Introducing ZigZag Extras MT4, a Forex indicator that simplifies market analysis: - Visualizes highest highs and lowest lows over a specified "Depth" period. - Highlights potential reversal points with filled blue and red dots. - Optional display of BreakOut points, indicating probable peaks and bottoms. - Helps avoid common pitfalls of mistaking repainted points for market tops or bottoms. - Designed to enhance understanding and serve as signals for various trading strategies. Instructions
Trend channels are vital tools in technical analysis for identifying optimal buy or sell points.   -   Upper Line:   Marks resistance. -   Lower Line:   Marks support. - Tops and bottoms of channels indicate potential support or resistance zones.   -   Bearish Channels:   Negative slope (down). -   Bullish Channels:   Positive slope (up).     Creating Channels: -   Up Channel:   Draw a parallel line matching the uptrend angle, touching the latest peak. -   Down Channel:   Draw a parallel line ma
What are Heiken Ashi Candles? Heiken Ashi, derived from the Japanese term 'Heikin Ashi,' translates to average price bars. It's an indicator depicting price bars on a chart. Formula for Heiken Ashi candles: - Heiken Ashi opening price: (previous candle's opening + closing price) / 2 - Closing price Heiken Ashi: (opening + high + low + closing) / 4 - Heiken Ashi peak: Max of high, opening, or closing price - Heiken Ashi bottom price: Min of low, opening, or closing price How to Read Heik
SDL Trend Signals is a custom MQL4 indicator named "Slope Direction Line" for MetaTrader 4. It employs weighted and simple moving averages to create customizable trend lines on charts. Using two trend line buffers (Uptrend and Downtrend) and one for indicator values (ExtMapBuffer), the indicator calculates trend lines. Bullish slopes appear in BLUE, signaling an upward trend, while Bearish slopes are in RED, indicating a downward trend. In a Bullish trend, traders can enter a BUY position w
The Dot on Histogram Trend indicator is a straightforward tool in forex trading. When used in conjunction with other indicators, it can be highly rewarding. The indicator consists of a blue and red histogram, representing positive and negative territories, respectively. Buy opportunities arise when the histogram is positive, while sell opportunities emerge when it's negative. Signal Steps: 1. Dot at Zero Level:    - Green Dot: Indicates a clear uptrend; take action.    - Red Dot: Do nothi
The Support Resistance Active indicator for MT4 identifies highs and lows across various timeframes, displaying support and resistance lines. Notably, previously tested highs and lows are eliminated to avoid clutter on the chart. This indicator focuses on weekly and daily levels, termed as sell zones and buy zones. It draws support or resistance lines (fractal lines) for these zones. Tested areas are visually connected with a line, enhancing clarity on the chart. The indicator is Multi-Time
This pass-band oscillator seeks to pass-band out both high and low frequencies from market data to eliminate wiggles from the resultant signal thus significantly reducing lag. This pass-band indicator achieves this by using 2 differenced EMA's of varying periods. (40 and 60). Trigger points for the pass-band oscillator are added with a RMS cyclic envelope over the Signal line. Output of the pass-band waveform is calculated by summing its square over the last 50 bars and taking the square root of
The SDL Trend Signals MT5 indicator shows the market direction with a colored moving average line. It has three inputs: Period (calculation period), Method (calculation method), and Applied price (price used for calculations). The indicator has three buffers: Uptrend, Downtrend, and ExtMapBuffer (for indicator values). The Bullish slope is in BLUE, and the Bearish slope is in RED. For example, an upward slope indicates a Bullish market (Blue), and a downward slope indicates a Bearish market (
The Hurst Exponent gauges a time series' long-term memory and is named after Harold Edwin Hurst. The MetaTrader's Hurst Exponent Indicator analyzes an asset's price memory, helping predict future trends. It's valuable for traders of all levels, suitable for various styles like scalping or swing trading. In Forex terms, the Hurst Exponent measures a series' dependence, indicating whether it regresses to the mean or clusters in a direction. H values between 0.5-1 suggest positive autocorrelatio
Smoothed Repulse Alert MT5 Indicator The Smoothed Repulse Alert for MT5 is a powerful tool that visualizes market pressure through a filled area chart and two lines in a separate window. This indicator is based on the repulse indicator, assessing buying and selling pressure using high, low, open, and close prices over a specified period. Key Features: - Customizable parameters include repulse period, moving average type, moving average multiplier, level period, upper and lower levels. - Col
Filtro:
No hay comentarios
Respuesta al comentario