• Información general
  • Comentarios
  • Discusión

Yesterday High Low

The "Yesterday High Low" indicator for the MetaTrader 4 (MT4) trading platform is a powerful tool designed to help traders identify key price levels from the previous trading day. This indicator provides a visual representation of the high prices, low prices, high/low price averages, and intermediate average levels on the chart.

Primarily used by institutional and professional traders, this indicator offers an instant view of price levels that are often considered crucial in financial markets. Here is a detailed description of its main features:

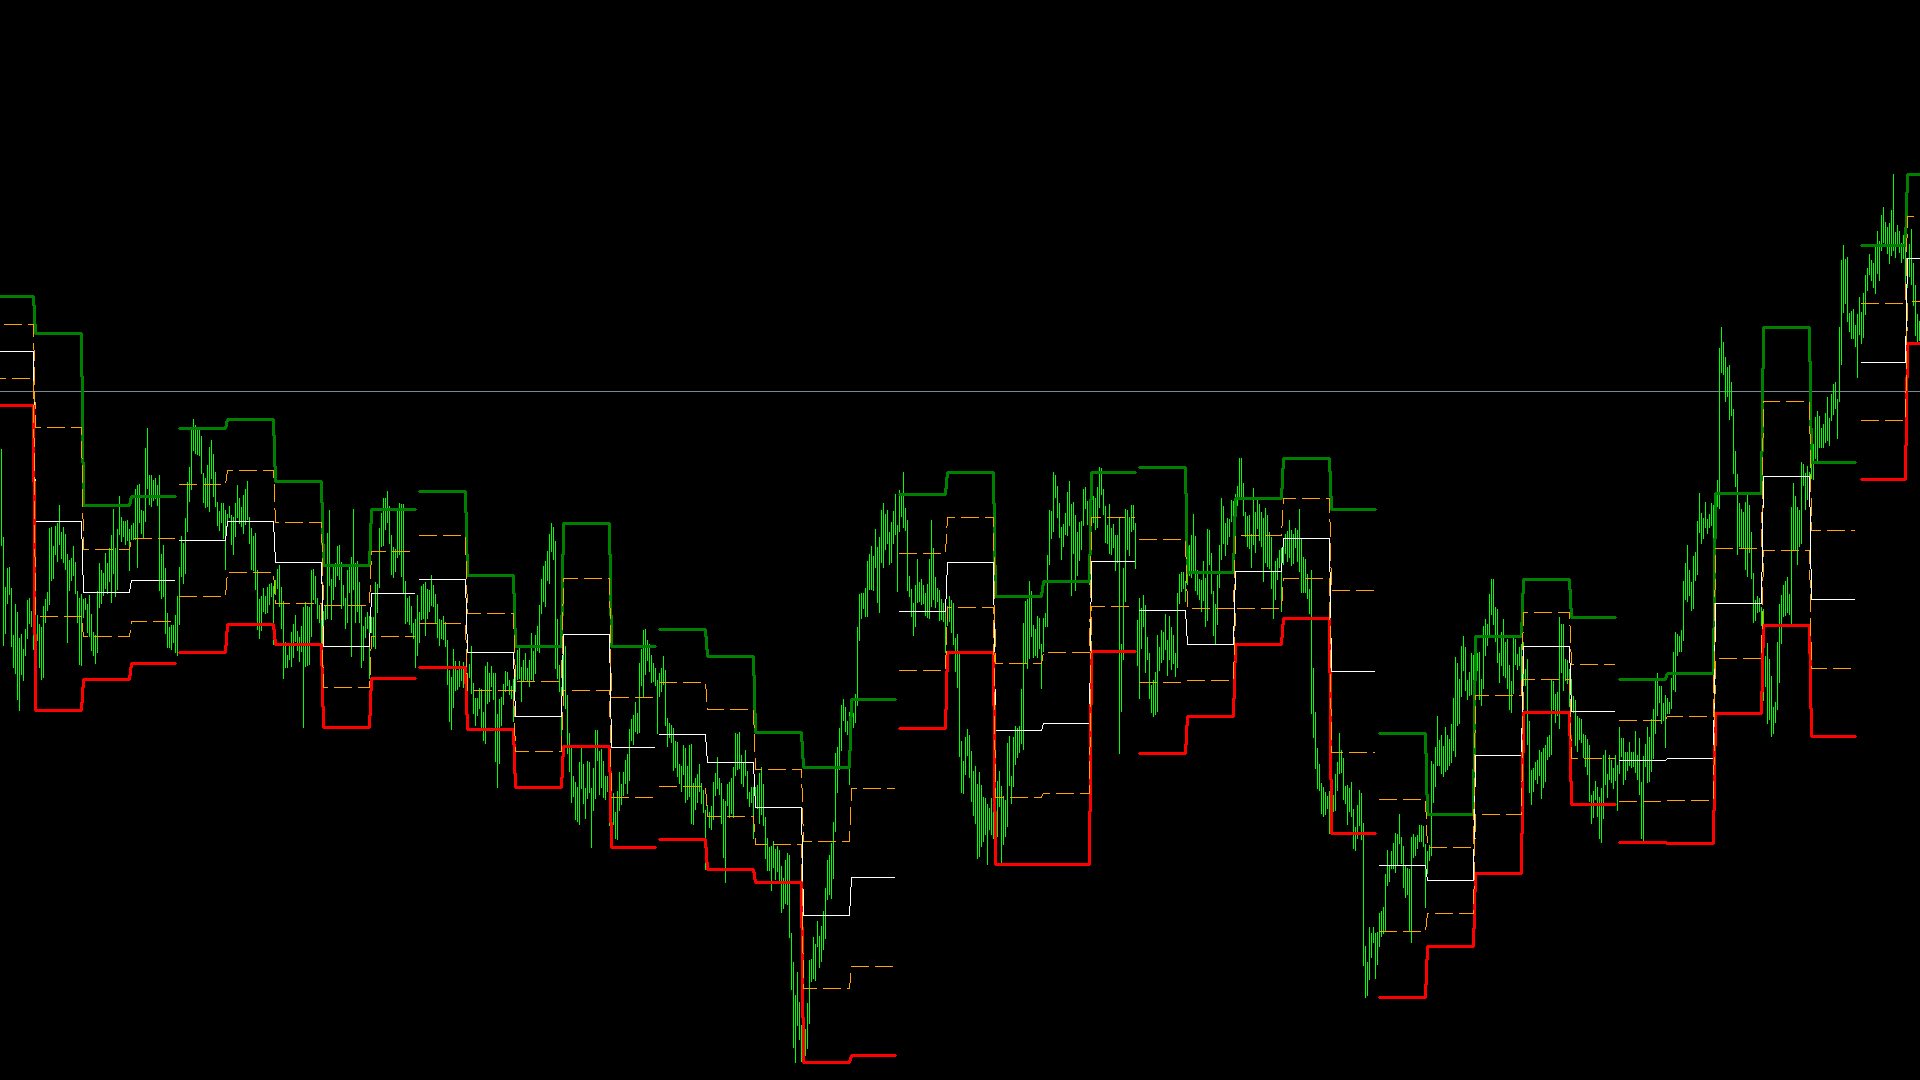
1. **Previous Day High Price:** The indicator draws a horizontal line to represent the highest price reached during the previous trading session. This level is often seen as a potential resistance.

2. **Previous Day Low Price:** Another horizontal line is drawn to indicate the lowest price reached during the previous day. This level is typically interpreted as potential support.

3. **Average of High/Low Prices:** The indicator also calculates the average of high prices and the average of low prices from the previous day. These averages provide a more comprehensive view of the price range from the previous day.

4. **Intermediate Averages:** In addition to high and low prices and their averages, the indicator can also display intermediate averages, creating additional reference levels on the chart.

Using this indicator can help traders anticipate areas where institutional and professional trader activity is likely to increase. These key price levels can serve as decision points for traders, helping them make informed decisions regarding their entries and exits, as well as risk management.

In summary, the "Yesterday Day High Low" indicator for MT4 is an invaluable tool for traders looking to analyze important price levels from the previous day, which can enhance their trading performance by identifying potential support and resistance zones in financial markets.
Productos recomendados
Market Ticker Free
John Louis Fernando Diamante
5 (1)
A scrolling Market Ticker that displays price changes from all symbols in the Market Watch list. Provides an easy snapshot of symbol prices, and keeps scrolling automatically while you trade and analyse the chart. Options include: - MTF, eg choose to show price changes of the daily chart, or the hourly - use the live candle or the recently completed - font and background coloring
FREE
Wise Men Indicator demo
Bohdan Kasyanenko
3.67 (3)
The indicator displays signals according to the strategy of Bill Williams on the chart. Demo version of the indicator has the same features as the paid, except that it can work only on a demo account . Signal "First Wise Man" is formed when there is a divergent bar with angulation.  Bullish divergent bar - with lower minimum and closing price in the upper half. Bearish divergent bar - higher maximum and the closing price at the bottom half. Angulation is formed when all three lines of Alligat
FREE
Email Drawdown Alert
Roman Starostin
5 (15)
Free informative Indicator-helper. It'll be usefull for traders who trade many symbols or using grid systems (Averaging or Martingale). Indicator counts drawdown as percent and currency separate. It has a number of settings: Count deposite drawdown according equity value and send e-mail or notifications to user if DD more than set; Sending e-mail when max open orders reached; Shows price and remaining pips amount before MarginCall on current chart and Account generally; Display summary trade lot
FREE
Perspect
Matimu Romeo Ngoveni
Perspect EA This version of the EA focusses on indicating points of interest on the chart, features include : Sessions (Asia/Gap/London/Gap/NewYork/Gap) Previous Daily/Weekly/Monthly highs and  lows  Previous Daily/Weekly/Monthly open and close price Round numbers (Ruler) Opening range Initial balance Multi time frame (Yearly view, monthly opening range) Customizable chart templates for low light users   The indicator will assist in advanced technical analysis, providing the user with desi
Telegram Alerts
Gad Benisty
4.8 (25)
This application is now replaced by Ofir Notify Light Edition (Free) or Ofir Notify (paid). Thank all for your positive feedbacks. Ofir Notify is a tool which send alerts on trades to Telegram Alert on any event concerning a position : Opening, Closing, modification (SL, TP) Send alerts to Chats, Groups and Channel Alert on Equity change Display Risk, Reward and progress of profit/lost for each position Customization of alerts ( only in full edition ) Sending charts screenshots with alerts 
FREE
Top Currency Strength
Madzhid Forgani
5 (1)
This indicator is one of the useful tools for traders who trade on currency pairs and based on the strength of each currency they can make a correct decision or confirmation in the positions.  It has been calculated for all the minor currency pairs supported by the broker and displays the values of the major currencies. These currencies are displayed horizontally or vertically according to the trader's config when executing the indicator. One of the trading strategies that can be used is to cho
FREE
Follow The Line
Oliver Gideon Amofa Appiah
4 (13)
FOLLOW THE LINE GET THE FULL VERSION HERE: https://www.mql5.com/en/market/product/36024 This indicator obeys the popular maxim that: "THE TREND IS YOUR FRIEND" It paints a GREEN line for BUY and also paints a RED line for SELL.  It gives alarms and alerts of all kinds. IT DOES NOT REPAINT and can be used for all currency pairs and timeframes. Yes, as easy and simple as that. Even a newbie can use it to make great and reliable trades. NB: For best results, get my other premium indicators for more
FREE
HMA Trend
Pavel Zamoshnikov
4.6 (80)
A trend indicator based on the Hull Moving Average (HMA) with two periods. The Hull Moving Average is an improved variant of the moving average, which shows the moment of trend reversal quite accurately. It is often used as a signal filter. Combination of two types of Hull Moving Averages makes a better use of these advantages: HMA with a slow period identifies the trend, while HMA with a fast period determines the short-term movements and signals in the trend direction. Features The movement
FREE
We stopped creatin small tools for MT4. Our focus are on MT5. Only very useful tools maybe we will develop to MT5. New Candle Alert is a simple indicator that notify you when a new candle is formed. You can modify the  notification message that will appear for you. The alarm sound is default by meta trader program. MT5 version:  https://www.mql5.com/pt/market/product/37986 Hope you enjoy it. Any doubt or suggestions please notify on private or by comments. See ya.
FREE
MQLTA Support Resistance Lines is an indicator that calculates the historical levels of Support and Resistance and display them as Lines on chart. It will also Alert you if the price is in a Safe or Dangerous zone to trade and show you the distance to the next level. The indicator is ideal to be used in other Expert Advisor through the iCustom function. This DEMO only works with AUDNZD, the full product can be found at https://www.mql5.com/en/market/product/26328 How does it work? The indicato
FREE
Heiken Ashi Button
Lee Teik Hong
4.83 (6)
Heiken Ashi Button Heiken-Ashi , often spelled Heikin-Ashi, is a Japanese word that means "Average Bar." The Heiken-Ashi approach can be used in conjunction with candlestick charts to spot market trends and forecast future prices. It's useful for making candlestick charts easier to read and analysing patterns. Traders can use Heiken-Ashi charts to determine when to stay in trades while the trend continues and close trades when the trend reverses. The majority of earnings are made when markets a
FREE
The ' Session Spreads ' indicator was created to show spreads, their instances and averages, over the seven main sessions. This shows the most average & useful spreads occurring the most on the seven main sessions on chart, and via/CSV files. Key Features 7 Sessions automatically adjusted to the broker GMT & DST for logging spreads. Spreads logged per session with overlays equally processed on all applicable. Instances of spreads logged per spread amount that shows the most average. Average spr
FREE
Sell and Buy Points On Chart
Fawwaz Abdulmantaser Salim Albaker
Este EA ayuda a los comerciantes en los siguientes beneficios: - mostrar el punto de entrada para las órdenes de compra o venta que realiza. -muestra los niveles de TP y SL en el gráfico - controlar el tamaño del lote - controlar el nivel de TP y SL en puntos - funciona en todo el período gráfico - aumento del rango comercial de algo en su señal - cerrar todas las ofertas con un solo clic - cerrar solo tratos rentables - cerrar solo comerciantes perdedores
FREE
MASi Three Screens
Aleksey Terentev
5 (2)
MASi Three Screens is based on the trading strategy by Dr. Alexander Elder. This indicator is a collection of algorithms. Algorithms are based on the analysis of charts of several timeframes. You can apply any of the provided algorithms. List of versions of algorithms:     ThreeScreens v1.0 - A simple implementation, with analysis of the MACD line;     ThreeScreens v1.1 - A simple implementation, with analysis of the MACD histogram;     ThreeScreens v1.2 - Combines the first two algorithms
FREE
Save Template
Dominik Kaczorowski
A very fast way to save your chart template. Set the keyboard shortcut to further speed up the operation. The script allows you to save a template with a specific prefix, with the current date or with the chart timeframe. The symbol is saved automatically. Script parameters: Prefix - prefix for the template name. Can be empty. With date - true = template name will containt current date With timeframe - true = template name will containt timeframe of the current chart
FREE
UPD1 Impulse Channel
Vitaliy Kuznetsov
5 (8)
El indicador de canal está en tendencia y no se repinta. Crea un canal de precios ATR con el borde de volatilidad opuesto. El indicador ha demostrado su eficacia en la estrategia de negociación en niveles de impulso y rupturas falsas. El punto de entrada debe buscarse en la corrección de la línea indicadora y la toma de ganancias debe establecerse en el borde opuesto. Blog-Link -  Retest and Fake Breakout with UPD1 . Parámetros de entrada. Bars Count   - historial para mostrar. ATR   - perío
FREE
Virtual Targets
Hoang Van Dien
3.83 (6)
This indicator is very useful for day traders or short term traders. No need to calculate the number of pips manually, just look at the chart and you will see the Virtual Take Profit / Virtual Stop Loss target line and evaluate whether the entry point is feasible to reach the intended target or not. Enter the intended Take Profit / Stop Loss pips for your trade. The indicator will display Virtual Take Profit / Virtual Stop Loss lines for you to easily see if the target is feasible or not.
FREE
如果产品有任何问题或者您需要在此产品上添加功能,请联系我 Contact/message me if you encounter any issue using the product or need extra feature to add on the base version. To access the full version, please re-direct to this LINK . To access the single pair version, please re-direct to this LINK . Price is likely to pullback or breakout at important support and/or resistance. This dashboard is designed to help you monitor these critical support and resistance area. Once price moves close to these important support and res
FREE
Market Sessions Time MT4
Juan Facundo Valdes
3.25 (4)
Muestra la sesión actual de los principales mercados y el tiempo restante para iniciar las siguientes. Mercados Nueva York Londres Fráncfort Tokio Sídney 1 sesión más con nombre personalizado, hora de apertura y cierre Hora del reloj GMT/UTC Local (desde la computadora) Broker (hora del servidor) La hora predeterminada en la configuración es GMT. Después de cambiar a la hora local o del corredor, es necesario ajustar la hora de apertura y cierre de cada sesión manualmente según el tipo de
FREE
List of buttons to switch between symbols on multiple charts 1. Set x, y coordinates (horizontal, vertical) for list of buttons. 2. Show/hide buttons by clicking button or keypress. 3. The number of columns of the button list. 4. The color of the buttons and the color of the current symbol button. 5. The button list is separated by commas. If the list is empty, the indicator takes the list of symbols in the Market Watch. 6. Set the keypress to show and hide the list of buttons. 7. Multiple Char
FREE
WONNFX iSTATS - information indicator showing profit/loss on your MT4 account (pips, lots, currency, percentage) current profit profit for today profits for the current week profits for the current month profit for the current quarter profit for the current year A convenient format for displaying statistics of your trading account in real time. (the indicator can be installed on any MT4 terminal chart)
FREE
Time Session OPEN-HIGH-LOW-CLOSE This Indicator Will Draw Lines Of OHLC Levels Of Time Session Defined By User. It Will Plot Floating Lines On Current Day Chart. Time Session Can Of Current Day Or Previous Day. You Can Plot Multiple Session Lines By Giving Unique ID To Each Session. It Can Even Show Historical Levels Of Time Session Selected By User On Chart To Do Backdating Test. You Can Write Text To Describe The Lines.
FREE
TrendPlus
Sivakumar Subbaiya
4.21 (14)
Trend Plus   Trendplus  Indicator   Time Frame: Suitable for any time frame.  Purpose: Trend Prediction. Blue and red candle indicate the buy and sell call respectively. Buy: When the blue candle is formed buy call is initiated. close the buy trades when the next red candle will formed.   Sell: When the Red candle is formed Sell call is initiated. close the Sell trades when the next blue candle will formed.   Happy trade!!
FREE
Lógica de trabajo La utilidad Stop Out es un indicador simple pero muy conveniente que muestra cuántos puntos le quedan al nivel de Stop Out / Su beneficio radica en el hecho de que muchos comerciantes sobrestiman deliberadamente el riesgo al operar en busca de ganancias, usan el margen disponible al máximo y, en este caso, es muy importante saber dónde el corredor puede cerrar sus posiciones por la fuerza. Simplemente coloque el indicador en el gráfico y, dependiendo de la posición abier
FREE
Trend arrow Indicator
NGUYEN NGHIEM DUY
3.23 (13)
Trend arrow Indicator is an arrow Indicator used as an assistant tool for your trading strategy. The indicator analyzes the standard deviation of bar close for a given period and generates a buy or sell signals if the deviation increases. It good to combo with Martingale EA to follow Trend and Sellect Buy Only/Sell Only for EA work Semi-Automatic. You can use this  Indicator with any EAs in my Products.
FREE
Two Period RSI
Libertas LLC
4.5 (8)
Two Period RSI compares long-term and short-term RSI lines, and plots a fill between them for improved visualization. Fill is colored differently according to an uptrend (short period RSI above long period RSI) or a downtrend (short period RSI below long period RSI). Short-term RSI crossing long-term RSI adds a more robust trend confirmation signal than using single period RSI alone. This is a small tool to help visualize and confirm RSI trends. We hope you enjoy! Looking for RSI alerts? You can
FREE
Rule Plotter MT4
Francisco Gomes Da Silva
5 (1)
Cómo Crear un Robot de Trading Automatizado con Rule Plotter ¿Alguna vez has imaginado lo poderoso que sería poder automatizar tus estrategias de trading con solo unos clics del mouse? Imagina tener la libertad de crear y probar diferentes estrategias de trading sin necesidad de sumergirte en complicados códigos. Con Rule Plotter, esta visión se hace realidad. Aquí exploraremos cómo puedes crear tu propio robot de trading personalizado usando Rule Plotter, una herramienta de creación de sistemas
FREE
Shadow Height mt4
Iurii Tokman
5 (1)
Shadow Height mt4   Indicador de sombra. Muestra el tamaño de las sombras de las velas, en puntos, como histograma. Funciona en tres modos, seleccionables por el usuario. Descripción de la configuración del indicador Modo: modos de funcionamiento del indicador, tres modos: primera altura: modo de visualización de las sombras de la vela superior e inferior; segunda diferencia: el modo de mostrar la diferencia en las sombras de las velas, la diferencia entre las sombras de las velas superior e in
FREE
EZ Binary GBUS
Tuan Anh Dao
4 (1)
The indicator allows you to trade binary options. The recommended time frame is М1 and the expiration time is 1 minute. The indicator suitable for auto and manual trading. A possible signal is specified as a arrows above/under a candle. You should wait until the candle closes! Arrows are not re-painted Trade sessions: LONDON and NEWYORK section Currency pairs: GRB/USD Working time frame: M1 Expiration time: 1 minute. The indicator also shows good results when using the martingale strategy - "Mar
FREE
LineBreakMT4
Nattadecha Tangpakinwat
Key Features: Type of Indicator: Line Break Chart Indicator Usage: Identifying trend reversals and potential market turning points. Input Parameters: The primary input parameter is 'Lines_Break,' which represents the number of lines the price needs to move to create a new line in the opposite direction. How it works: The indicator draws green and red histogram bars to represent the line break chart. Green bars indicate an upward trend, and red bars indicate a downward trend. The indicator calcul
FREE
Los compradores de este producto también adquieren
Gann Made Easy
Oleg Rodin
4.96 (47)
Gann Made Easy es un sistema de comercio de Forex profesional y fácil de usar que se basa en los mejores principios de comercio utilizando la teoría del Sr. W. D. Gann. El indicador proporciona señales precisas de COMPRA y VENTA, incluidos los niveles de Stop Loss y Take Profit. Puede comerciar incluso sobre la marcha utilizando notificaciones PUSH. ¡Por favor, póngase en contacto conmigo después de la compra! ¡Compartiré mis consejos comerciales con usted y excelentes indicadores de bonificació
Atomic Analyst
Issam Kassas
5 (2)
En primer lugar, vale la pena enfatizar que este Indicador de Trading no repinta, no redibuja y no se retrasa, lo que lo hace ideal tanto para el trading manual como para el automatizado. El Analista Atómico es un Indicador de Acción del Precio PA que utiliza la fuerza y el impulso del precio para encontrar una mejor ventaja en el mercado. Equipado con filtros avanzados que ayudan a eliminar ruidos y señales falsas, y aumentan el potencial de trading. Utilizando múltiples capas de indicadores
TPSproTREND PrO
Roman Podpora
5 (15)
TPSpro TRENDPRO  - is a trend indicator that automatically analyzes the market and provides information about the trend and each of its changes, as well as giving signals for entering trades without redrawing! The indicator uses each candle, analyzing them separately. referring to different impulses - up or down impulse. Exact entry points into transactions for currencies, crypto, metals, stocks, indices!  -  Version MT5               DETAILED DESCRIPTION        /       TRADING SETUPS           
Gold Stuff
Vasiliy Strukov
4.89 (250)
Gold Stuff: un indicador de tendencia diseñado específicamente para el oro, también se puede usar en cualquier instrumento financiero. El indicador no se vuelve a dibujar ni se retrasa. El marco de tiempo recomendado es H1. Este indicador está escrito por EA Gold Stuff Advisor, puede encontrarlo en mi perfil. IMPORTANTE! Póngase en contacto conmigo inmediatamente después de la compra para obtener instrucciones y bonificación! PARÁMETROS Draw Arrow - incl.desactivado. dibujar flechas en el grá
ACTUALMENTE 26% DE DESCUENTO ¡La mejor solución para cualquier operador novato o experto! Este indicador es una herramienta única, de alta calidad y asequible porque hemos incorporado una serie de características propias y una nueva fórmula. ¡Con sólo UN gráfico puede leer la Fuerza de la Divisa para 28 pares de Divisas! Imagínese cómo mejorará su operativa porque podrá señalar el punto exacto de activación de una nueva tendencia o de una oportunidad de scalping. Manual del usuario: haga
Scalper Vault
Oleg Rodin
5 (27)
Scalper Vault es un sistema profesional de reventa que le brinda todo lo que necesita para una reventa exitosa. Este indicador es un sistema comercial completo que puede ser utilizado por operadores de divisas y opciones binarias. El marco de tiempo recomendado es M5. El sistema le proporciona señales de flecha precisas en la dirección de la tendencia. También le proporciona señales superiores e inferiores y niveles de mercado de Gann. Los indicadores proporcionan todo tipo de alertas, incluidas
Ante todo, vale la pena enfatizar que esta Herramienta de Trading es un Indicador No Repintado, No Redibujado y No Retrasado, lo que la hace ideal para el trading profesional. El Indicador de Conceptos de Acción del Precio Inteligente es una herramienta muy potente tanto para traders nuevos como experimentados. Combina más de 20 indicadores útiles en uno solo, combinando ideas avanzadas de trading como el Análisis del Trader del Círculo Interior y Estrategias de Trading de Conceptos de Dinero
¡Actualmente 20% OFF ! ¡La mejor solución para cualquier novato o trader experto! Este software funciona con 28 pares de divisas. Se basa en 2 de nuestros principales indicadores (Advanced Currency Strength 28 y Advanced Currency Impulse). Proporciona una gran visión general de todo el mercado de divisas. Muestra los valores de Advanced Currency Strength, la velocidad de movimiento de las divisas y las señales para 28 pares de divisas en todos los (9) marcos temporales. Imagine cómo mejorar
Scalper Inside PRO
Alexey Minkov
4.75 (55)
SALE NOW! Limited Time Offer! An exclusive indicator that utilizes an innovative algorithm to swiftly and accurately determine the market trend. The indicator automatically calculates opening, closing, and profit levels, providing detailed trading statistics. With these features, you can choose the most appropriate trading instrument for the current market conditions. Additionally, you can easily integrate your own arrow indicators into Scalper Inside Pro to quickly evaluate their statistics and
TPSpro RFI Levels
Roman Podpora
5 (13)
A key element in trading is zones or levels from which decisions to buy or sell a trading instrument are made. Despite attempts by major players to conceal their presence in the market, they inevitably leave traces. Our task was to learn how to identify these traces and interpret them correctly. Reversal First Impulse levels (RFI)   -  Version MT5                INSTRUCTIONS                 RUS                 ENG                                       R ecommended to use with an indicator   -  
Introduciendo       Indicador Quantum Trend Sniper   , el innovador indicador MQL5 que está transformando la forma en que identificas y negocias los cambios de tendencia. Desarrollado por un equipo de comerciantes experimentados con experiencia comercial de más de 13 años,       Indicador de francotirador de tendencia cuántica       está diseñado para impulsar su viaje comercial a nuevas alturas con su forma innovadora de identificar cambios de tendencia con una precisión extremadamente alta.
Conviértase en un Breaker Trader y obtenga beneficios de los cambios en la estructura del mercado a medida que se invierte el precio. El indicador de ruptura de bloque de órdenes identifica cuándo una tendencia o movimiento de precio se acerca al agotamiento y está listo para revertirse. Le alerta sobre cambios en la estructura del mercado que generalmente ocurren cuando una reversión o un retroceso importante están a punto de suceder. El indicador utiliza un cálculo patentado que identific
Trend Screener
STE S.S.COMPANY
4.83 (86)
Indicador de tendencia, solución única e innovadora para el comercio y filtrado de tendencias con todas las funciones de tendencias importantes integradas en una sola herramienta. Es un indicador 100% sin repintar de marcos temporales y monedas múltiples que se puede usar en todos los símbolos/instrumentos: divisas, materias primas, criptomonedas, índices y acciones. Trend Screener es un indicador de seguimiento de tendencia eficiente que proporciona señales de tendencia de flecha con puntos en
Quantum Breakout Indicator PRO
Bogdan Ion Puscasu
4.96 (26)
Introduciendo       Quantum Breakout PRO   , el innovador indicador MQL5 que está transformando la forma en que comercia con Breakout Zones. Desarrollado por un equipo de operadores experimentados con experiencia comercial de más de 13 años,   Quantum Breakout PRO   está diseñado para impulsar su viaje comercial a nuevas alturas con su innovadora y dinámica estrategia de zona de ruptura. El indicador de ruptura cuántica le dará flechas de señal en las zonas de ruptura con 5 zonas objetivo de
Advanced Supply Demand
Bernhard Schweigert
4.92 (310)
¡Actualmente con 33% de descuento! ¡La mejor solución para cualquier tráder principiante o experto! Este indicador es una herramienta comercial única, de alta calidad y asequible, porque incorpora una serie de características patentadas y una nueva fórmula. Con esta actualización, podrá mostrar zonas de doble marco temporal. No solo podrá mostrar un marco temporal más alto, sino también mostrar ambos, el marco temporal del gráfico MÁS el marco temporal más alto: MOSTRANDO ZONAS ANIDADAS. A todos
Currency Strength Wizard es un indicador muy poderoso que le proporciona una solución todo en uno para operar con éxito. El indicador calcula el poder de este o aquel par de divisas utilizando los datos de todas las monedas en múltiples marcos de tiempo. Estos datos se representan en forma de índice de moneda fácil de usar y líneas eléctricas de moneda que puede usar para ver el poder de esta o aquella moneda. Todo lo que necesita es adjuntar el indicador al gráfico que desea operar y el indicad
¡Descubra el secreto para el comercio de Forex exitoso con nuestro indicador MT4 personalizado! ¿Alguna vez se ha preguntado cómo lograr el éxito en el mercado de Forex, obteniendo ganancias constantemente al tiempo que minimiza el riesgo? ¡Aquí está la respuesta que ha estado buscando! Permítanos presentar nuestro indicador MT4 patentado que revolucionará su enfoque para el comercio. Versatilidad única Nuestro indicador está especialmente diseñado para usuarios que prefieren las formacio
Break and Retest
Mohamed Hassan
5 (2)
Break & Retest is unstoppable when combined with our other divergence indicator. After purchase, send us a message and you could get this  2nd indicator  for  FREE  as a  BONUS! ‍You can visually backtest Break & Retest to see how it behaved in the past!    Manual guide:   Click here $59  for the first 25 copies ( 4  left)! Next price is $120 .  After many months of hard work and dedication, we are extremely proud to present you our  Break and Retest price action indicator crea
Presentamos el Indicador Milagroso de Forex: Desata el Poder del Trading Preciso ¿Estás cansado de buscar el mejor indicador de Forex que realmente ofrezca resultados excepcionales en todos los marcos temporales? ¡No busques más! Ha llegado el Indicador Milagroso de Forex para revolucionar tu experiencia de trading y llevar tus ganancias a nuevas alturas. Construido sobre una base de tecnología de vanguardia y años de desarrollo meticuloso, el Indicador Milagroso de Forex se erige como el pinácu
Entry Points Pro
Yury Orlov
4.7 (225)
Este es un genial indicador para MT4 que ofrece señales precisas para entrar en una transacción sin redibujar. Se puede aplicar a cualquier activo financiero: fórex, criptomonedas, metales, acciones, índices. Nos dará valoraciones bastante precisas y nos dirá cuándo es mejor abrir y cerra una transacción. Eche un vistazo  al vídeo  (6:22), ¡contiene un ejemplo de procesamiento de una sola señal que ha amortizado el indicador! La mayoría de los tráders mejoran sus resultados comerciales durante l
TrendDecoder Premium
Christophe, Pa Trouillas
5 (3)
Identifique los rangos y los próximos movimientos probables   |  Obtenga las señales más tempranas y la fuerza de las Tendencias   |  Obtener salidas claras antes de reversión   |  Detecte los niveles de Fibo que el precio pondrá a prueba Indicador no repintado y no retardado - ideal para la trading manual y automatizada - adecuado para todos los activos y todas las unidades temporales Oferta por tiempo limitado >>   50% OFF Después de la compra, póngase en contacto con mi canal  para conocer lo
ALERTA DE COMPRA Y VENTA MULTIDIVISA y MULTITIMEFRAME. ¡STOP DE TRAILING AUTOMÁTICO Y TOMA DE BENEFICIOS DE RECOMPENSA DE RIESGO! ¡EL INDICADOR ESCANEA Y ANALIZA EL MERCADO PARA QUE NO TENGAS NADA QUE HACER! ¡COMERCIA TODAS TUS MONEDAS EN 1 GRÁFICO!   Después de la compra, deje un comentario, contácteme y le enviaré el asistente comercial EA. El indicador utiliza varios osciladores y filtros adjuntos para encontrar los mejores puntos de entrada CONFIRMADOS, ¡así que no necesita preocupars
TrendMaestro
Stefano Frisetti
5 (2)
note: this indicator is for METATRADER4, if you want the version for METATRADER5 this is the link: TRENDMAESTRO recognizes a new TREND in the bud, he never makes mistakes. The certainty of identifying a new TREND is priceless. DESCRIPTION TRENDMAESTRO identifies a new TREND in the bud, this indicator examines the volatility, volumes and momentum to identify the moment in which there is an explosion of one or more of these data and therefore the moment in which prices have strong probability of f
FX Volume
Daniel Stein
4.6 (35)
Obtenga su actualización diaria del mercado con detalles y capturas de pantalla a través de nuestro Morning Briefing aquí en mql5 y en Telegram ! FX Volume es el PRIMER y ÚNICO indicador de volumen que proporciona una visión REAL del sentimiento del mercado desde el punto de vista de un bróker. Proporciona una visión impresionante de cómo los participantes institucionales del mercado, como los brokers, están posicionados en el mercado Forex, mucho más rápido que los informes COT. Ver esta info
Price Action Entry Alerts
Stephen Sanjeeve Sahayam
5 (3)
Este indicador analiza cada barra en busca de presión de compra o venta e identifica 4 tipos de patrones de velas con el volumen más alto. Estas velas luego se filtran utilizando varios filtros lineales para mostrar señales de compra o venta. Las señales funcionan mejor, junto con una dirección de marco de tiempo más alta y cuando se negocian durante horas de alto volumen. Todos los filtros son personalizables y funcionan de forma independiente. Puede ver señales de una sola dirección con el cli
ACTUALMENTE 31% DE DESCUENTO Este indicador es una herramienta de transacción única, de alta calidad y asequible porque hemos incorporado una serie de características propias y una fórmula secreta. Con solo un gráfico, da Alertas para los 28 pares de divisas. ¡Imagina cómo mejorarás porque puedes identificar el punto de activación exacto de una nueva tendencia u oportunidad de crecimiento! Basado en nuevos algoritmos subyacentes , hace que sea aún más fácil identificar y confirmar operaciones po
Trend Forecasting
Mohamed Hassan
5 (15)
This indicator is unstoppable when combined with our other indicator called Katana. After purchase, send us a message and you could get Katana for FREE as a BONUS After purchase, send us a private message for your instructions.  MT5 version: click here 3 copies left available at $45. Next price is $99. Don't miss this great deal!  The Trend Forecasting indicator is a very unique & easy tool that is able to make prediction about future price movement based on the signals generated
Dibuja automáticamente los niveles de soporte y resistencia MÁS los gaps de las velas de propulsión en su gráfico, para que pueda ver hacia dónde es probable que el precio se dirija a continuación y/o potencialmente retroceda. Este indicador está diseñado para ser utilizado como parte de la metodología de negociación de posiciones que se enseña en mi sitio web (The Market Structure Trader) y muestra información clave para la orientación y entradas potenciales. Hay 2 características PRINCIPA
Up Down v6
Guner Koca
4.67 (9)
up-down indicator is no repaint and works all pairs and lower than weekly time frames charts. it is suitable also 1 m charts for all pairs. and hold long way to signal. dont gives too many signals. when red histogram cross trigger line that is up signal.and price probably will down when blue histogram cross trigger line that is down signal.and price probably will go up. when the signals not seen press + button on terminal . too see weekly chart because of low data on chart ,it needs to lower p
How to use Pair Trading Station Pair Trading Station is recommended for H1 time frame and you can use it for any currency pairs. To generate buy and sell signal, follow few steps below to apply Pair Trading Station to your MetaTrader terminal. When you load Pair Trading Station on your chart, Pair Trading station will assess available historical data in your MetaTrader platforms for each currency pair. On your chart, the amount of historical data available will be displayed for each currency pai
Otros productos de este autor
MACD Candle Signal
Jonathan Destailleur
4.8 (5)
The MACD Signal Candle indicator  changes color according to the MACD trends. Colored Candles, based on MACD. HOW IT WORKS For a Buy:  -If the indicator is above zero, the market is bullish. -If the market is bullish, you can take a stand with green candle signals. For a Sell: -If the indicator is below zero, the market is bearish. -If the market is bearish, you can take a stand with the red candles.
FREE
SuperTrend Plus
Jonathan Destailleur
5 (1)
The Supertrend draws a line following the current trend.. Green Line under the candle means a likely bullish trend Red Line above the candle means a likely bearish trend How to trade with SuperTrend indicator Buy when the Supertrend Green line is below the price, Sell when the Supertrend Red line is above the price. It is strongly suggested to use this indicator in a trending market. Parameters Multiplier - the lower it is and the more sensitive is the line, meaning it will follow the price
FREE
Donchian Channels Bands
Jonathan Destailleur
4.2 (5)
Price Channels are also known as Donchian Channels being named after Richard Donchian.  They use the highest and lowest price of a set number of periods to create an upper and lower channel or envelope around the price. The upper channel shows the high of the number of periods chosen. The lower channel shows the low of the number of periods chosen. For example, the screenshot shows the Price Channels using 320 periods. The upper channel in the screenshot shows the highest high of the previous 3
FREE
RSI Candle Signal
Jonathan Destailleur
4.67 (3)
RSI Candle Signal Indicator will change bars’ color when set overbought or oversold levels reach. How to Use RSI Candle Signal Uptrend/Downtrends  - RSI may be used to detect trending markets. For example, the RSI may stay above the mid line 50 in an uptrend. Top and Buttoms  - RSI may help in identifying the tops around the overbought readings (usually above 70), and the bottoms around the oversold area (usually below 30). Divergence  - divergence occurs when RSI directional movement is not c
FREE
AO Signal Candle
Jonathan Destailleur
The  Awesome Oscillator  (AO)  Signal Candle Indicator  is an indicator used to measure market momentum.  Awesome Oscillator  (AO)  Signal Candle Indicator  will change bar's color when set overbought or oversold levels reach. Colored Candles, based on Awesome Oscillator (AO) Signal. -If the indicator is above zero, the market is bullish. -If the indicator is below zero, the market is bearish. -If the market is bullish, you can take a stand with green candle signals. -If the market is bearish,
FREE
Filtro:
No hay comentarios
Respuesta al comentario