RelicusRoad MACD v2 MT5
- Indicadores
- Relicus LLC
- Versión: 2.0
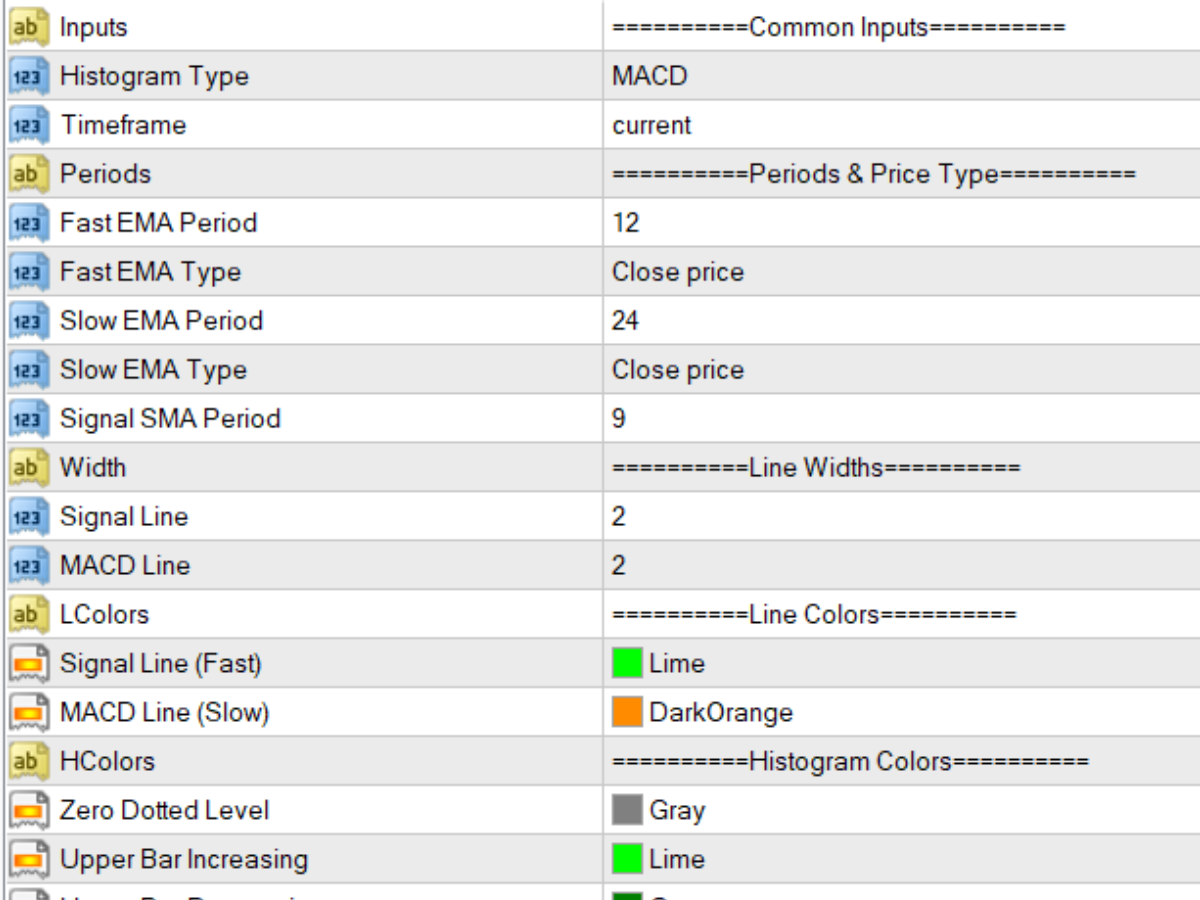
El estrategia de trading Moving Average Convergence Divergence (MACD) es una herramienta popular de análisis técnico que se utiliza para identificar cambios en el impulso y la dirección de la tendencia. El MACD se calcula restando la media móvil exponencial (EMA) de 26 períodos de la EMA de 12 períodos. Luego se traza una EMA de 9 períodos, llamada "línea de señal", sobre el MACD para actuar como un disparador de señales de compra y venta.
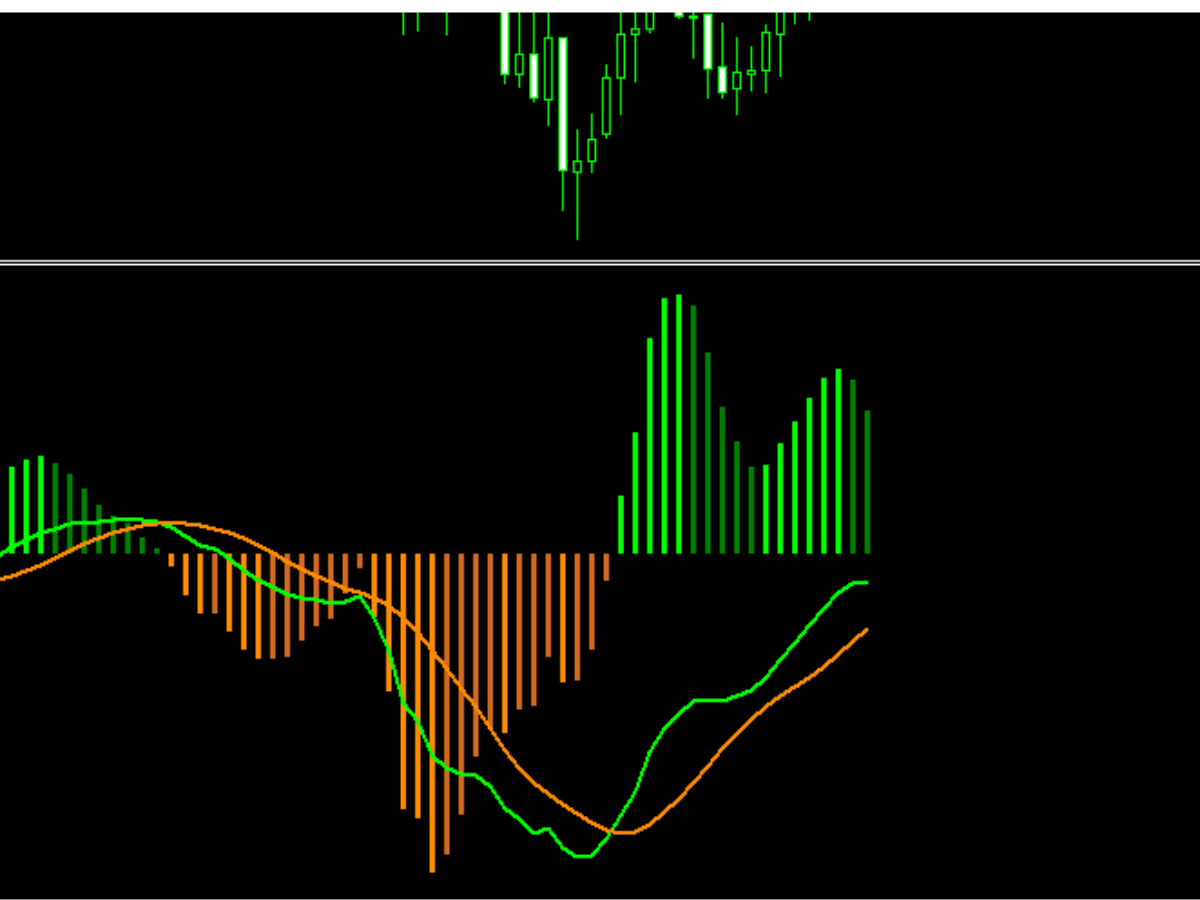
El MACD se considera en territorio alcista cuando la línea MACD está por encima de la línea de señal y en territorio bajista cuando está por debajo. Los traders a menudo utilizan esta información para identificar posibles oportunidades de compra y venta.
El MACD es un indicador versátil y se puede utilizar de diversas maneras, algunas formas comunes de utilizarlo son:
Cruzamiento: un cruce alcista ocurre cuando la línea MACD cruza por encima de la línea de señal y un cruce bajista ocurre cuando la línea MACD cruza por debajo de la línea de señal.
Divergencia: una divergencia alcista ocurre cuando el MACD está haciendo nuevos máximos mientras que el valor subyacente no lo está haciendo, y una divergencia bajista ocurre cuando el MACD está haciendo nuevos mínimos mientras que el valor subyacente no lo está haciendo.
Seguimiento de tendencia: una tendencia alcista ocurre cuando el MACD está por encima de la línea cero y una tendencia bajista ocurre cuando el MACD está por debajo de la línea cero.
Es importante tener en cuenta que el MACD es un indicador rezagado y debe utilizarse en conjunto con otros indicadores técnicos y análisis para tomar una decisión de trading.


Каждый индикатор подходит под те задачи, для решения которых он и создавался. Нормальный индикатор. Спасибо!