• Información general
  • Comentarios
  • Discusión
  • Novedades

Institutional Ichimoku Kinko Hyo

Unlock the full profit potential of your trading strategy with Institutional Ichimoku—an unparalleled indicator that elevates your market analysis to a professional level. Institutional Ichimoku encapsulates the rich essence of the Ichimoku system and transforms it into a dynamic decision-making powerhouse, giving you the edge you need in today's complex trading landscape.

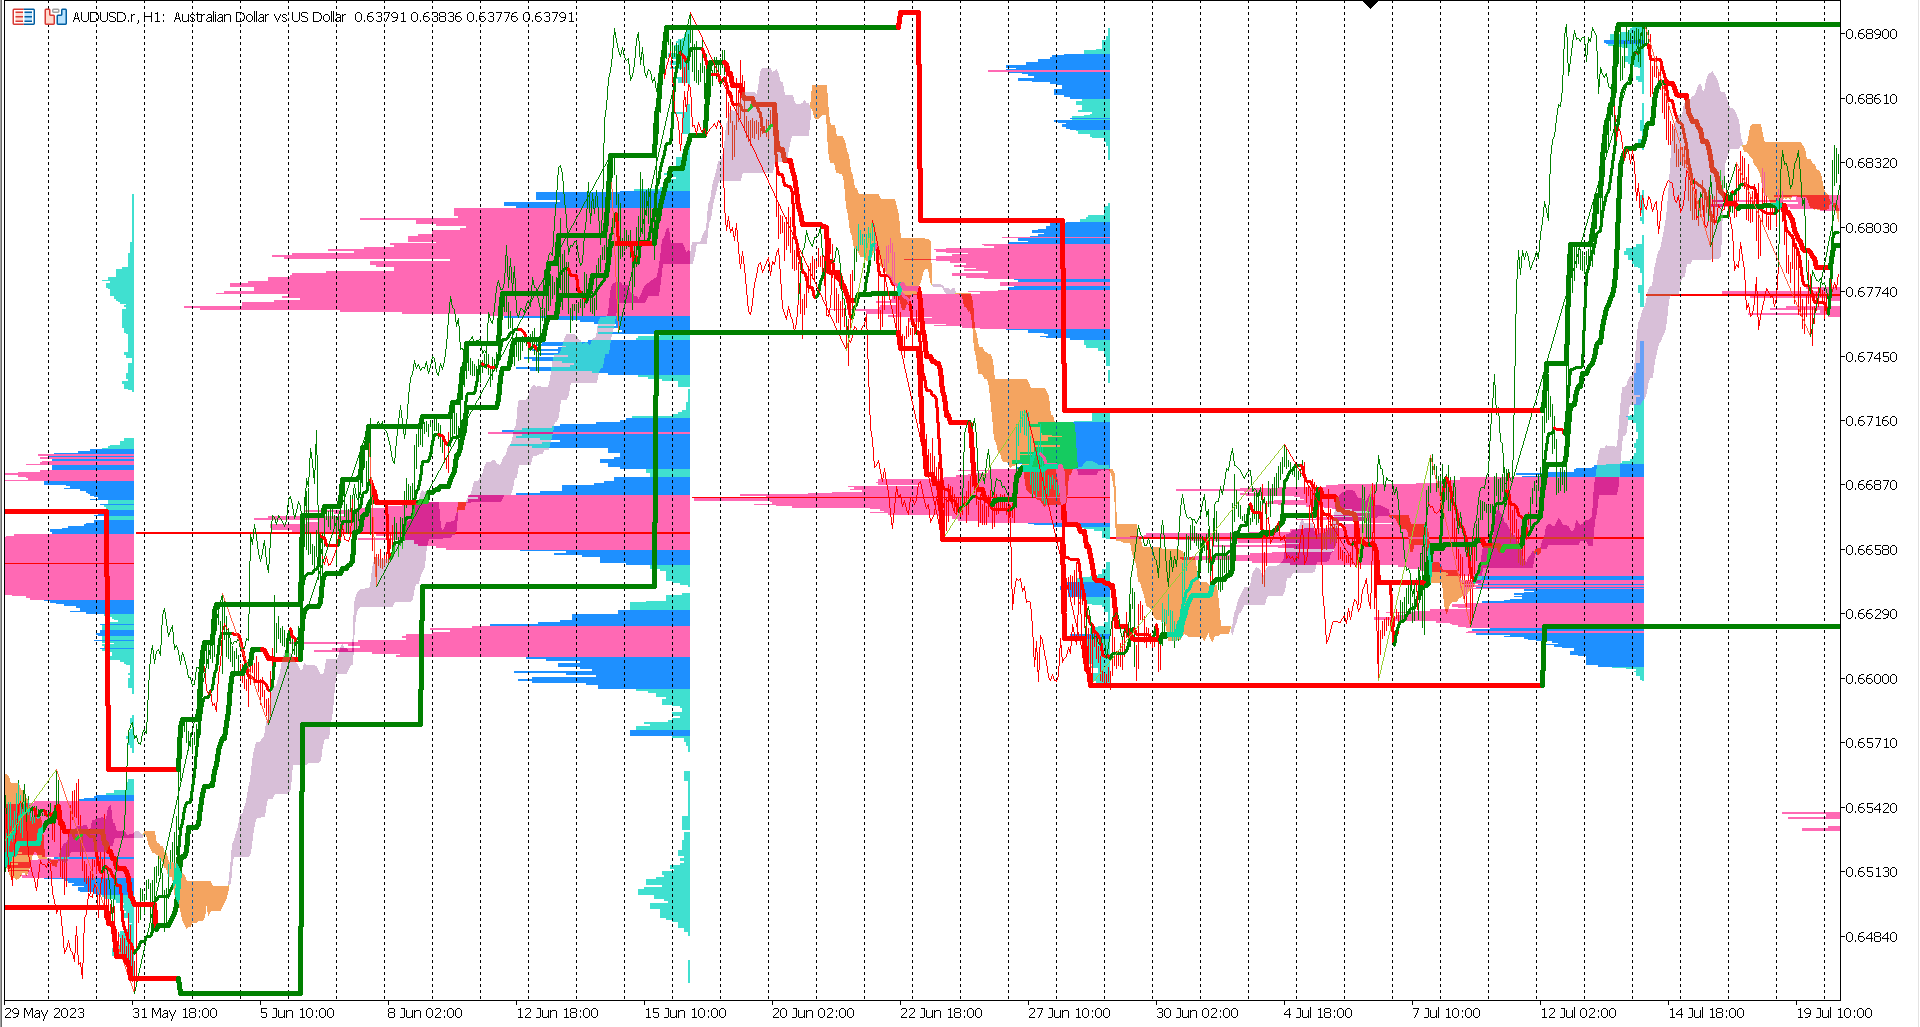
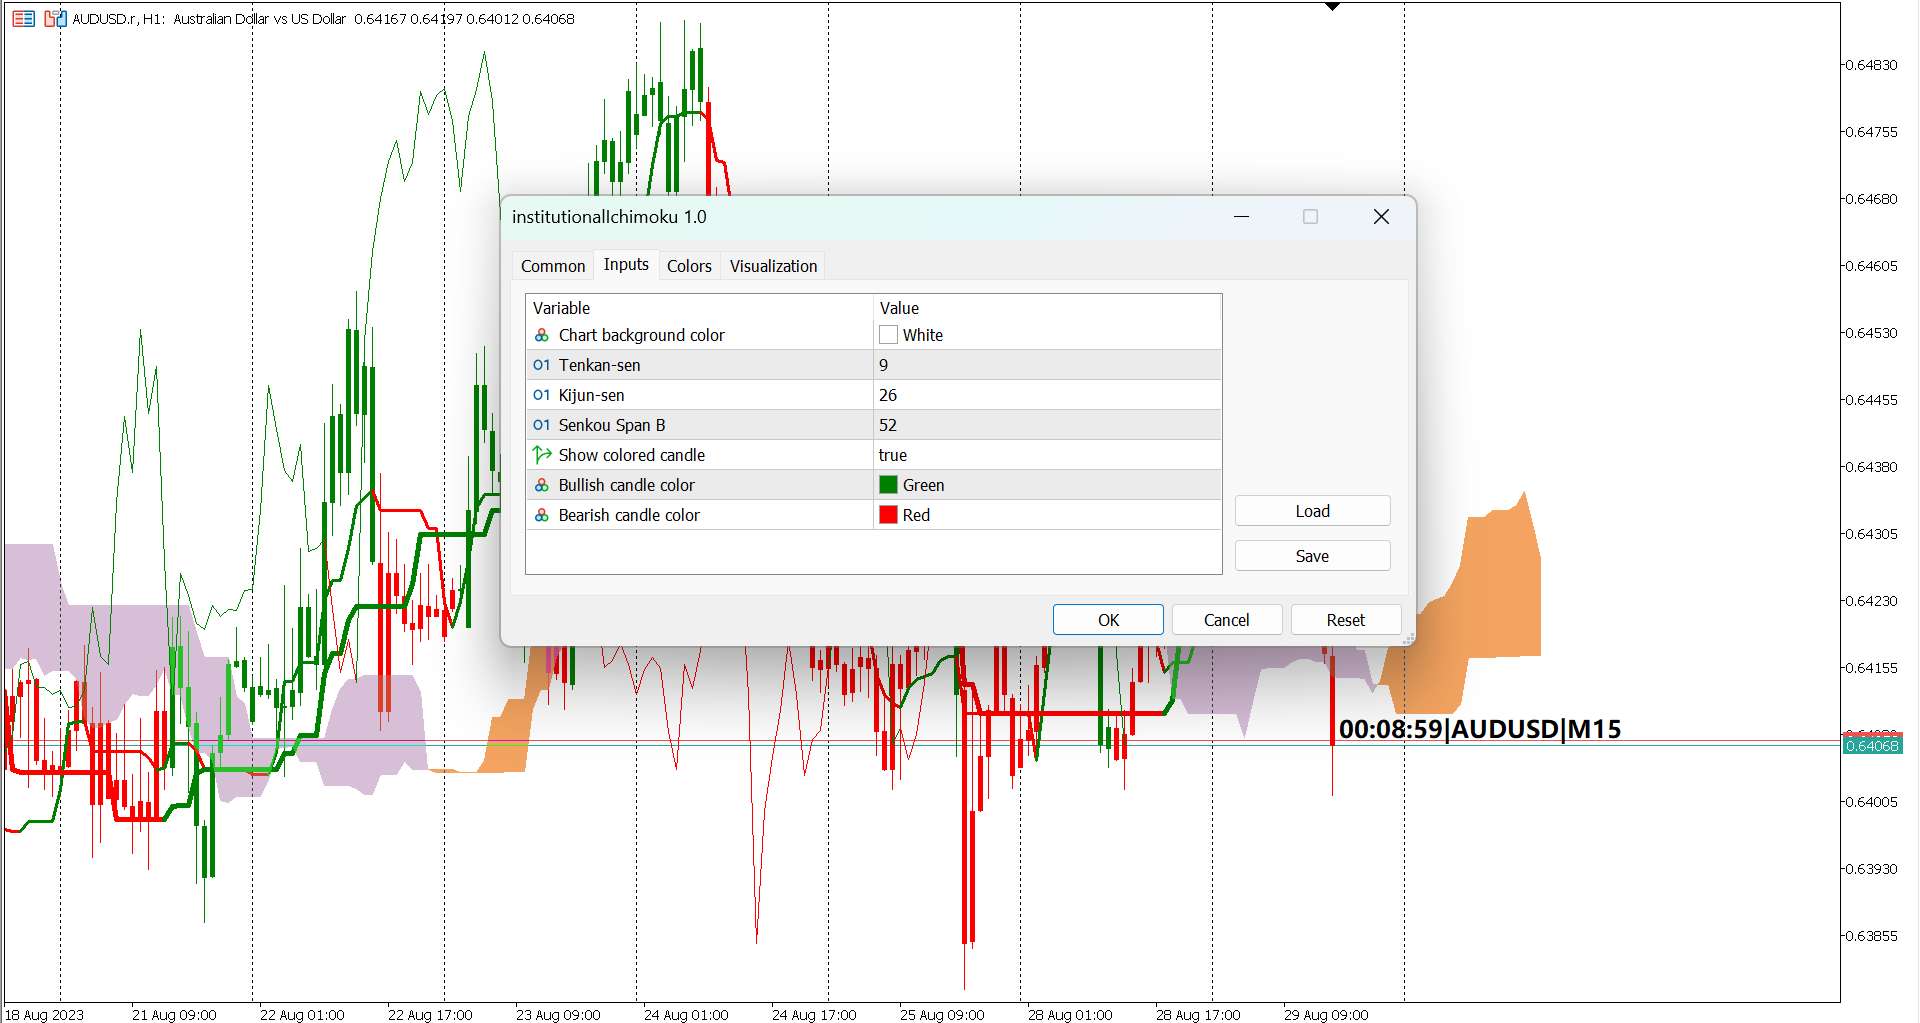
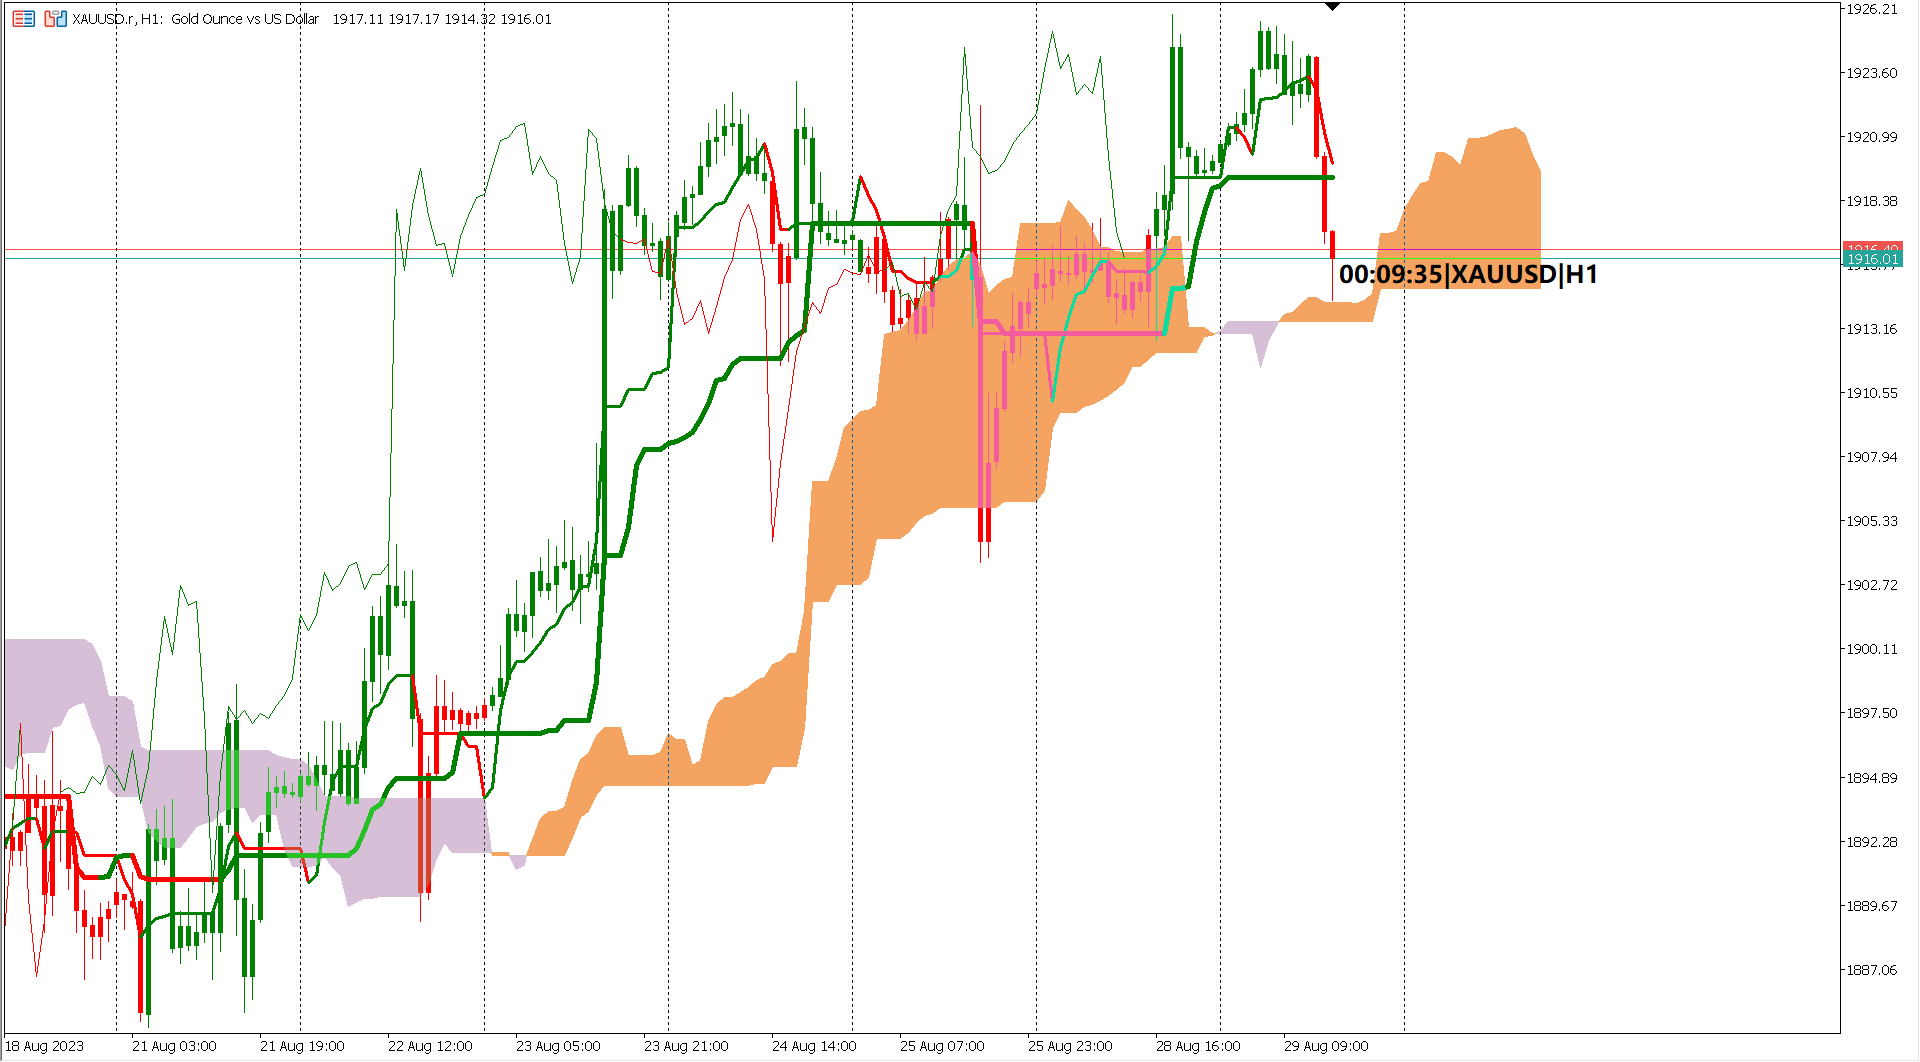
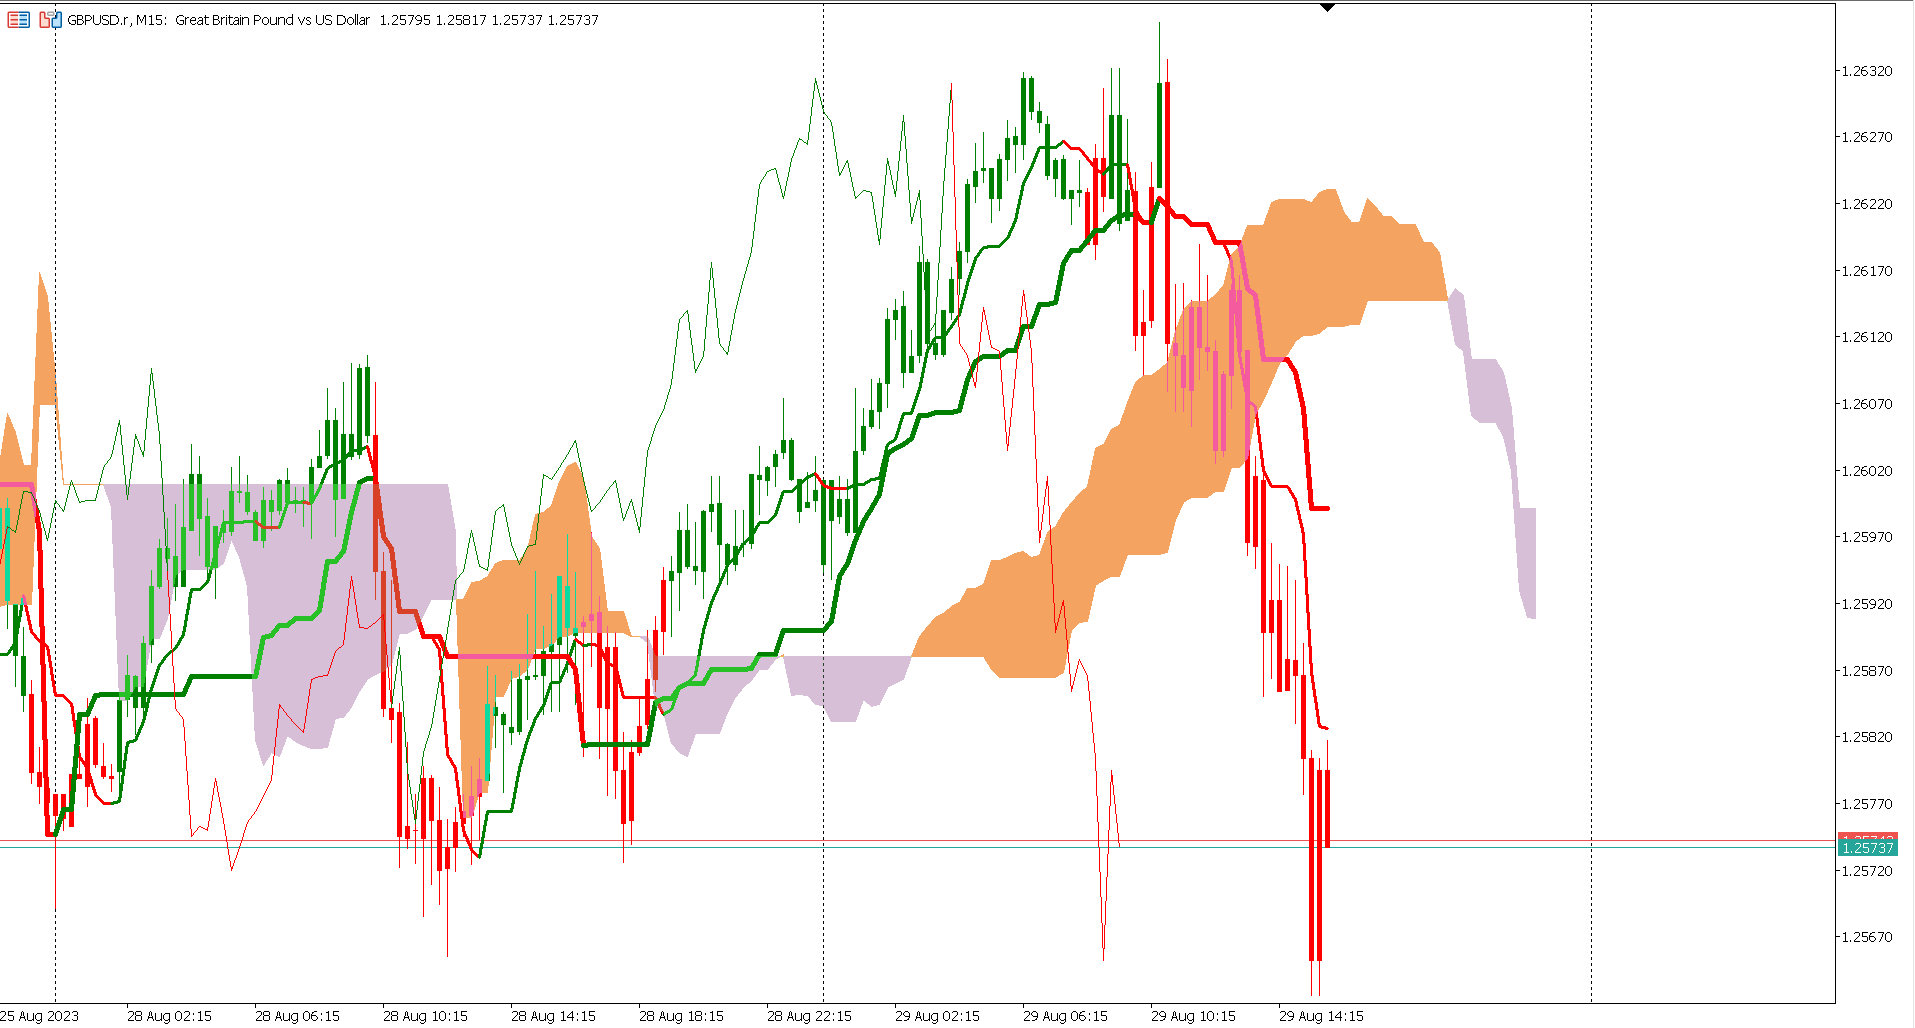
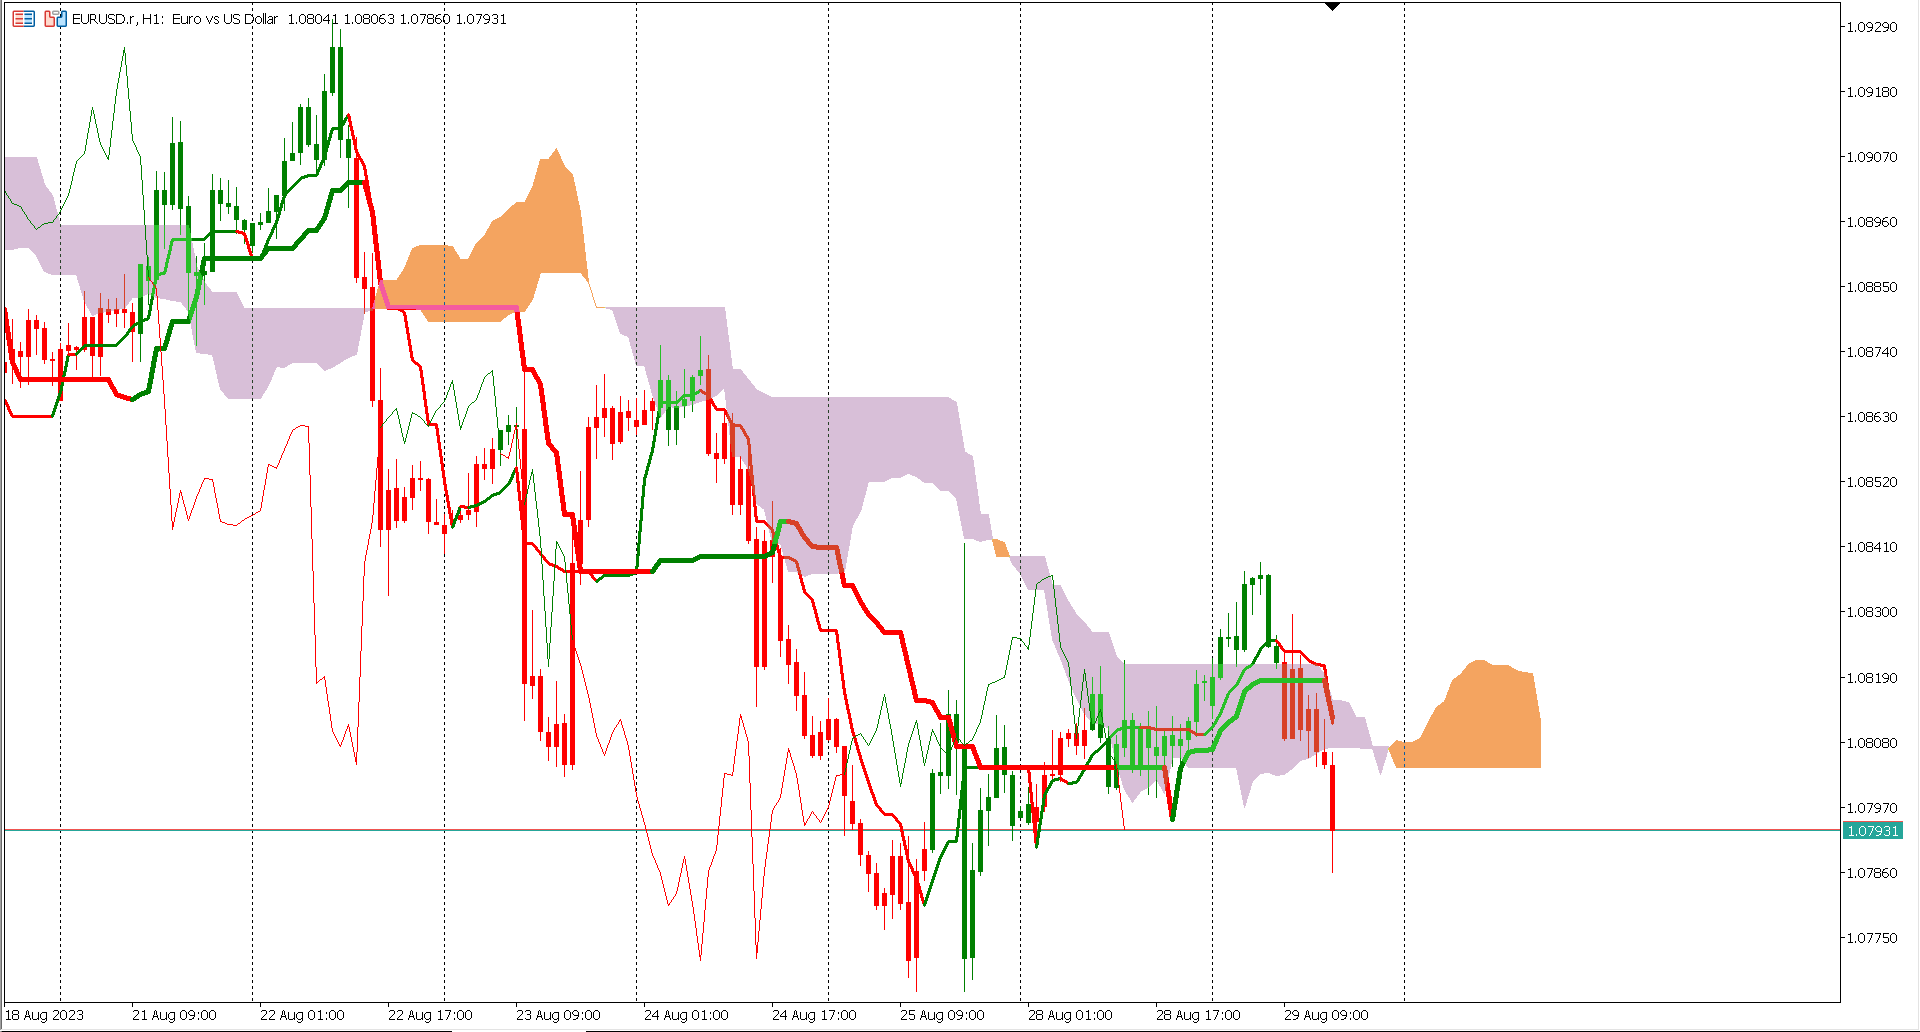
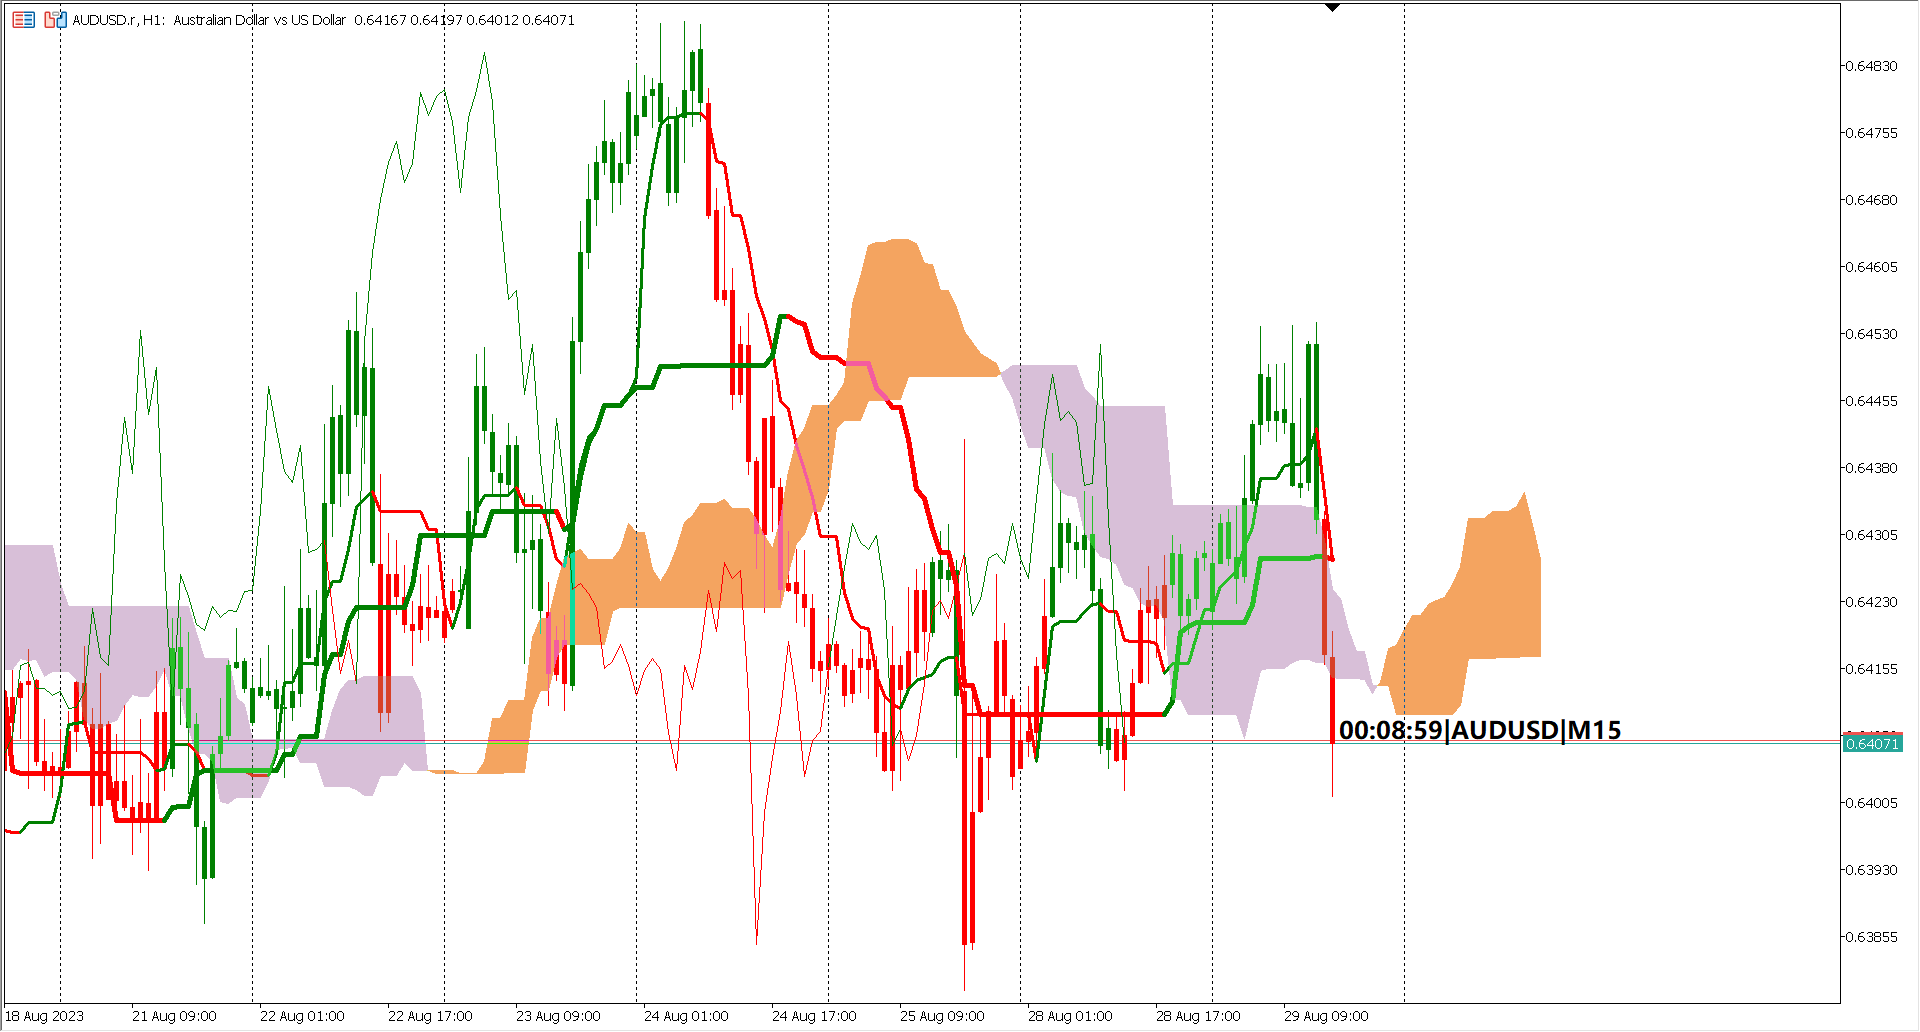
Decode Market Trends: Delve deep into the intricacies of market trends with Institutional Ichimoku. This indicator provides a comprehensive view of Ichimoku's core components, including the Chikou Span, Tenkan, and Kijun lines. It distills these signals into an engaging visual experience by dynamically changing candlestick colors. These color shifts offer real-time insights into the prevailing market trend, allowing you to make informed decisions with confidence.

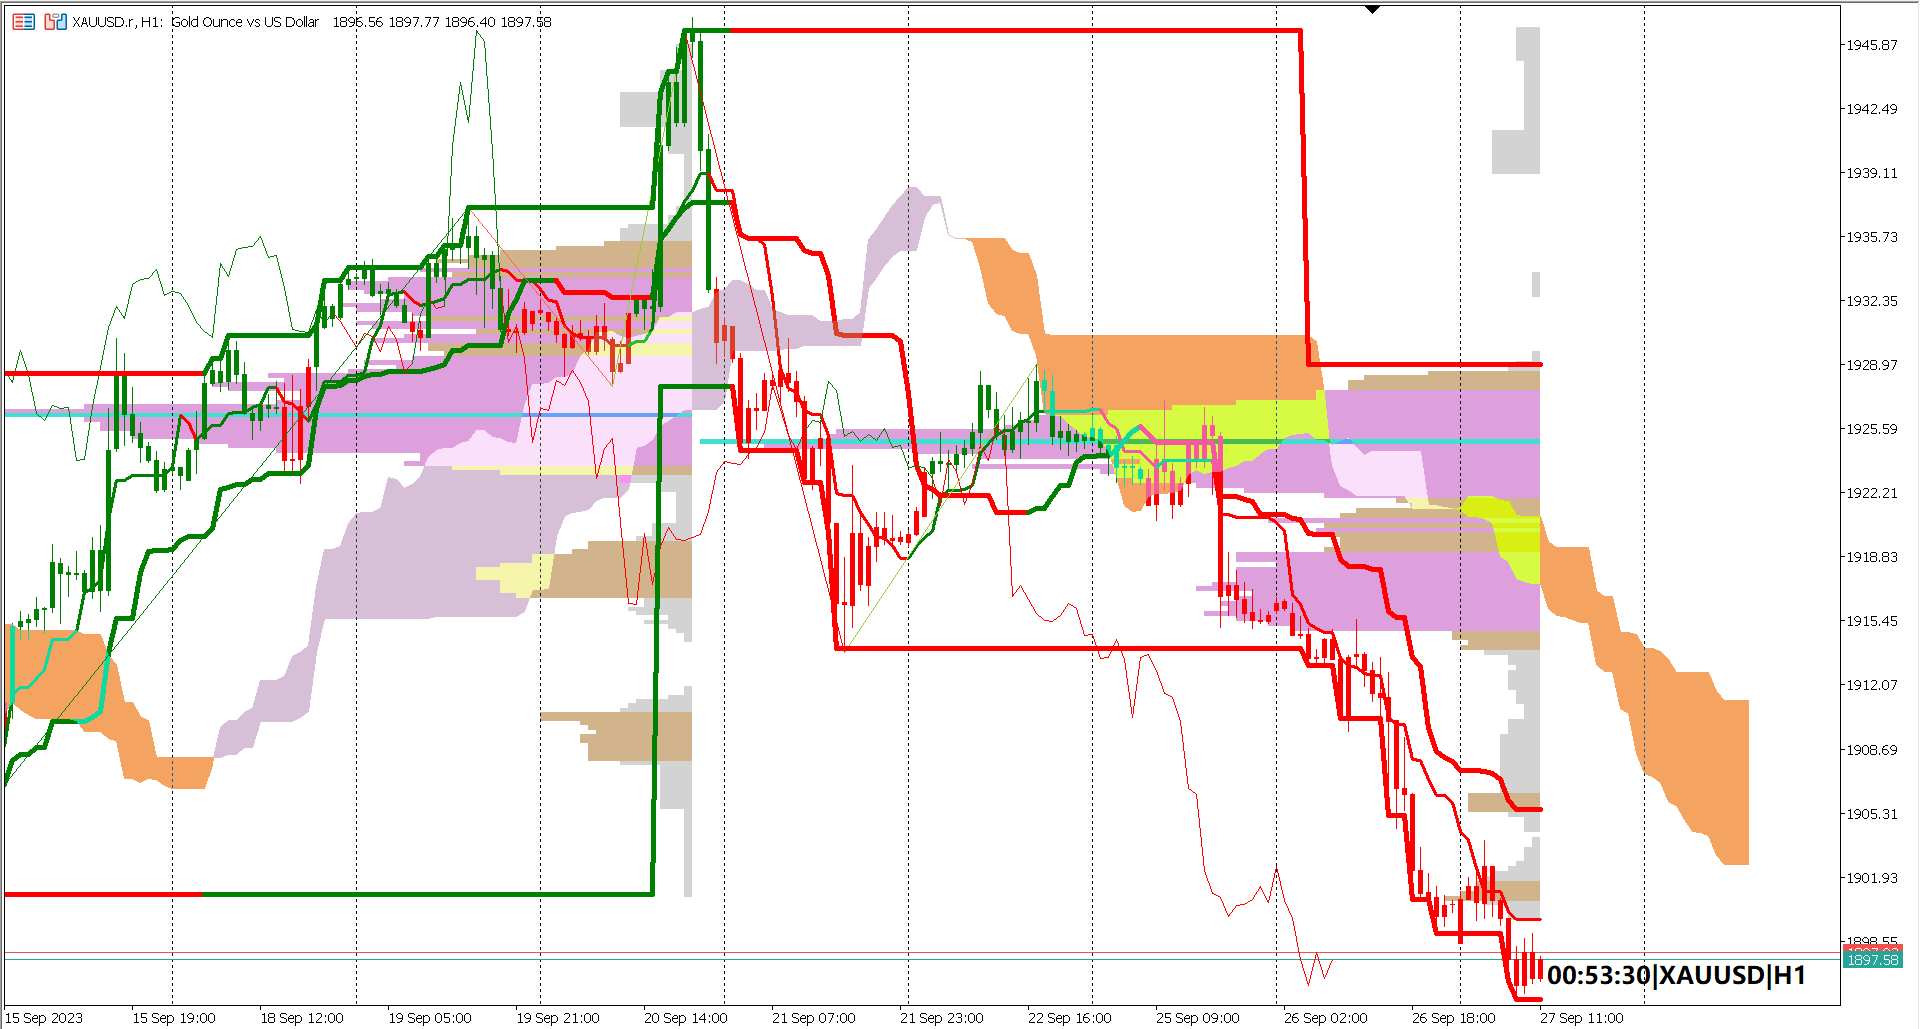
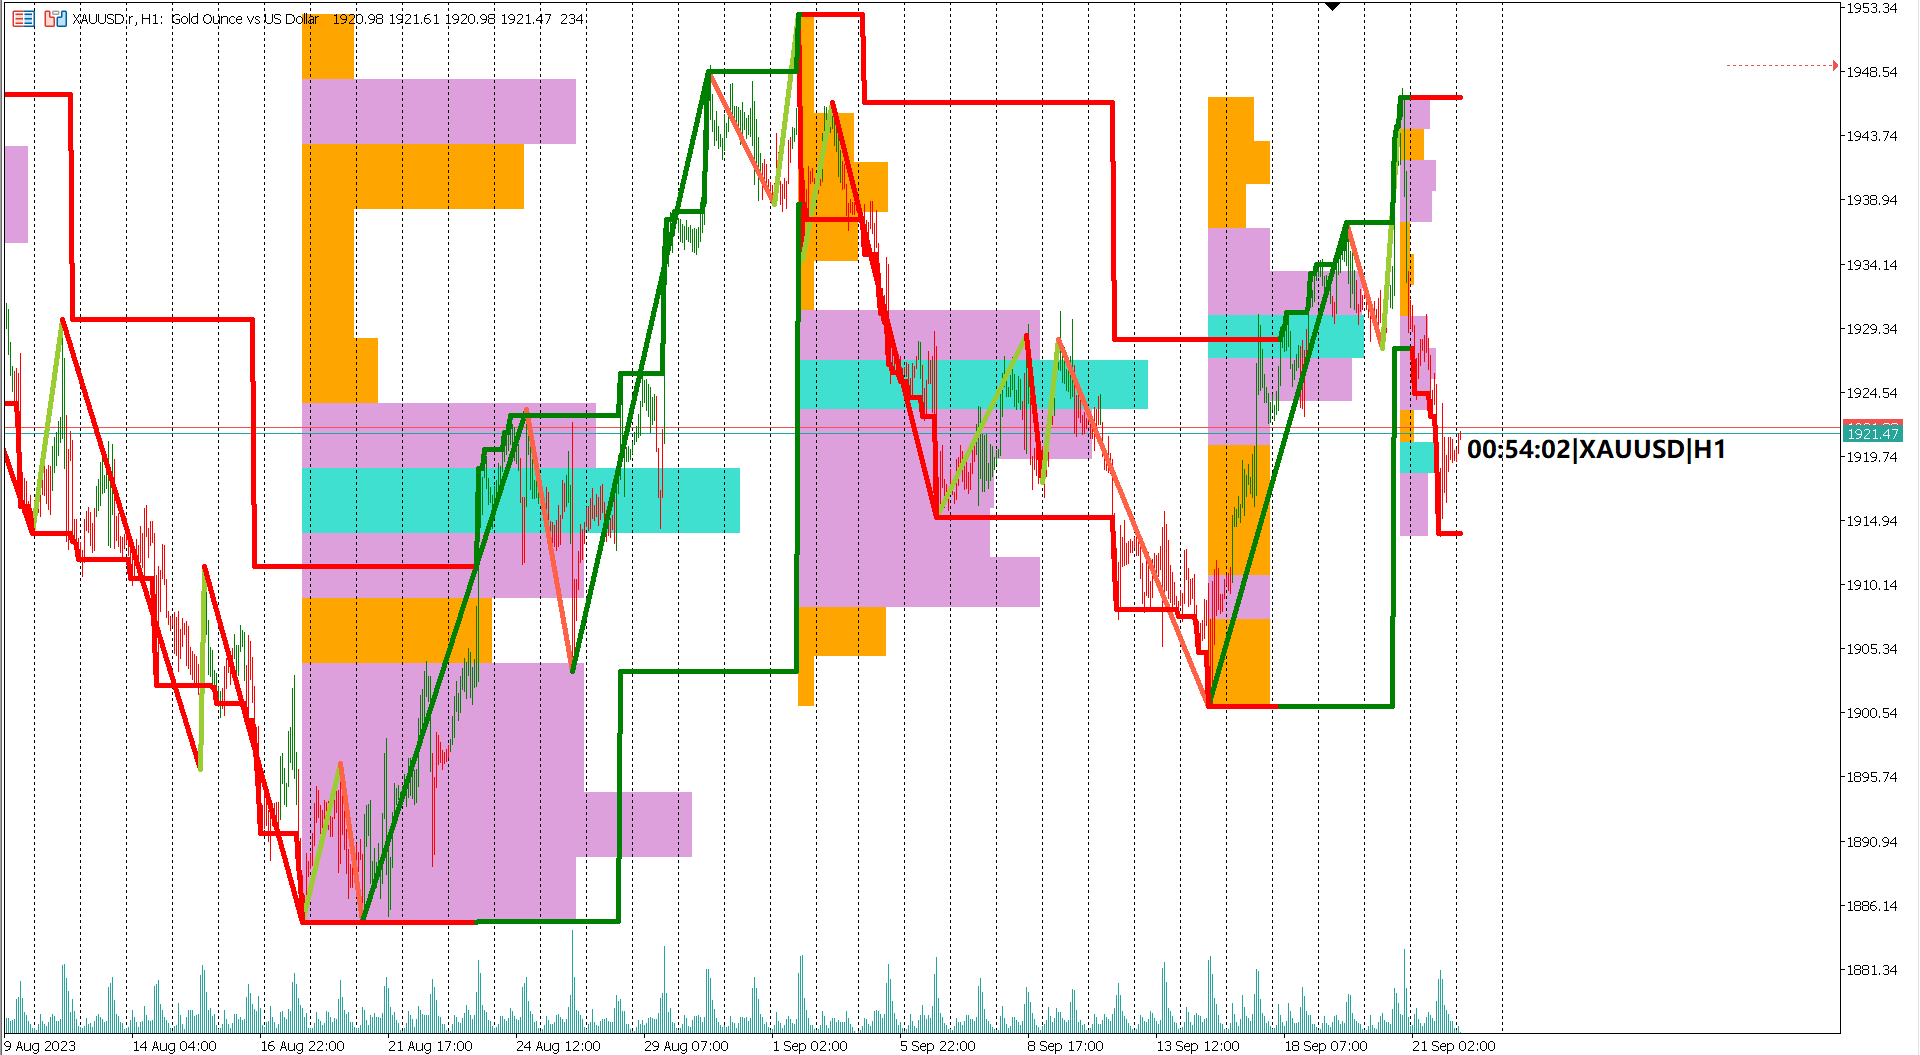
Navigate Market Structure: Gain an intuitive understanding of market structure like never before. Institutional Ichimoku unravels both minor and major market swings, mirroring the internal and external rhythms of the market. Minor swings come to life in a vivid spectrum of four phases: Bullish, Bullish Correction, Bearish, and Bearish Correction. These phases are elegantly etched as colored zigzag lines. Meanwhile, external swings, indicative of significant market movements, gracefully glide in hues of bullish and bearish lines. When these lines move horizontally, they signal sideway markets or corrections in progress, providing a holistic view of market dynamics.

Streamlined for Success: We've streamlined the user experience to ensure your focus remains where it matters—on the markets. Our default settings align with those favored by Ichimoku's ingenious creator, eliminating guesswork and complexity from your trading routine.

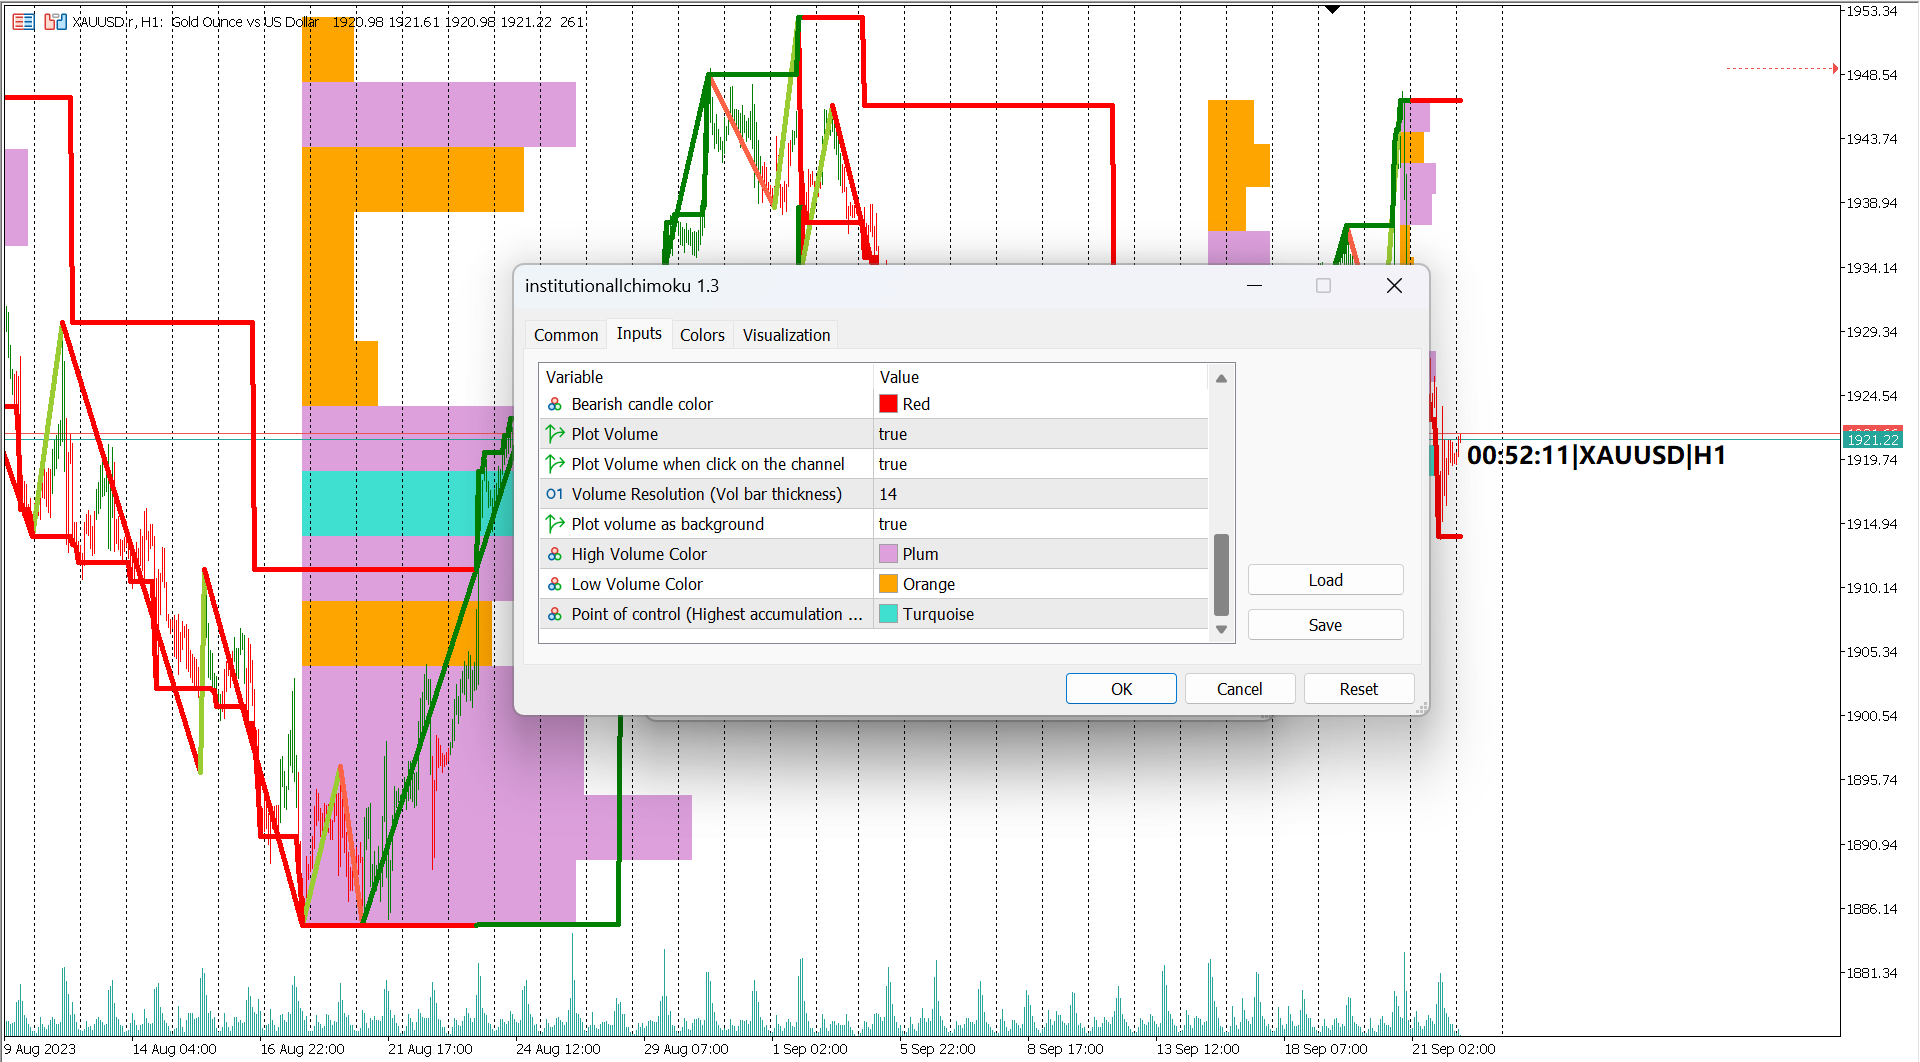
Volume Profile to Amplify Your Trading: Institutional Ichimoku brings additional firepower to your trading arsenal with a new volume profile feature. This insightful addition offers valuable data on trading volume within specific price levels, enhancing your understanding of market sentiment and potential support and resistance zones. You can fine-tune your analysis further with the "Volume Resolution" input field, allowing you to adjust the thickness and density of volume bars to match your preferences. Plus, you have the flexibility to customize the color of volume profile bars through the input parameters, ensuring a personalized and visually appealing trading experience.

The volume profile bar can be removed and re-plotted again when the external swing zone is clicked. You can disable it from the input parameter named "Plot Volume when click on the channel". The volume profile can also be hidden from the chart by changing the input parameter named "Plot Volume".

Institutional Ichimoku is your gateway to precision trading. It's time to harness the full potential of Ichimoku and ride the waves of market trends like never before. Are you prepared to redefine your trading journey and unlock a world of trading opportunities?

Productos recomendados
Heiken Ashi Smoothed Strategy is a very simple but powerful system to get forex market trend direction. This indicator is actually 2 indicators in 1 pack, Heiken Ashi and Heiken Ashi Smoothed Moving Average both included. Because HA (Heiken Ashi) and HAS (Heiken Ashi Smoothed) are calculated in the same one system event with necessary buffers and loop only, so it is the FAST, OPTIMIZED and EFFICIENT HA having the combined indicator of MetaTrader 5. You can choose to display HA and HAS in the sam
Una de las secuencias numéricas se llama "Secuencia de incendios forestales". Ha sido reconocida como una de las secuencias nuevas más bellas. Su característica principal es que esta secuencia evita tendencias lineales, incluso las más cortas. Es esta propiedad la que formó la base de este indicador. Al analizar una serie de tiempo financiera, este indicador intenta rechazar todas las opciones de tendencia posibles. Y solo si falla, entonces reconoce la presencia de una tendencia y da la señal
Owl Smart Levels MT5
Sergey Ermolov
4.47 (36)
Versión MT4  |  FAQ El Indicador Owl Smart Levels es un sistema comercial completo dentro de un indicador que incluye herramientas de análisis de mercado tan populares como los fractales avanzados de Bill Williams , Valable ZigZag que construye la estructura de onda correcta del mercado y los niveles de Fibonacci que marcan los niveles exactos de entrada. en el mercado y lugares para tomar ganancias. Descripción detallada de la estrategia Instrucciones para trabajar con el indicador Asesor de c
Big Player Range
Thalles Nascimento De Carvalho
5 (2)
Bienvenido al indicador "BigPlayerRange", una herramienta de análisis técnico desarrollada para identificar áreas de interés significativas por parte de las instituciones financieras en los mercados. Este indicador proporciona un análisis preciso de los rangos de precios donde los principales participantes del mercado muestran una actividad e interés considerable. Principales características: 1. Mapeo de Áreas de Interés Institucional: "BigPlayerRange" destaca con precisión las áreas del g
AW Prime Oscillator MT5
AW Trading Software Limited
Una combinación de dos osciladores. El primero muestra los puntos de entrada, el segundo muestra la tendencia actual. El indicador puede mostrar señales de oscilador mediante flechas en dos modos, todas señales de oscilador rápido o señales solo en la dirección de la tendencia actual. Tiene un panel de múltiples períodos de tiempo y tres tipos de notificaciones de señales. Beneficios: Adecuado para operaciones intradía y especulación. Filtrado de tendencias Configuración sencilla y sensible Pane
Noize Absorption Index - is the manual trading system that measures the difference of pressure between bears forces and bulls forces. Green line - is a noize free index that showing curent situation. Zero value of index shows totally choppy/flat market.Values above zero level shows how powerfull bullish wave is and values below zero measures bearish forces.Up arrow appears on bearish market when it's ready to reverse, dn arrow appears on weak bullish market, as a result of reverse expectation.
Be notified of every color change of Heiken Ashi (HA) candles. The indicator will trigger past and new signals every time that HA candles change their colors. ( Note : this tool is based on the code of Heiken Ashi indicator developed by MetaQuotes Software Corp.) Features The signals are triggered at closing of last bar/opening of a new bar; Any kind of alerts can be enabled: Dialog Box, Email message, SMS notifications for smartphones and tablets, and Sound alerts; By default, up arrows are p
Este innovador indicador de medición de la fuerza de la moneda de INFINITY es un ayudante indispensable para los revendedores y comerciantes que negocian en el largo plazo. El sistema de Análisis de fortaleza / debilidad de las monedas ha sido conocido y utilizado en el mercado por los principales operadores del mundo. Cualquier comercio de arbitraje no está completo sin este análisis. Nuestro indicador determina fácilmente la fuerza de las monedas subyacentes entre sí. Muestra gráficos de líne
This indicator is the same as the popular Heiken Ashi Smoothed. The Heikin Ashi indicator for MetaTrader 5 already exists, but it has two disadvantages: It paints the candles not accurate. It's not possible to change the candle width. See also Heikin Ashi in MQL5 Code Base . In this version there are no such disadvantages.
Introduction The "Two Moving Average Crossover" indicator for MetaTrader 5 (MT5) is a technical analysis tool that displays two moving averages and notifies when the moving averages cross each other. The indicator calculates and plots two moving averages, one of which is faster and the other is slower. When the faster moving average crosses above the slower moving average, it is considered a bullish signal, indicating a potential trend reversal or the start of a new uptrend. Conversely, when th
Description : Rainbow EA MT5 is a simple Expert advisor based on   Rainbow MT5 indicator witch is based on Moving average with period 34. The indicator is incorporated in the EA, therefore, it is not required for the EA to operate, but if you wish, you can download it from   my product page . The Expert Advisor settings are as follows : Suitable for Timeframes up to H1 The parameters below can be set according to your trading rules. StopLoss ( Stop Loss in pips) TakeProfit ( Take Profit in pi
The Riko Trend indicator is a revolutionary trend trading and filtering solution with all the important features of a trend tool built into one tool! The Riko Trend indicator is good for any trader, suitable for any trader for both forex and binary options. You don’t need to configure anything, everything is perfected by time and experience, it works great during a flat and in a trend. The Riko Trend indicator is a technical analysis tool for financial markets that reflects the current price
An indicator of pattern #31 ("Long Island") from Encyclopedia of Chart Patterns by Thomas N. Bulkowski. The second gap is in the opposite direction. Parameters: Alerts - show alert when an arrow appears   Push - send a push notification when an arrow appears (requires configuration in the terminal) GapSize - minimum gap size in points ArrowType - a symbol from 1 to 17 ArrowVShift - vertical shift of arrows in points   ShowLevels - show levels ColUp - color of an upward line ColDn - color of a
Indicator and Expert Adviser  EA Available in the comments section of this product. Download with Indicator must have indicator installed for EA to work. Mt5 indicator alerts for bollinger band and envelope extremes occurring at the same time. Buy signal alerts occur when A bullish candle has formed below both the lower bollinger band and the lower envelope  Bar must open and close below both these indicators. Sell signal occur when A bear bar is formed above the upper bollinger band and upp
¡El nivel Premium es un indicador único con más del 80% de precisión de predicciones correctas! ¡Este indicador ha sido probado por los mejores especialistas en comercio durante más de dos meses! ¡El indicador del autor no lo encontrarás en ningún otro lugar! ¡A partir de las capturas de pantalla, puede ver por sí mismo la precisión de esta herramienta! 1 es ideal para operar con opciones binarias con un tiempo de vencimiento de 1 vela. 2 funciona en todos los pares de divisas, accion
Stochastic R
Antony Augustine
Stochastic  Reversal  allows you to recognize reversals professionally. Stochastic Indicator: This technical indicator was developed by George Lane more than 50 years ago. The reason why this indicator survived for so many years is because it continues to show consistent signals even in these current times. The Stochastic indicator is a momentum indicator that shows you how strong or weak the current trend is. It helps you identify overbought and oversold market conditions within a trend.  Rules
Point Black
Ignacio Agustin Mene Franco
Pack Black Card indicador 5/1  Point black  cuenta con la estrategia de bollingers profesionales donde cada flecha te da una señal distinta de entrada .  sirve asta para operar en m1 y en d1  sirve para hacer scalping y intraday ,  modificado para los mercados de forex !  apto para todo los pares  modificado para los mercados de indices sinteticos apto para todo los pares !  Ideal para los volatilitys y jumps ! 
HMA Trend Professional MT5
Pavel Zamoshnikov
4.4 (5)
Improved version of the free HMA Trend indicator (for MetaTrader 4) with statistical analysis. HMA Trend is a trend indicator based on the Hull Moving Average (HMA) with two periods. HMA with a slow period identifies the trend, while HMA with a fast period determines the short-term movements and signals in the trend direction. The main differences from the free version: Ability to predict the probability of a trend reversal using analysis of history data. Plotting statistical charts for analyz
LT Rainbow Trend
Thiago Duarte
5 (1)
Do you, like me, like to trade with the trend? Then this indicator will help you! Rainbow Trend is a trend indicator, which uses several Moving Averages on the chart. It measures different trend strenght zones for different periods: very long term, long term, mid term, short term and very short term. Each zone has its color, and it is possible to have sound alert when the prices leaves a zone and enters another. Its configuration is very simple. If you find any bug or have any suggestions, co
Your Trend Friend
Luigi Nunes Labigalini
The trend is your friend! Look at the color of the indicator and trade on that direction. It does not  repaint. After each candle is closed, that's the color of the trend. You can focus on shorter faster trends or major trends, just test what's most suitable for the symbol and timeframe you trade. Simply change the "Length" parameter and the indicator will automatically adapt. You can also change the color, thickness and style of the lines. Download and give it a try! There are big movements
Renko Gold
Ignacio Agustin Mene Franco
Renko Gold !  indica clara mente los pisos y techos donde va de 4 lineas ,  la linea de abajo que marca el piso en color verde confirmando con la linea mas fina aclara la entrada en compra ,  lo mismo es para la venta , la linea de arriba marca el techo y la mas fina de color  rojo marca la venta ,  este indicador sirve para todas las temporalidades !  Para los mercados de Forex y Indices sinteticos ! Tambien sirve para los mercados de crypto !  Buen Profit! World Inversor. 
Trend Direction ADX indicator Trend Direction ADX is part of a serie of indicators used to characterize market conditions. Almost any strategy only work under certain market conditions. Therefore it is important to be able to characterize market conditions at any time: trend direction, trend strength, volatility, etc.. Trend Direction ADX is an indicator to be used to characterize trend direction: trending up trending down ranging Trend Direction ADX is based on ADX standard indicator.
US30NinjaMT5
Satyaseelan Shankarananda Moodley
US30 Ninja is a 5 minute scalping indicator that will let know you when there is a trade set up (buy or sell). Once the indicator gives the trade direction, you can open a trade and use a 30 pip stop loss and a 30 pip to 50 pip take profit. Please trade at own own risk. This indicator has been created solely for the US30 market and may not yield positive results on any other pair. 
The Antique Trend Indicator is a revolutionary trend trading and filtering solution with all the important features of a trend tool built into one tool! The Antique Trend indicator is good for any trader, suitable for any trader both for Forex and binary options. There is no need to configure anything, everything has been perfected by time and experience, it works great during flats and trends. The Antique Trend indicator is a tool for technical analysis of financial markets, reflecting curre
Ante todo, vale la pena enfatizar que esta Herramienta de Trading es un Indicador No Repintado, No Redibujado y No Retrasado, lo que la hace ideal para el trading profesional. El Indicador de Conceptos de Acción del Precio Inteligente es una herramienta muy potente tanto para traders nuevos como experimentados. Combina más de 20 indicadores útiles en uno solo, combinando ideas avanzadas de trading como el Análisis del Trader del Círculo Interior y Estrategias de Trading de Conceptos de Dinero
The indicator displays a matrix of indicators across multiple timeframes with a sum total and optional alert. Custom indicators can also be added to the matrix, in a highly configurable way. The alert threshold can be set to say what percentage of indicators need to be in agreement for an alert to happen. The alerts can turned on/off via on chart tick boxes and can be set to notify to mobile or sent to email, in addition to pop-up. The product offers a great way to create an alert when multiple
Are you tired of the uncertainty that arises when your orders fail to stop at a specific line due to the spread? Look no further! Introducing our  indicator that plots candlesticks based on the Ask price instead of the traditional bid-based chart commonly used in MQL4. With this indicator, you can say goodbye to the frustrations caused by the bid-based chart, as it provides you with a more accurate representation of market movements. By utilizing the Ask price, which represents the price at whic
FXC iDeM-DivergencE MT5 Indicator This is an advanced DeMarker indicator that finds trend-turn divergences on the current symbol. The indicator detects divergence between the DeMarker and the price movements as a strong trend-turn pattern. Main features: Advanced divergence settings Price based on Close, Open or High/Low prices Give Buy/Sell open signals PUSH notifications E-mail sending Pop-up alert Customizeable Information panel Input parameters: DeM Period: The Period size of the DeMarke
This indicator is used to compare the relative strength of the trade on the chart against the other several selected symbols. By comparing the price movement of each traded variety based on the same base day, several trend lines of different directions can be seen, reflecting the strong and weak relationship between the several different traded varieties, so that we can have a clearer understanding of the market trend. For example, you can apply this indicator on a EurUSD chart and compare it
40% off. Original price: $50 Advanced Bollinger Bands Scanner is a multi symbol multi timeframe Bollinger bands dashboard that monitors and analyzes the Bollinger Bands indicator from one chart. This panel scans the Bollinger bands indicator in up to 28 configurable instruments and 9 timeframes for price overbought/oversold, price consolidation (Bollinger bands squeeze), and consolidation breakout (squeeze break)  with a deep scan feature to scan all market watch symbols (up to 1000 instruments
Los compradores de este producto también adquieren
Primero que todo, vale la pena enfatizar que este Sistema de Trading es un Indicador No Repintado, No Redibujado y No Retrasado, lo que lo hace ideal tanto para el trading manual como para el automatizado. El "Sistema de Trading Inteligente MT5" es una solución completa de trading diseñada para traders nuevos y experimentados. Combina más de 10 indicadores premium y presenta más de 7 estrategias de trading robustas, lo que lo convierte en una opción versátil para diversas condiciones del merca
Atomic Analyst MT5
Issam Kassas
4.27 (11)
En primer lugar, vale la pena enfatizar que este Indicador de Trading no repinta, no redibuja y no se retrasa, lo que lo hace ideal tanto para el trading manual como para el automatizado. El Analista Atómico es un Indicador de Acción del Precio PA que utiliza la fuerza y el impulso del precio para encontrar una mejor ventaja en el mercado. Equipado con filtros avanzados que ayudan a eliminar ruidos y señales falsas, y aumentan el potencial de trading. Utilizando múltiples capas de indicadores
FX Volume MT5
Daniel Stein
4.94 (17)
Obtenga su actualización diaria del mercado con detalles y capturas de pantalla a través de nuestro Morning Briefing aquí en mql5 y en Telegram ! FX Volume es el PRIMER y ÚNICO indicador de volumen que proporciona una visión REAL del sentimiento del mercado desde el punto de vista de un bróker. Proporciona una visión impresionante de cómo los participantes institucionales del mercado, como los brokers, están posicionados en el mercado Forex, mucho más rápido que los informes COT. Ver esta info
Quantum Trend Sniper
Bogdan Ion Puscasu
5 (37)
Introduciendo       Indicador Quantum Trend Sniper   , el innovador indicador MQL5 que está transformando la forma en que identificas y negocias los cambios de tendencia. Desarrollado por un equipo de comerciantes experimentados con experiencia comercial de más de 13 años,       Indicador de francotirador de tendencia cuántica       está diseñado para impulsar su viaje comercial a nuevas alturas con su forma innovadora de identificar cambios de tendencia con una precisión extremadamente alta.
Gold Stuff mt5
Vasiliy Strukov
4.89 (166)
Gold Stuff mt5: un indicador de tendencia diseñado específicamente para el oro, también se puede usar en cualquier instrumento financiero. El indicador no se vuelve a dibujar ni se retrasa. El marco de tiempo recomendado es H1. IMPORTANTE! Póngase en contacto conmigo inmediatamente después de la compra para obtener instrucciones y bonificación! PARÁMETROS Draw Arrow-incl.desactivado. dibujar flechas en el gráfico. Alerts-incl.desactivado.alertas de sonido. E-mail notification-incl.desacti
RelicusRoad Pro MT5
Relicus LLC
4.82 (22)
Ahora $ 147 (aumentando a $ 499 después de algunas actualizaciones) - Cuentas ilimitadas (PC o Mac) Manual de usuario de RelicusRoad + Videos de capacitación + Acceso al grupo privado de Discord + Estado VIP UNA NUEVA MANERA DE VER EL MERCADO RelicusRoad es el indicador comercial más poderoso del mundo para divisas, futuros, criptomonedas, acciones e índices, y brinda a los comerciantes toda la información y las herramientas que necesitan para mantenerse rentables. Brindamos análisis téc
Este es un genial indicador para MT5 que ofrece señales precisas para entrar en una transacción sin redibujar. Se puede aplicar a cualquier activo financiero: fórex, criptomonedas, metales, acciones, índices. Nos dará valoraciones bastante precisas y nos dirá cuándo es mejor abrir y cerra una transacción. Eche un vistazo  al vídeo  (6:22), ¡contiene un ejemplo de procesamiento de una sola señal que ha amortizado el indicador! La mayoría de los tráders mejoran sus resultados comerciales durante l
FX Power MT5 NG
Daniel Stein
5 (4)
Obtenga su actualización diaria del mercado con detalles y capturas de pantalla a través de nuestro Morning Briefing aquí en mql5 y en Telegram ! FX Power MT5 NG es la nueva generación de nuestro popular medidor de fuerza de divisas, FX Power. ¿Y qué ofrece este medidor de fuerza de nueva generación? Todo lo que le encantaba del FX Power original PLUS Análisis de fuerza de ORO/XAU Resultados de cálculo aún más precisos Períodos de análisis configurables individualmente Límite de cálculo persona
Advanced Supply Demand MT5
Bernhard Schweigert
4.53 (15)
¡Actualmente con 33% de descuento! ¡La mejor solución para cualquier tráder principiante o experto! Este indicador es una herramienta comercial única, de alta calidad y asequible, porque incorpora una serie de características patentadas y una nueva fórmula. Con esta actualización, podrá mostrar zonas de doble marco temporal. No solo podrá mostrar un marco temporal más alto, sino también mostrar ambos, el marco temporal del gráfico MÁS el marco temporal más alto: MOSTRANDO ZONAS ANIDADAS. A todos
XQ Indicator MetaTrader 5
Marzena Maria Szmit
5 (1)
Step into the realm of Forex trading with confidence and precision using XQ, a cutting-edge Forex indicator designed to elevate your trading game to unprecedented heights. Whether you're a seasoned trader or just stepping into the world of currency exchange, XQ Forex Indicator empowers you with the insights and signals needed to make informed trading decisions. The signal conditions are a combination of three indicators, and XQ Forex Indicator only display  medium and long-term trends . The ind
ICT, SMC, SMART MONEY CONCEPTS, SMART MONEY, Smart Money Concept, Support and Resistance, Trend Analysis, Price Action, Market Structure, Order Blocks, BOS/CHoCH,   Breaker Blocks ,  Momentum Shift,   Supply&Demand Zone/Order Blocks , Strong Imbalance,   HH/LL/HL/LH,    Fair Value Gap, FVG,  Premium  &   Discount   Zones, Fibonacci Retracement, OTE, Buy Side Liquidity, Sell Side Liquidity, BSL/SSL Taken, Equal Highs & Lows, MTF Dashboard, Multiple Time Frame, BigBar, HTF OB, HTF Market Structure
Blahtech Supply Demand MT5
Blahtech Limited
4.57 (14)
Was: $299  Now: $99   Supply Demand uses previous price action to identify potential imbalances between buyers and sellers. The key is to identify the better odds zones, not just the untouched ones. Blahtech Supply Demand indicator delivers functionality previously unavailable on any trading platform. This 4-in-1 indicator not only highlights the higher probability zones using a multi-criteria strength engine, but also combines it with multi-timeframe trend analysis, previously confirmed swings
El Indicador de Cuadrados de Gann es una herramienta poderosa de análisis de mercado basada en el artículo "Fórmula Matemática para Predicciones de Mercado" escrito por W.D. Gann, que se basa en conceptos matemáticos para el análisis. Incorpora elementos de las técnicas de Gann relacionadas con los cuadrados de 144, 90 y 52, así como el cuadrado de 9. Además, incluye el método del  sobre cómo combinar el cuadrado de 9 con canales y patrones de estrellas. Manual del Usuario y Modo de Uso: Antes d
The Volume by Price Indicator for MetaTrader 5 features Volume Profile and Market Profile TPO (Time Price Opportunity). Get valuable insights out of currencies, equities and commodities data. Gain an edge trading financial markets. Volume and TPO histogram bar and line charts. Volume Footprint charts. TPO letter and block marker charts including split structures. Versatile segmentation and compositing methods. Static, dynamic and flexible ranges with relative and/or absolute visualizations. Lay
MetaBands M5
Vahidreza Heidar Gholami
4.67 (3)
MetaBands utiliza algoritmos potentes y únicos para dibujar canales y detectar tendencias para que pueda proporcionar a los traders puntos potenciales para entrar y salir de operaciones. Es un indicador de canal junto con un potente indicador de tendencia. Incluye diferentes tipos de canales que se pueden fusionar para crear nuevos canales simplemente utilizando los parámetros de entrada. MetaBands utiliza todos los tipos de alertas para notificar a los usuarios sobre eventos del mercado. Caract
Introduciendo       Quantum Breakout PRO   , el innovador indicador MQL5 que está transformando la forma en que comercia con Breakout Zones. Desarrollado por un equipo de comerciantes experimentados con experiencia comercial de más de 13 años,       Desglose cuántico PRO       está diseñado para impulsar su viaje comercial a nuevas alturas con su innovadora y dinámica estrategia de zona de ruptura. El indicador de ruptura cuántica le dará flechas de señal en las zonas de ruptura con 5 zonas
Gartley Hunter Multi
Siarhei Vashchylka
5 (5)
Gartley Hunter Multi - An indicator for searching for harmonic patterns simultaneously on dozens of trading instruments and on all classic timeframes: (m1, m5, m15, m30, H1, H4, D1, Wk, Mn). Manual (Be sure to read before purchasing) | Version for MT4 Advantages 1. Patterns: Gartley, Butterfly, Shark, Crab. Bat, Alternate Bat, Deep Crab, Cypher 2. Simultaneous search for patterns on dozens of trading instruments and on all classic timeframes 3. Search for patterns of all possible sizes. Fr
TrendDecoder Premium MT5
Christophe, Pa Trouillas
5 (1)
Identifique los rangos y los próximos movimientos probables  |  Obtenga las señales más tempranas y la fuerza de las Tendencias   |  Obtener salidas claras antes de reversión   |  Detecte los niveles de Fibo que el precio pondrá a prueba   |  Indicador no repintado y no retardado - ideal para la trading manual y automatizada - adecuado para todos los activos y todas las unidades temporales 69$   para el lanzamiento - luego de nuevo a >>   $ 149 Después de la compra,   póngase en contacto con mi
TPSpro TRENDPRO  - is a trend indicator that automatically analyzes the market and provides information about the trend and each of its changes, as well as giving signals for entering trades without redrawing! The indicator uses each candle, analyzing them separately. referring to different impulses - up or down impulse. Exact entry points into transactions for currencies, crypto, metals, stocks, indices!  -  Version MT4                  DETAILED DESCRIPTION        /       TRADING SETUPS       
Was: $249  Now: $99   Market Profile defines a number of day types that can help the trader to determine market behaviour. A key feature is the Value Area, representing the range of price action where 70% of trading took place. Understanding the Value Area can give traders valuable insight into market direction and establish the higher odds trade. It is an excellent addition to any system you may be using. Inspired by Jim Dalton’s book “Mind Over Markets”, this indicator is designed to suit the
Golden Spikes Detector
Batsirayi L Marango
5 (1)
Golden Spikes Detector Este indicador se basa en una estrategia avanzada principalmente para negociar picos en índices de auge y caída. Se implementaron algoritmos complejos para detectar únicamente entradas de alta probabilidad. Alerta sobre posibles entradas de Compra y Venta. Para negociar picos en el corredor Deriv o Binary, solo acepte las alertas Buy Boom y Sell Cash. Se optimizó para cargarse en un período de tiempo de 5 minutos, aunque se realiza un análisis de múltiples períodos de tiem
Matrix Arrow Indicator MT5
Juvenille Emperor Limited
5 (14)
Matrix Arrow Indicator MT5   es una tendencia única 10 en 1 que sigue un indicador   100% sin repintado   de marcos temporales múltiples que se puede usar en todos los símbolos/instrumentos:   divisas ,   materias primas ,   criptomonedas ,   índices ,   acciones .  Matrix Arrow Indicator MT5  determinará la tendencia actual en sus primeras etapas, recopilando información y datos de hasta 10 indicadores estándar, que son: Índice de movimiento direccional promedio (ADX) Índice de canales de prod
IX Power MT5
Daniel Stein
5 (2)
IX Power   lleva por fin la insuperable precisión de FX Power a los símbolos que no son de Forex. Determina con exactitud la intensidad de las tendencias a corto, medio y largo plazo de tus índices, acciones, materias primas, ETF e incluso criptodivisas favoritas. Puede   analizar todo lo   que su terminal le ofrece. Pruébalo y experimenta cómo   tu timing mejora significativamente   a la hora de operar. Características principales de IX Power Resultados de cálculo 100% precisos y sin rep
Strong Support mt5
Vasiliy Strukov
5 (9)
Los niveles de soporte y resistencia han sido durante mucho tiempo la herramienta más poderosa para el análisis del mercado. Strong Support el indicador construye los niveles de soporte en los mínimos locales del precio, y los niveles de resistencia en los máximos locales del precio. Mis otros desarrollos se pueden ver aquí Se recomienda usar junto con el indicador de tendencia, por ejemplo, Gold Stuff : esto le permitirá operar en la tendencia y al mismo tiempo determinar las zonas de cons
Golden Gate Algo MT5
James David Lane
4 (6)
¡40% DE DESCUENTO PARA NAVIDAD! ¡AUMENTO DE PRECIO A $250 EL 1 DE ENERO! Presentamos GoldenGate Entries: ¡Una Solución de Trading de Vanguardia! Descubre un enfoque revolucionario para el trading con GoldenGate Entries (GGE), un indicador avanzado diseñado para elevar tu experiencia de trading. GGE proporciona un conjunto completo de características para capacitar a los usuarios con precisión y confianza en sus decisiones comerciales. Pares: Cualquiera (FX - Materias primas - Acciones - A
Trend Scanner mt5 GS
Vasiliy Strukov
5 (14)
Escáner de tendencias escanea las tendencias del mercado desde marcos de múltiples símbolos y múltiples tiempos y las muestra en un panel móvil en el gráfico. Utiliza el indicador Gold Stuff para analizar. Las funciones incluyen alertas y correo electrónico, así como notificaciones automáticas. El comerciante puede seleccionar varios pares de su elección para su visualización. Trend Scanner es una gran herramienta para ver la dirección de la tendencia y se puede utilizar para el comercio manual
Bill Williams Advanced
Siarhei Vashchylka
5 (3)
Bill Williams Advanced is designed for automatic chart analysis using Bill Williams' "Profitunity" system. The indicator analyzes four timeframes at once. Manual (Be sure to read before purchasing) Advantages 1. Automatically analyzes the chart using the "Profitunity" system of Bill Williams. The found signals are placed in a table in the corner of the screen. 2. Equipped with a trend filter based on the Alligator indicator. Most of the system signals are recommended to be used only accordi
TrendMaestro5
Stefano Frisetti
note: this indicator is for METATRADER4, if you want the version for METATRADER5 this is the link:  https://www.mql5.com/it/market/product/108106 TRENDMAESTRO recognizes a new TREND in the bud, he never makes mistakes. The certainty of identifying a new TREND is priceless. DESCRIPTION TRENDMAESTRO identifies a new TREND in the bud, this indicator examines the volatility, volumes and momentum to identify the moment in which there is an explosion of one or more of these data and therefore the mome
El patrón 123 es uno de los patrones de gráficos más populares, potentes y flexibles. El patrón se compone de tres puntos de precio: un fondo, un pico o valle, y un retroceso de Fibonacci entre 38.2% y 71.8%. Un patrón se considera válido cuando el precio se rompe más allá del último pico o valle, momento en el que el indicador traza una flecha, levanta una alerta y se puede colocar el comercio. [ Guía de instalación | Guía de actualización | Solución de problemas | FAQ | Todos los productos ]
TPA True Price Action indicator reveals the true price action of the market makers through 100% non-repainting signals strictly at the close of a candle! TPA shows entries and re-entries, every time the bulls are definitely stronger than the bears and vice versa. Not to confuse with red/green candles. The shift of power gets confirmed at the earliest stage and is ONE exit strategy of several. There are available now two free parts of the TPA User Guide for our customers. The first "The Basics"
Otros productos de este autor
Volume Profile Institutional Live
Agustinus Biotamalo Lumbantoruan
3 (1)
Unlock the Power of Market Analysis with Precision Are you ready to take your trading to the next level? The "Institutional Volume Profile" indicator is here to empower your trading decisions like never before. Key Features: Custom Volume Profiles : Plot volume profiles effortlessly by simply adding horizontal lines or Fibonacci tools on your MetaTrader 5 chart. There's no limit to how many profiles you can create. Insightful Visualization : The indicator beautifully displays crucial information
The Stochastic Momentum Index (SMI), developed by William Blau and featured in the January 1993 edition of Technical Analysis of Stocks & Commodities magazine, introduces a unique perspective to trading analysis. Distinguished from the conventional Stochastic Oscillator, which evaluates the current close in relation to the recent x-period high/low range, the SMI assesses the close's position relative to the midpoint of this range. This innovation yields an oscillator with a range of +/- 100, re
FREE
Lunatic
Agustinus Biotamalo Lumbantoruan
Ever wonder how to apply zodiac and moon cycle on your trading? Don't get me wrong, moon cycle doesn't give you when to buy or when to sell. But it gives you a different time frame that isn't shown in minutes, hourly or daily time frame. Pay attention to the market movement during New Moon and Full Moon Phases. Set to True "Use 4 Phases Only". Often the market is trending during these phases. ================ This indi also shows you the current trend of the market and it paints a candle on eac
Draw HTF Candle on LTF Candle
Agustinus Biotamalo Lumbantoruan
This indi lets you plot higher time frame candle stick (Japanese Candlestick or Heiken Ashi Candlestick). This indicator could greatly help your trading style either its scalping, day trading or swing trading as it shows you the higher time frame candlesticks activity while you are about to pull a trigger on your trade. The candlesticks will only appear on a time frame that is lower than the higher time frame. It won't draw if the current time frame is equal to or higher than the time frame set
Super Gator
Agustinus Biotamalo Lumbantoruan
This indi shows the following 1. Supertrend 2. Alligator (Not a regular alligator) 3. ZigZag 4. Moving Average 5. Trend Continuation/Mini correction Signal (plotted in X) (See screenshots in green background color 6. Early Signal Detection (See screenshots in green background color) You may treat Alligator as the lagging indicator The leading indicator is the supertrend. The zig zag is based on the leading indicator where it gets plotted when the leading indicator got broken to the opposite.
One Four Four 144
Agustinus Biotamalo Lumbantoruan
This indicator displays support and resistance at fixed levels. The level won't change regardless how many days or minutes has gone by. There are 7 levels start from green ends at gray color. Imagine it like do (green),re,mi,fa,sol,la,si,DO (green) Market often goes one octave from do to DO or fa to FA. You will see this occurring at all markets This indicator can be used to spot your take profit or stop loss target. It can be also used to find support and resistance or supply and demand.
Richter Scale
Agustinus Biotamalo Lumbantoruan
This oscillator helps you to identify sideways movement that allows you to close your current position before you place a new position. It's simple straight and forward. When the indicator is flat, it indicates it's trending. When the indicator is printing at the extreme low (-1)/high(1) back and forth like a Richter scale graph, it indicates the market is in correction (sideway/diagonally). I call this earthquake, this is the opportunity for you to either take partial profit or open positio
Institutions Price Action Indicator
Agustinus Biotamalo Lumbantoruan
This indicators analyze particular candle that determines the trend. It has 2 graphic lines Moving average and dynamic support & resistance line The colored MA is a leading indicator Dynamic & Support resistance is a lagging indicator to confirm or strengthen the leading indicator The candle also draws what institution candle in by default in blue color with green or red outline. Green outline with blue body, indicate a very strong bullish candle Red outline with blue body, indicate a very stron
Institutional Order Block
Agustinus Biotamalo Lumbantoruan
This indicator doesn't repaint & shows several things 1) Order Block 2) Imbalance candle stick (the icon is a vertical rectangle) 3) Swings (zigzag), 3 to be exact (minor, major and external major zigzags). If you know market structure, you should understand internal & external trends. Minor & major are internal trends of external major in this indicator. 4) Supply & Demand (arrow icon) 5) Major supply & demand (purple arrow) 6) Range/Bias lines (only shown in time frame 1hour & lower) 7) Previo
Supreme Institution RSI
Agustinus Biotamalo Lumbantoruan
Supreme Institution RSI helps traders to spot the trend with RSI. The RSI will change color accordingly and it can be set from the input. This indicator could aids your decision making before pulling the trigger. Just see the color and use it to aid your decision making. Any period works, any timeframe works, any instrument works. You could add 2 of them to your chart, one with period 3 (Fast) and another with period 16 (Slow). The default period is 3. If asked for recommendation, I'd recommend
Institutional Fractal
Agustinus Biotamalo Lumbantoruan
Introducing our innovative Fractal Trend Indicator – a powerful tool designed to help you navigate the financial markets with ease. This user-friendly indicator utilizes fractals to provide valuable insights into market trends while allowing you to customize your visual cues for trend identification. Fractal Clarity: Our indicator employs dots to highlight fractal points, clarifying their significance in the market. These dots do not signify the trend themselves but serve as crucial reference p
Institutional Bollinger Band
Agustinus Biotamalo Lumbantoruan
The Bollinger Band Indicator, favored by institutional traders, offers a swift and comprehensive assessment of market conditions. It's an indispensable tool to distinguish between trending and sideways markets. This multifaceted indicator provides insights through three distinct means: Bollinger Bands, candle analysis, zigzag, and external swing. Trend Analysis: Bollinger Band Color: This feature uses green for bullish and red for bearish trends, offering a clear visual distinction. Candle Colo
Institutional Alligator Structure
Agustinus Biotamalo Lumbantoruan
Introducing our advanced indicator, which builds upon the foundation of the renowned William's Alligator indicator—a powerful tool in technical analysis. Our enhanced indicator offers valuable insights into market trends through three distinct methods, empowering traders with comprehensive market analysis. Alligator Indicator Expansion: This innovative indicator harnesses the essence of the Williams Alligator by closely monitoring its three crucial components: the lips, teeth, and jaws. When the
Swing Tunnel Institutional Structure
Agustinus Biotamalo Lumbantoruan
Introducing our dynamic Swing Tunnel indicator, a powerful and straightforward tool designed to simplify market analysis while providing invaluable insights for traders. This versatile indicator relies on the interplay of two moving averages, forming a visual "tunnel" that changes color, offering clear signals for bullish and bearish market conditions. Let's delve into its features: Swing Tunnel Color Change: The heart of this indicator lies in the Swing Tunnel—a visual representation of marke
Golden Death Cross
Agustinus Biotamalo Lumbantoruan
Elevate Your Forex Trading with the "Gold Death Cross" Indicator! Are you ready to take your Forex trading game to the next level and harness the power of time-tested technical analysis techniques? Look no further! The "Gold Death Cross" indicator is here to revolutionize your trading experience and maximize your profit potential. Unlock the Wisdom of Multiple Moving Averages: The "Gold Death Cross" indicator doesn't just stop at one moving average; it brings you the combined insight of four mo
Swing Volume Profile
Agustinus Biotamalo Lumbantoruan
Are you tired of sifting through endless charts and data to make informed trading decisions? Look no further! The Swing Volume Profile is here to revolutionize your trading experience. With its cutting-edge features, this tool provides you with the insights you need to navigate the dynamic world of financial markets with confidence. Feature 1: Volume Profile Measured from Major Swing High to Major Swing Low   Accurate volume analysis is key to making informed trading decisions. The Swing Volume
Anchored VWAP Channel Bands
Agustinus Biotamalo Lumbantoruan
Point and Plot:  The Anchored VWAP with Channel Bands tool is designed for traders of all levels, from beginners to seasoned professionals. Point to the price level you want to anchor to, plot the horizontal line, and watch as this versatile tool transforms your trading approach. User-Friendly Interface : Navigate the tool effortlessly with a user-friendly interface that ensures you never miss a crucial detail. Real-Time Analysis : Make informed decisions in real time with dynamic data that upda
Filtro:
No hay comentarios
Respuesta al comentario
Versión 1.22 2023.11.01
-Tenkansen logic update
-Kijunsen logic update
Versión 1.21 2023.11.01
- update to the candlestick color logic change color when ichimoku key level breaks
Versión 1.20 2023.10.07
fix to the POC projection
Versión 1.19 2023.10.05
improvement
Versión 1.18 2023.09.30
improvement
Versión 1.17 2023.09.29
-value area update
Versión 1.16 2023.09.29
-volume object update
Versión 1.15 2023.09.29
-volume profile value area update
Versión 1.14 2023.09.28
-code optimization
-initial volume profile setting is plotted to 10. It can be change from the input parameter "initial amount of plotted volume profile
Versión 1.13 2023.09.27
- update to vol profile color
Versión 1.12 2023.09.26
- optimization
Versión 1.10 2023.09.25
- options to draw volume from right to left
- options to hide the border of the volume
Versión 1.9 2023.09.24
- M1 TF Vol profile
Versión 1.8 2023.09.23
-code optimization
Versión 1.7 2023.09.23
-bug fix
Versión 1.6 2023.09.22
- bug fix
Versión 1.5 2023.09.22
- optimization to plotting volume profile history to the background processing
Versión 1.4 2023.09.22
- live volume profile
Versión 1.3 2023.09.22
- new feature: Volume profile
Versión 1.2 2023.09.08
-zz bugfix
Versión 1.1 2023.09.05
- internal swing (ZZ)
- external swing (channel swing high & channel swing low)