Scaled Awesome Oscillator mq5
- Indicadores
- Daniel Opoku
- Versión: 1.0
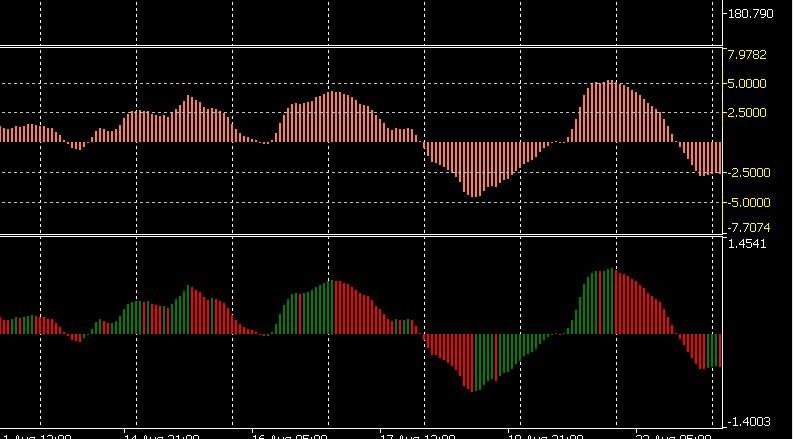
The Scaled Awesome Oscillator (SAO) represents a refined adaptation of the Awesome Oscillator, aimed at establishing consistent benchmarks for identifying market edges. Unlike the standard Awesome Oscillator, which records the variation in pips across different commodities, the only unchanging reference point is the zero line. This limitation hampers investors and traders from pinpointing specific levels for trend reversals or continuations using the traditional Awesome Indicator, a creation of Bill Williams designed for measuring market momentum.
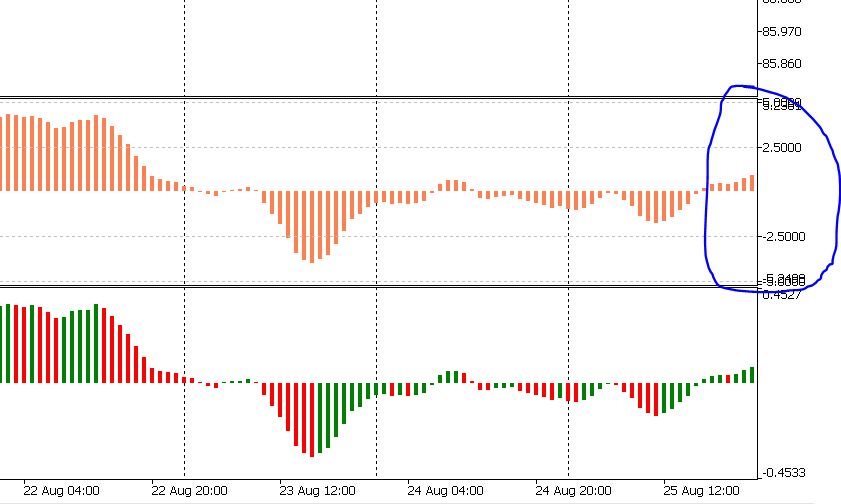
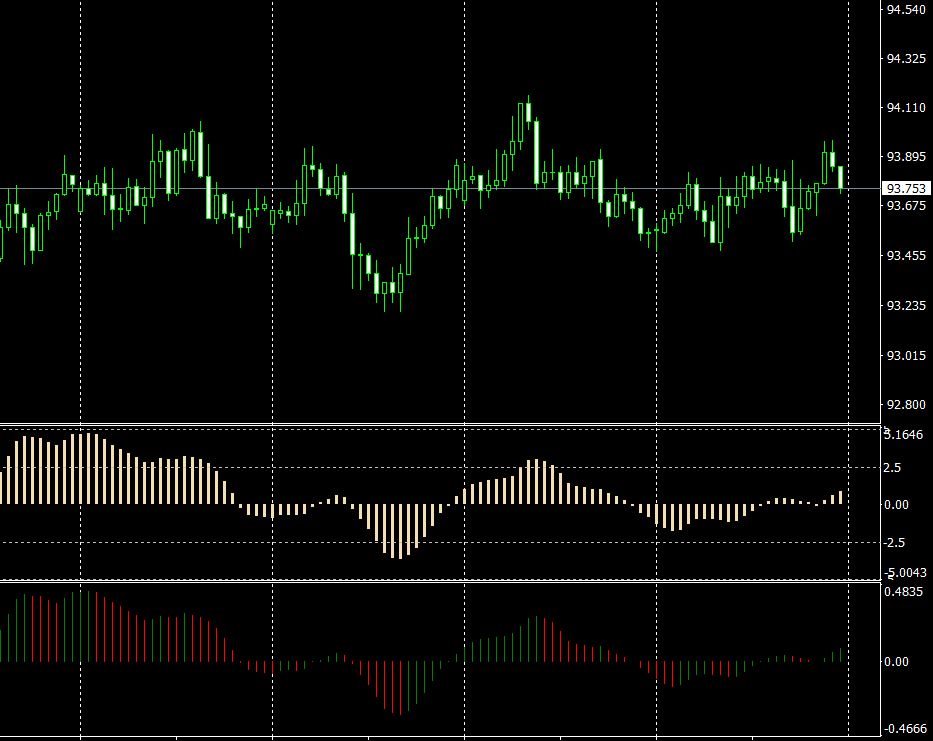
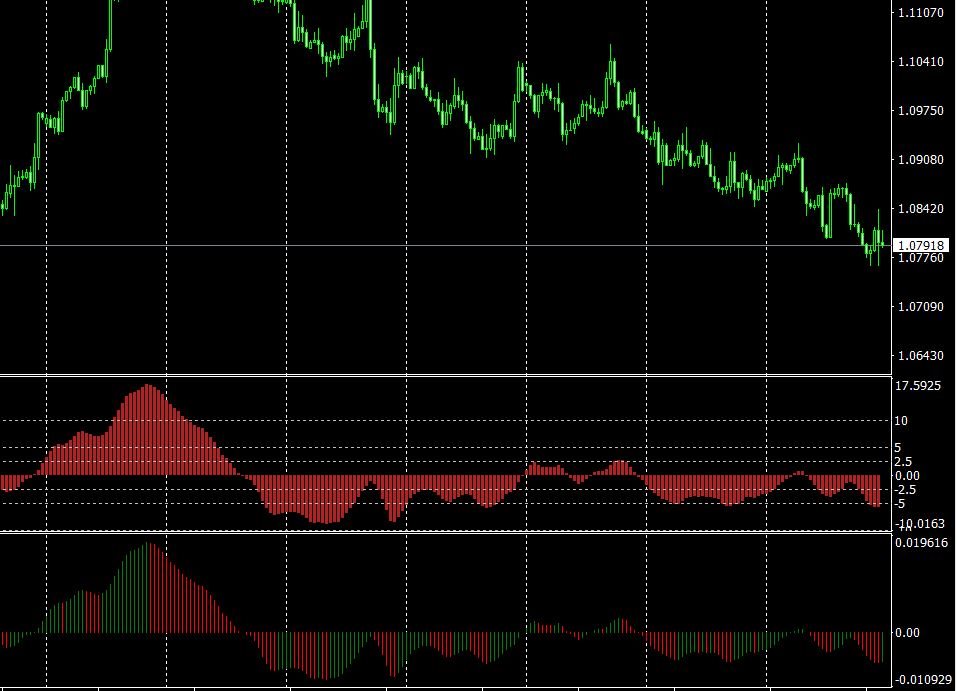
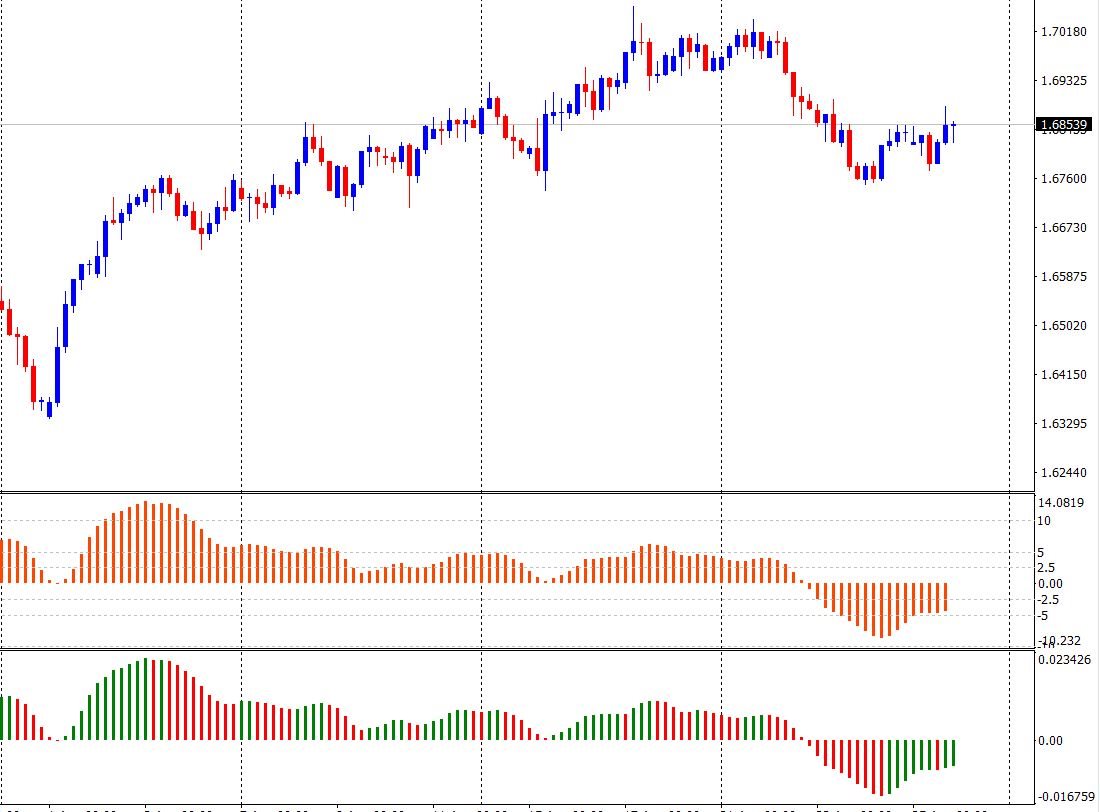
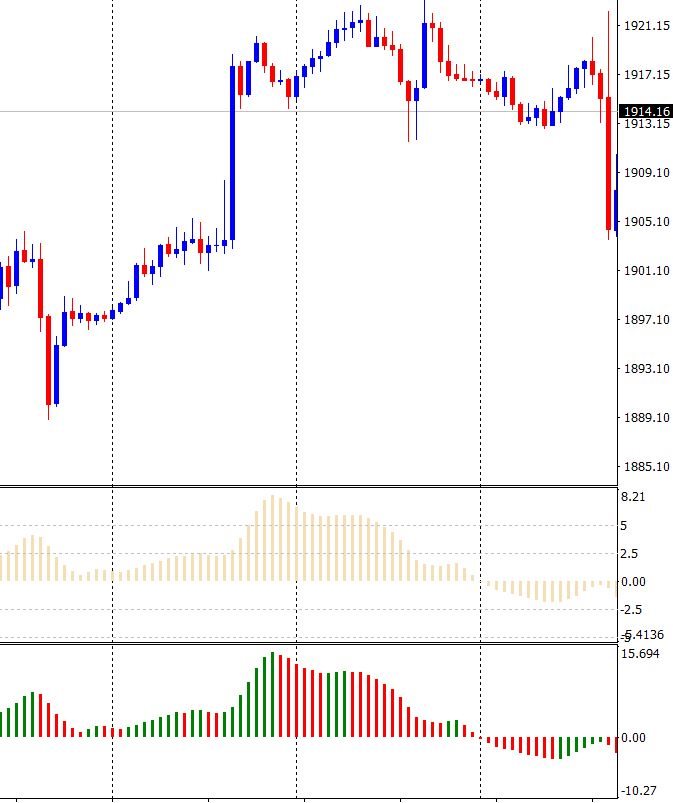
The development of the Scaled Awesome Oscillator was driven by the need to tackle the challenge of standardizing these levels across stocks, commodities, and the forex market. By default, SAO employs predefined levels (+2.5, -2.5, +5, -5, +10, -10, +20, -20) as opposed to pips, ensuring uniformity across various financial instruments like GBPJPY, Gold, AUDUSD, and more.
Besides ensuring equal footing for all financial instruments, SAO retains the core functionality of the traditional Awesome Oscillator, as its visual representation remains consistent. While the Awesome Oscillator displays two colors (typically red and green), SAO simplifies this by utilizing a single color.
Traders and investors can capitalize on this limited time offer to enhance and maximize their trading successes. Once the complimentary period expires, investors and traders will be required to make a purchase to maintain continued access and usage of the SAO indicator