ON Trade Gann Squares
- Indicadores
- Abdullah Alrai
- Versión: 1.2
- Actualizado: 22 septiembre 2023
- Activaciones: 5
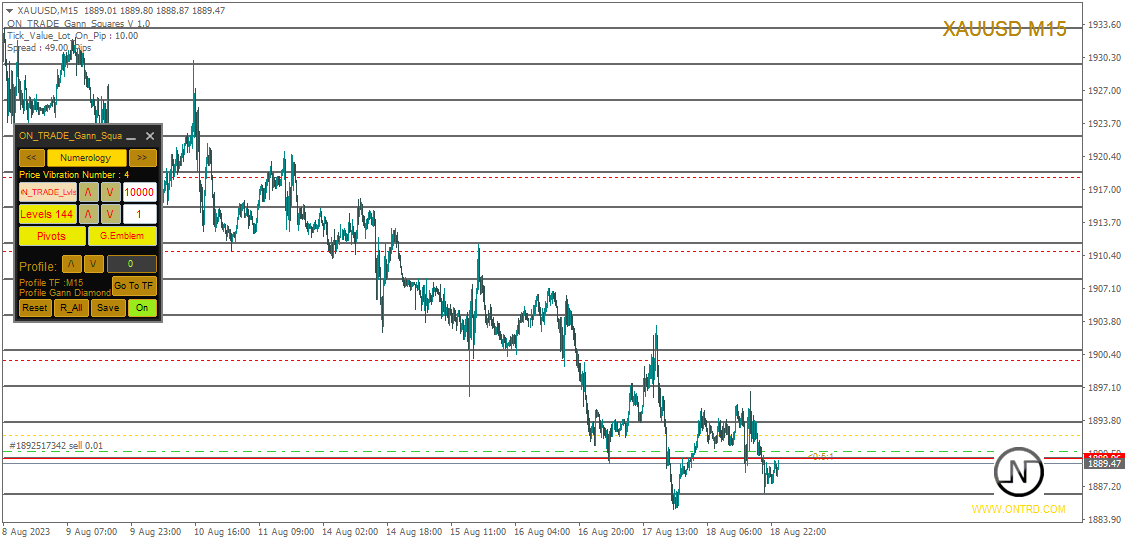
El Indicador de Cuadrados de Gann es una herramienta poderosa de análisis de mercado basada en el artículo "Fórmula Matemática para Predicciones de Mercado" escrito por W.D. Gann, que se basa en conceptos matemáticos para el análisis. Incorpora elementos de las técnicas de Gann relacionadas con los cuadrados de 144, 90 y 52, así como el cuadrado de 9. Además, incluye el método del sobre cómo combinar el cuadrado de 9 con canales y patrones de estrellas.
Manual del Usuario y Modo de Uso:
Antes de usar este indicador, le recomendamos leer el manual del usuario y ponerse en contacto con nosotros para aclarar cualquier duda. Puede encontrar el manual completo en nuestro sitio web.
La versión completa para MT5 está disponible para su compra, y también hay una versión gratuita para MT4 que puede probar. Proporcionamos enlaces a ambas versiones para su conveniencia.
Principales Características y Funcionalidades:
El Indicador de Cuadrados de Gann proporciona una serie completa de herramientas para su análisis de mercado, permitiéndole tomar decisiones informadas basadas en conceptos geométricos y la teoría de Gann. A continuación, se presentan las principales características:
-
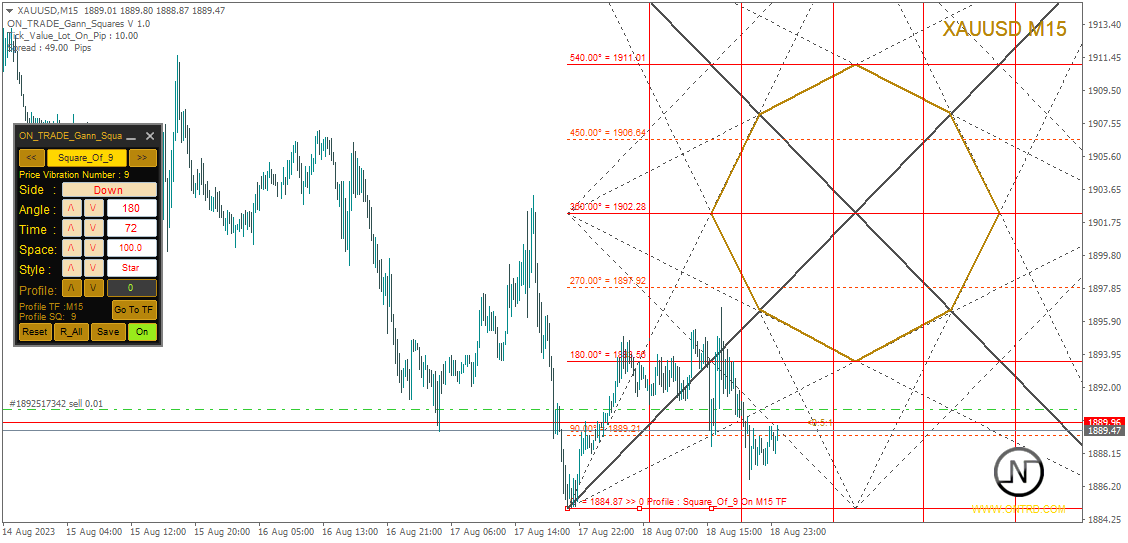
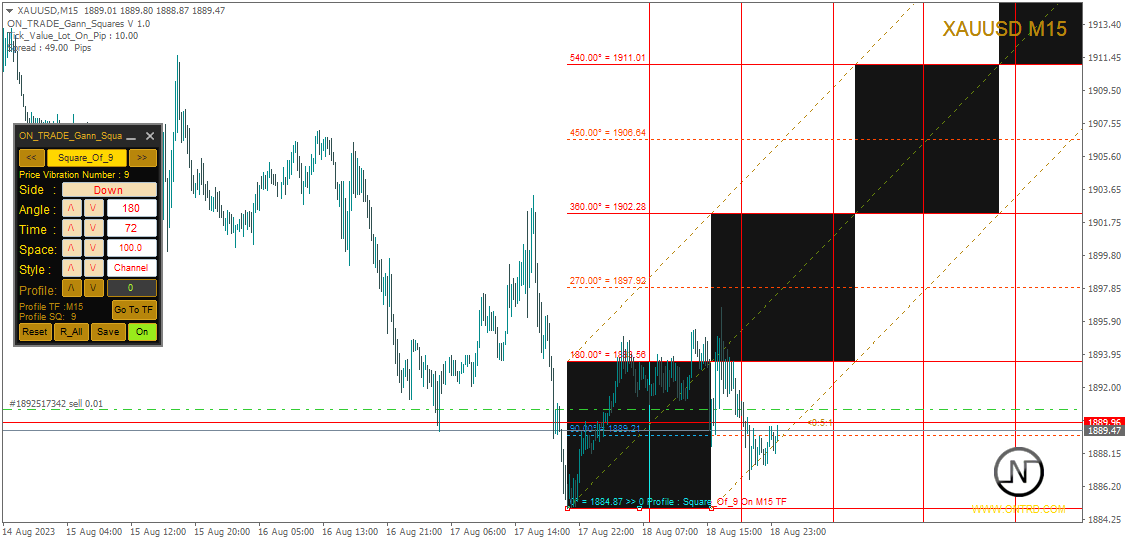
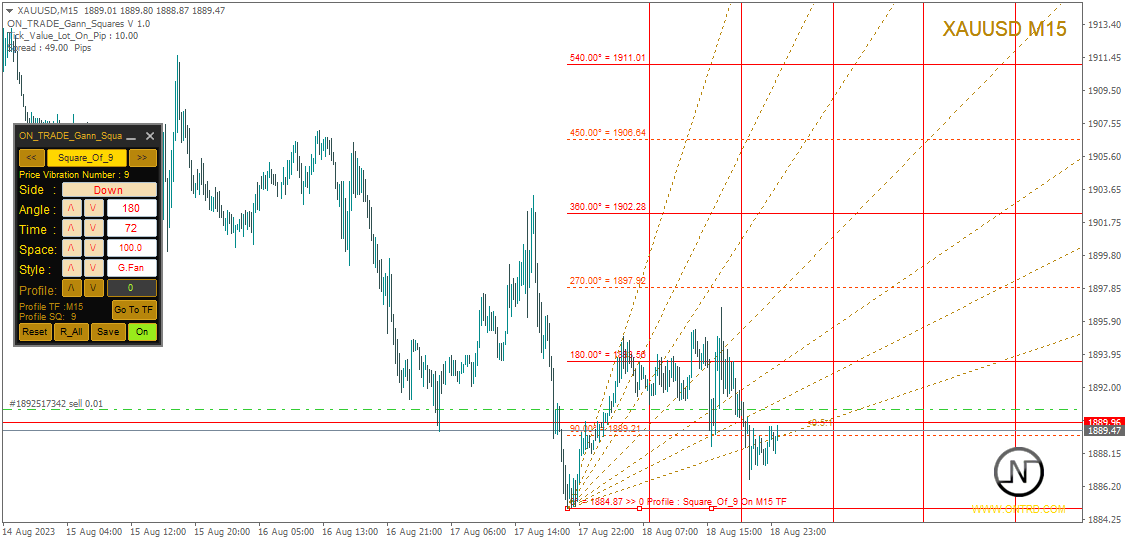
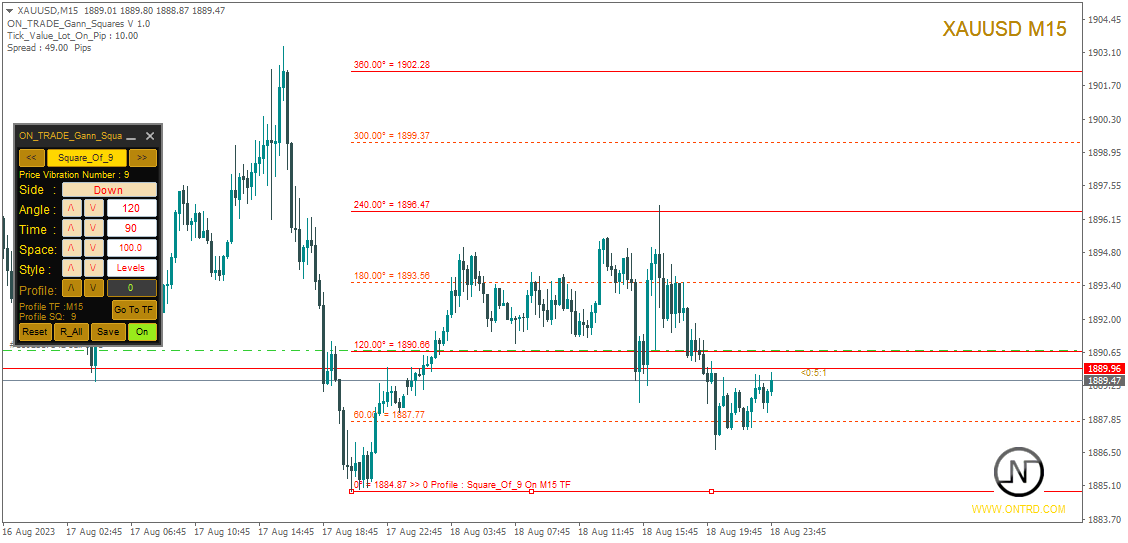
Análisis del Cuadrado de 9: El indicador puede trazar varios elementos relacionados con el cuadrado de 9, incluyendo líneas horizontales, patrones de estrellas, cuadrículas y abanicos de Gann. Esto brinda una representación visual de los conceptos geométricos de Gann en su gráfico.
-
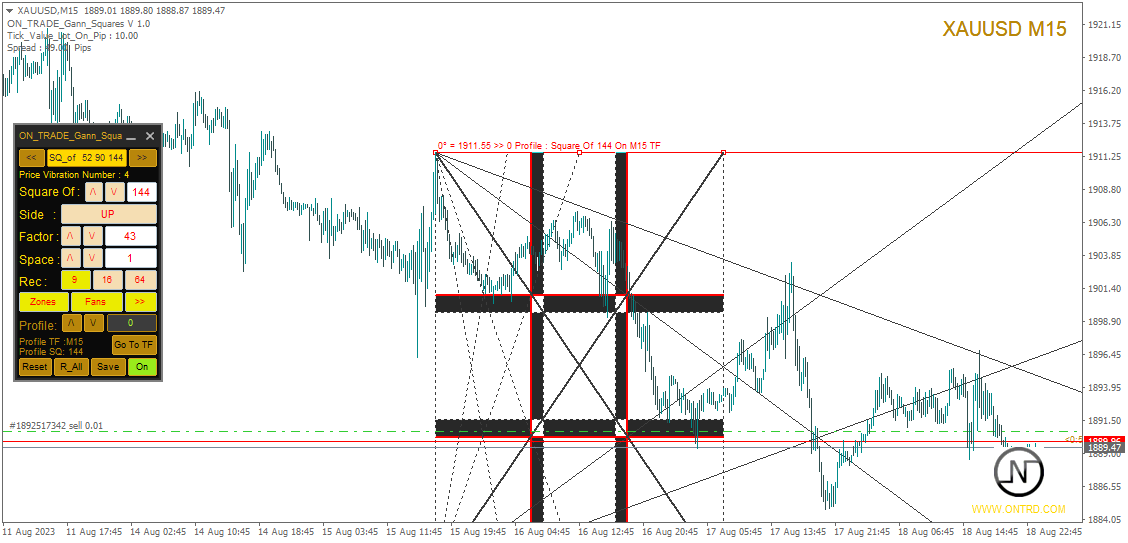
Cuadrados de Gann: El indicador traza los cuadrados de Gann de 52, 90 y 144, lo que le permite visualizar y analizar su relación con las tendencias de precios.
-
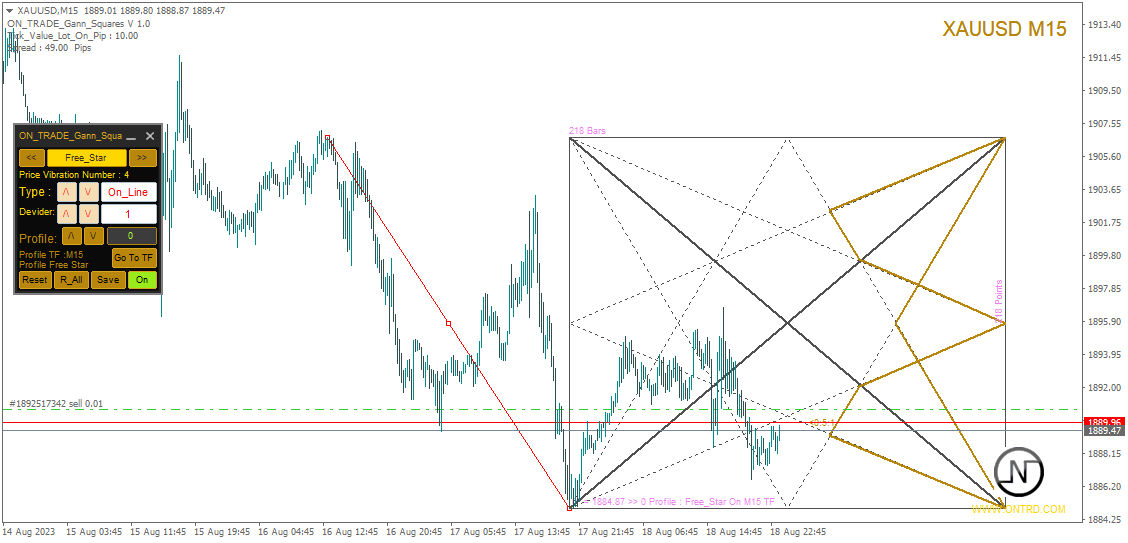
Patrón de Estrella de Gann Libre: El indicador le permite trazar una estrella de Gann libre que se puede mover directamente en el gráfico, lo que proporciona una herramienta dinámica para identificar cambios potenciales en la tendencia o puntos de reversión.
-
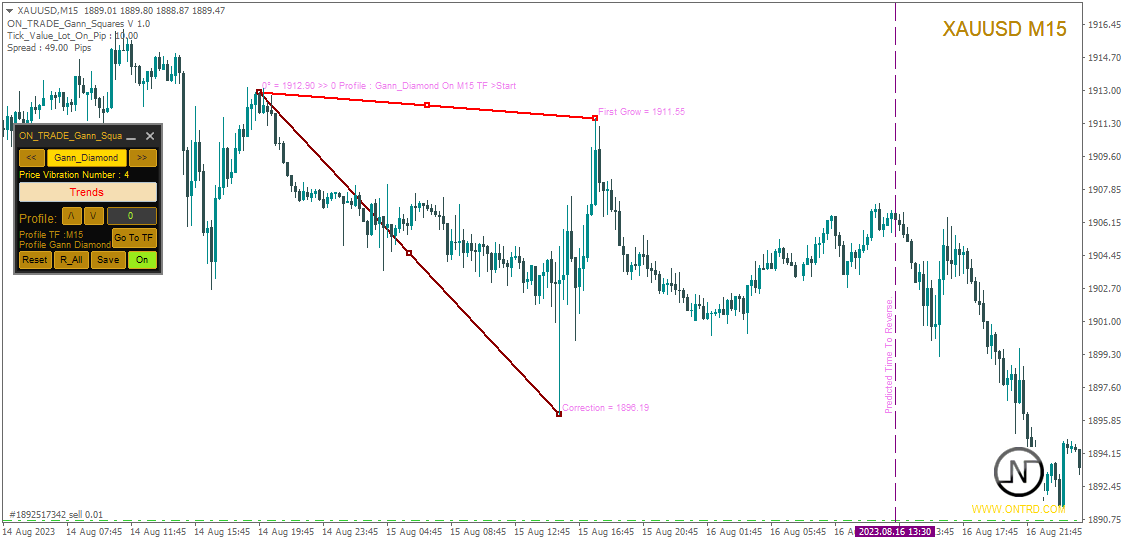
Diamante de Gann: Además de otros elementos, el indicador también incluye la capacidad de trazar un diamante de Gann, lo que mejora su capacidad para identificar patrones únicos.
-
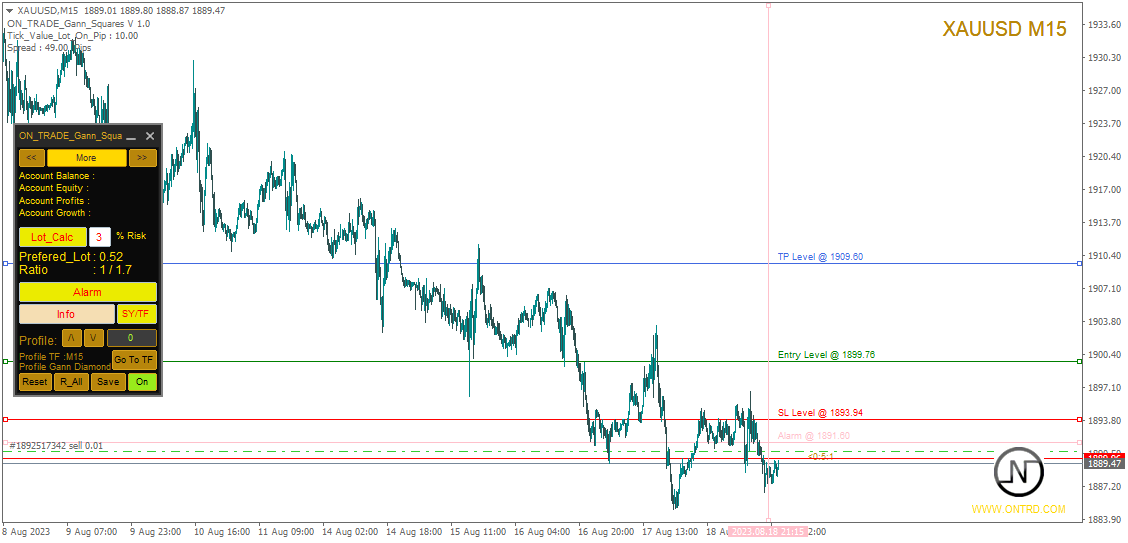
Calculadora de Lotes: El indicador incluye una calculadora de lotes que le ayuda a determinar el mejor tamaño de lote para sus operaciones.
-
Panel Amigable para el Usuario: El indicador cuenta con un panel amigable para el usuario que le permite cambiar entre opciones como "Cuadrado de 144/90/52", "Cuadrado de 9", "Estrella de Gann Libre", "Diamante de Gann", "Herramientas de Numerología", "Calculadora de Lotes" e "Información de la Cuenta".
-
Gestión de Datos: Todas las acciones realizadas con el indicador se guardan en su perfil de trading, lo que le permite cargar y descargar estos datos en cualquier momento. También puede restablecer todos los datos guardados con un solo botón.
Personalización y Parámetros:
El Indicador de Cuadrados de Gann ofrece una amplia variedad de parámetros que le permiten personalizar su apariencia y comportamiento según sus preferencias. Puede ajustar configuraciones como colores, estilos y anchos para diferentes elementos, como ángulos, cuadrados, patrones de estrellas, canales y líneas horizontales.
Conclusión:
El Indicador de Cuadrados de Gann es una herramienta versátil para los traders interesados en el análisis de Gann y la numerología. Al combinar principios matemáticos y conceptos geométricos de Gann, el indicador amplía su capacidad para identificar oportunidades de trading potenciales y tomar decisiones informadas. Para aprovechar al máximo las ventajas de este indicador, le recomendamos ver nuestros videos tutoriales y leer los recursos en PDF disponibles en nuestro sitio web.
Al igual que con cualquier herramienta de trading, comprender cómo utilizar eficazmente el indicador, practicar con datos históricos y mantenerse al día con las condiciones del mercado en tiempo real le ayudarán a tener éxito. Recuerde practicar una gestión de riesgos responsable junto con el uso de cualquier indicador o estrategia de trading.