Win rate signal Echidna
- Indicadores
- Eve sense Co., Ltd.
- Versión: 1.21
- Activaciones: 10
■ ¡12 tipos de análisis técnico incluidos! Indicador equipado con sistema de cálculo de tasa de ganancia
【Características del indicador】
Este indicador le permite confirmar de manera intuitiva y clara 12 tipos de análisis técnico normal a través de señales.
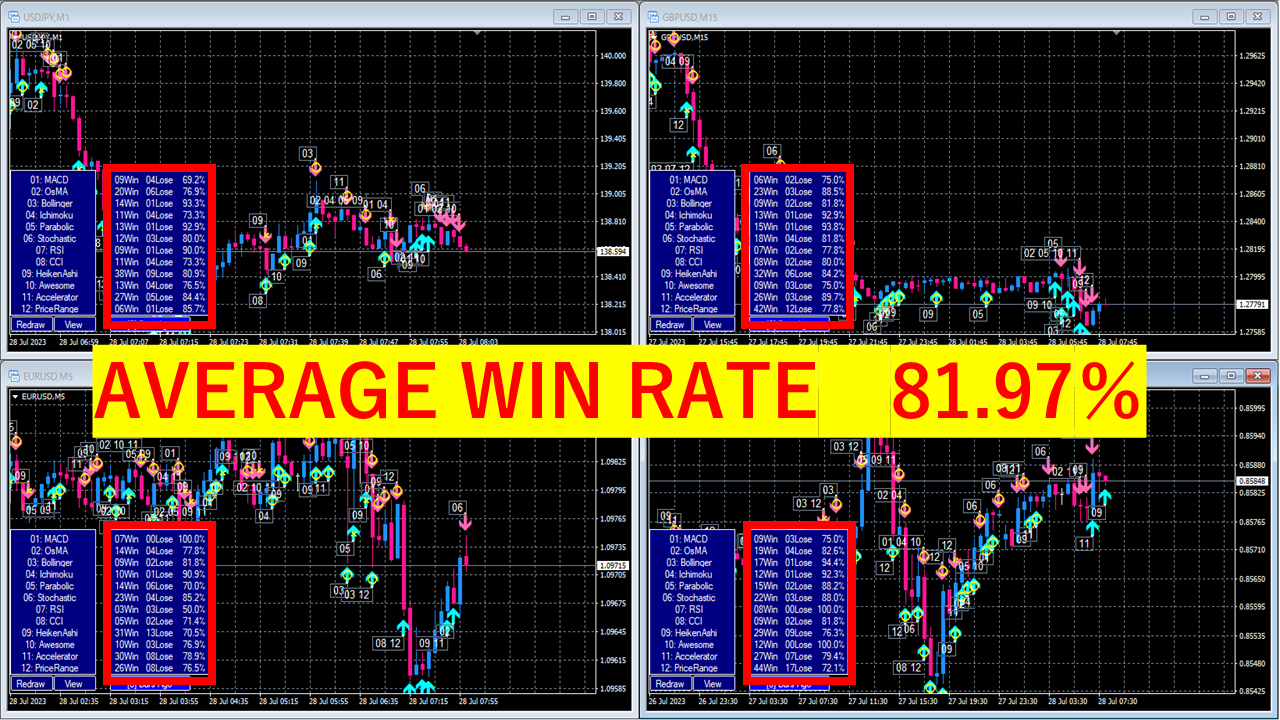
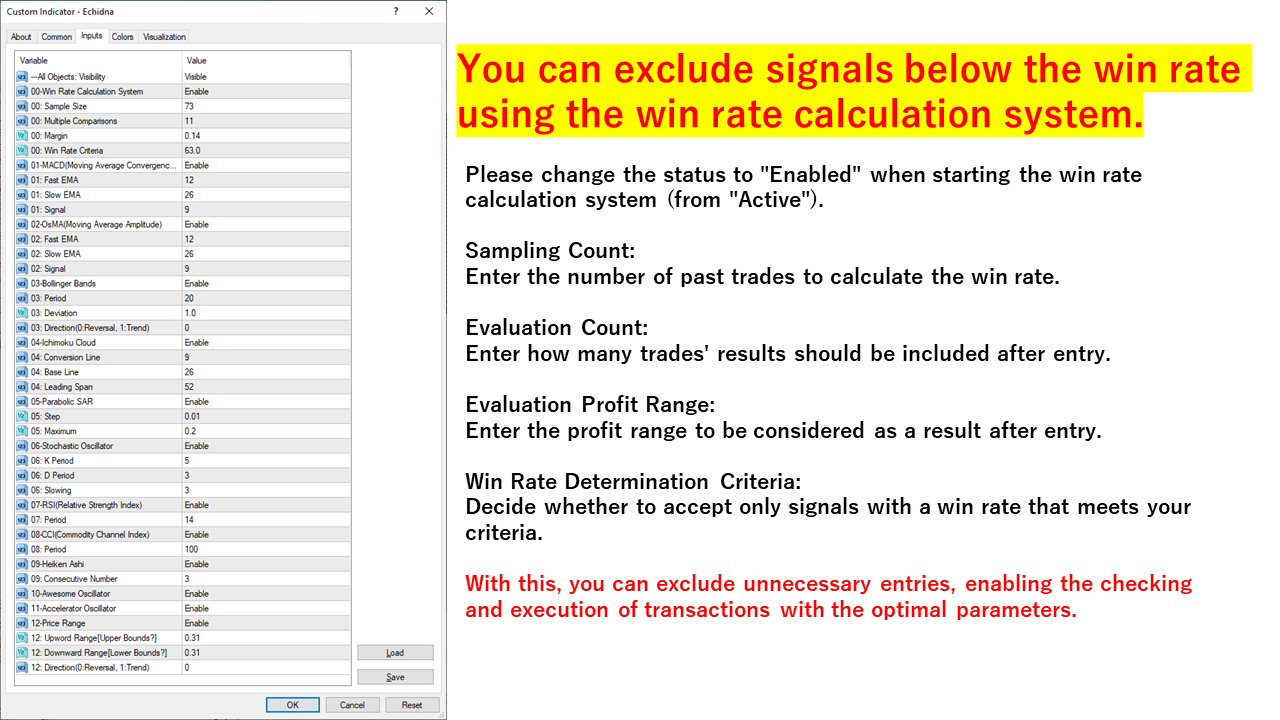
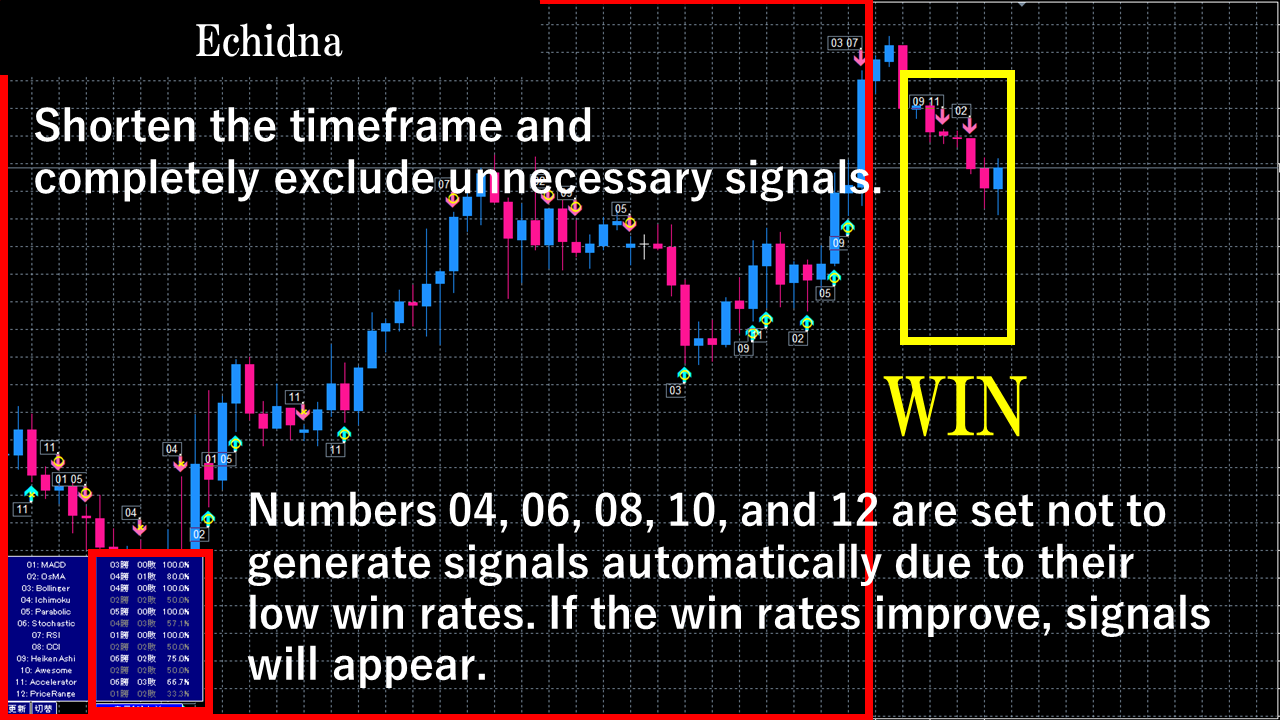
Además, tiene un sistema automático de determinación de la tasa de ganancias que verifica si los parámetros actuales son adecuados y evita emitir señales cuando la tasa de ganancias es baja.
Esto reduce las entradas innecesarias y le permite ingresar operaciones solo cuando la tasa de ganancia es alta.
【Explicación importante】
・Sin repintado. Utilizable desde gráficos de 1 minuto hasta gráficos semanales.
・Sin restricciones de divisas. Utilizable para todos los pares de divisas.
・Capacidad para calcular las tasas de ganancias.
・Las señales se generan solo cuando se alcanza la tasa de ganancias predeterminada o superior.
・¡Optimizado para reducir la carga! Adecuado para operación a largo plazo y uso simultáneo con 9 pares de divisas.
・Al ser un indicador muy conocido, permite estudiar mientras se siguen las señales.
・Los depuradores han respaldado y verificado la depuración para resolver cualquier problema.
【Explicación del signo de flecha EQUIDNA】
El indicador de signos de flecha ECHIDNA es una herramienta conveniente que proporciona 12 tipos de análisis técnico mundialmente famosos a través de "signos de flecha".
Está diseñado para facilitar su uso y permite la configuración de parámetros individuales y la eliminación de indicadores innecesarios.
Te guía con flechas en función de los aspectos técnicos que consideres importantes.
Características:
・Proporciona 12 tipos de análisis de indicadores a través de "signos de flecha".
・Comprueba las tasas de ganancias y muestra señales solo cuando se alcanza la tasa de ganancias predeterminada o superior.
・Optimizado para reducir la carga, lo que permite un uso a largo plazo.
Indicadores compatibles:
01-MACD (Media Móvil Convergencia Divergencia)
02-OsMA (promedio móvil del oscilador)
03-Bandas de Bollinger
04-Ichimoku Nube
05-SAR parabólico (parada y marcha atrás)
06-Oscilador estocástico
07-RSI (Índice de Fuerza Relativa)
08-CCI (índice de canales de productos básicos)
09-Heiken Ashi (barras promedio)
Oscilador 10-Impresionante
11-Oscilador Acelerador
Rango de 12 precios
El indicador de signo de flecha ECHIDNA es una herramienta poderosa para los comerciantes, que respalda el comercio eficiente y preciso.
¡Por todos los medios, adquiramos este indicador de ensueño y apuntemos al éxito en el comercio!