VolumeCrossOver
- Indicadores
- Daniel Opoku
- Versión: 1.0
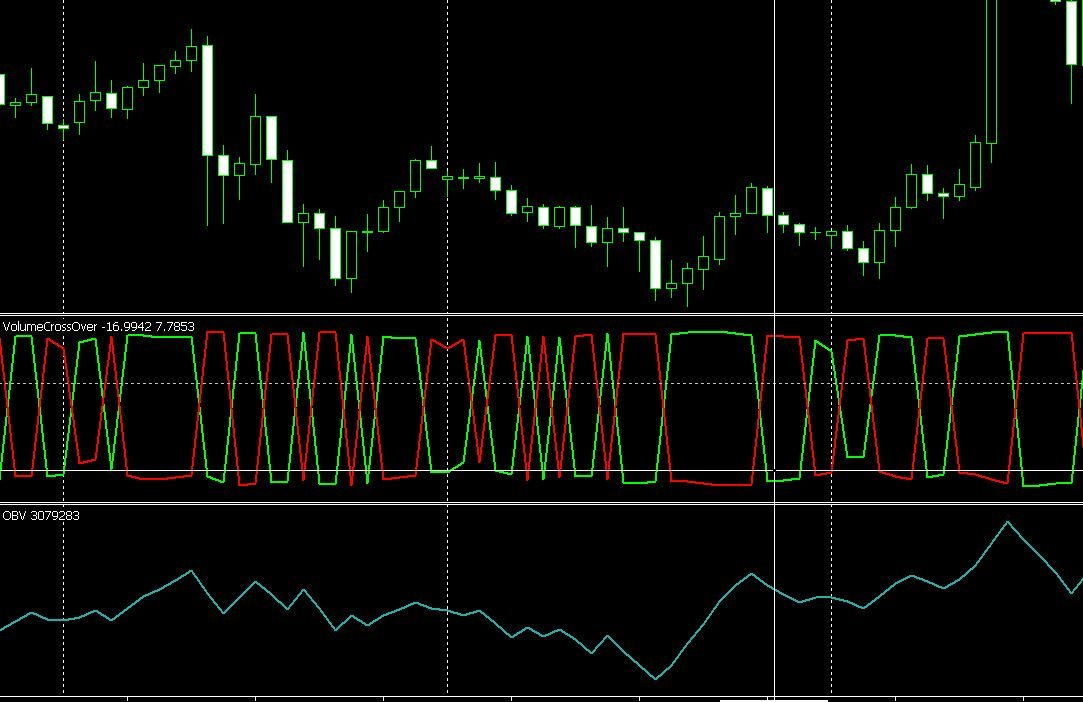
Volume Cross Over is an indicator that measure positive and negative volume flow in a financial instrument, such as a stock, commodity, or index. It is base on the idea of On-Balance Volume developed by Joseph Granville. However instead of trending lines, this indicator shows volume cross over. When the closing price of an asset is higher than the previous closing price, then the Bull volume is greater than zero and Bear volume is negative. It suggests that buying volume is dominating, and the price is likely to continue its upward trend.
Conversely, when the closing price is lower than the previous closing price, the Bear volume is greater than zero and Bull volume is negative. It indicates that selling volume is dominating, and the price may continue to decline.
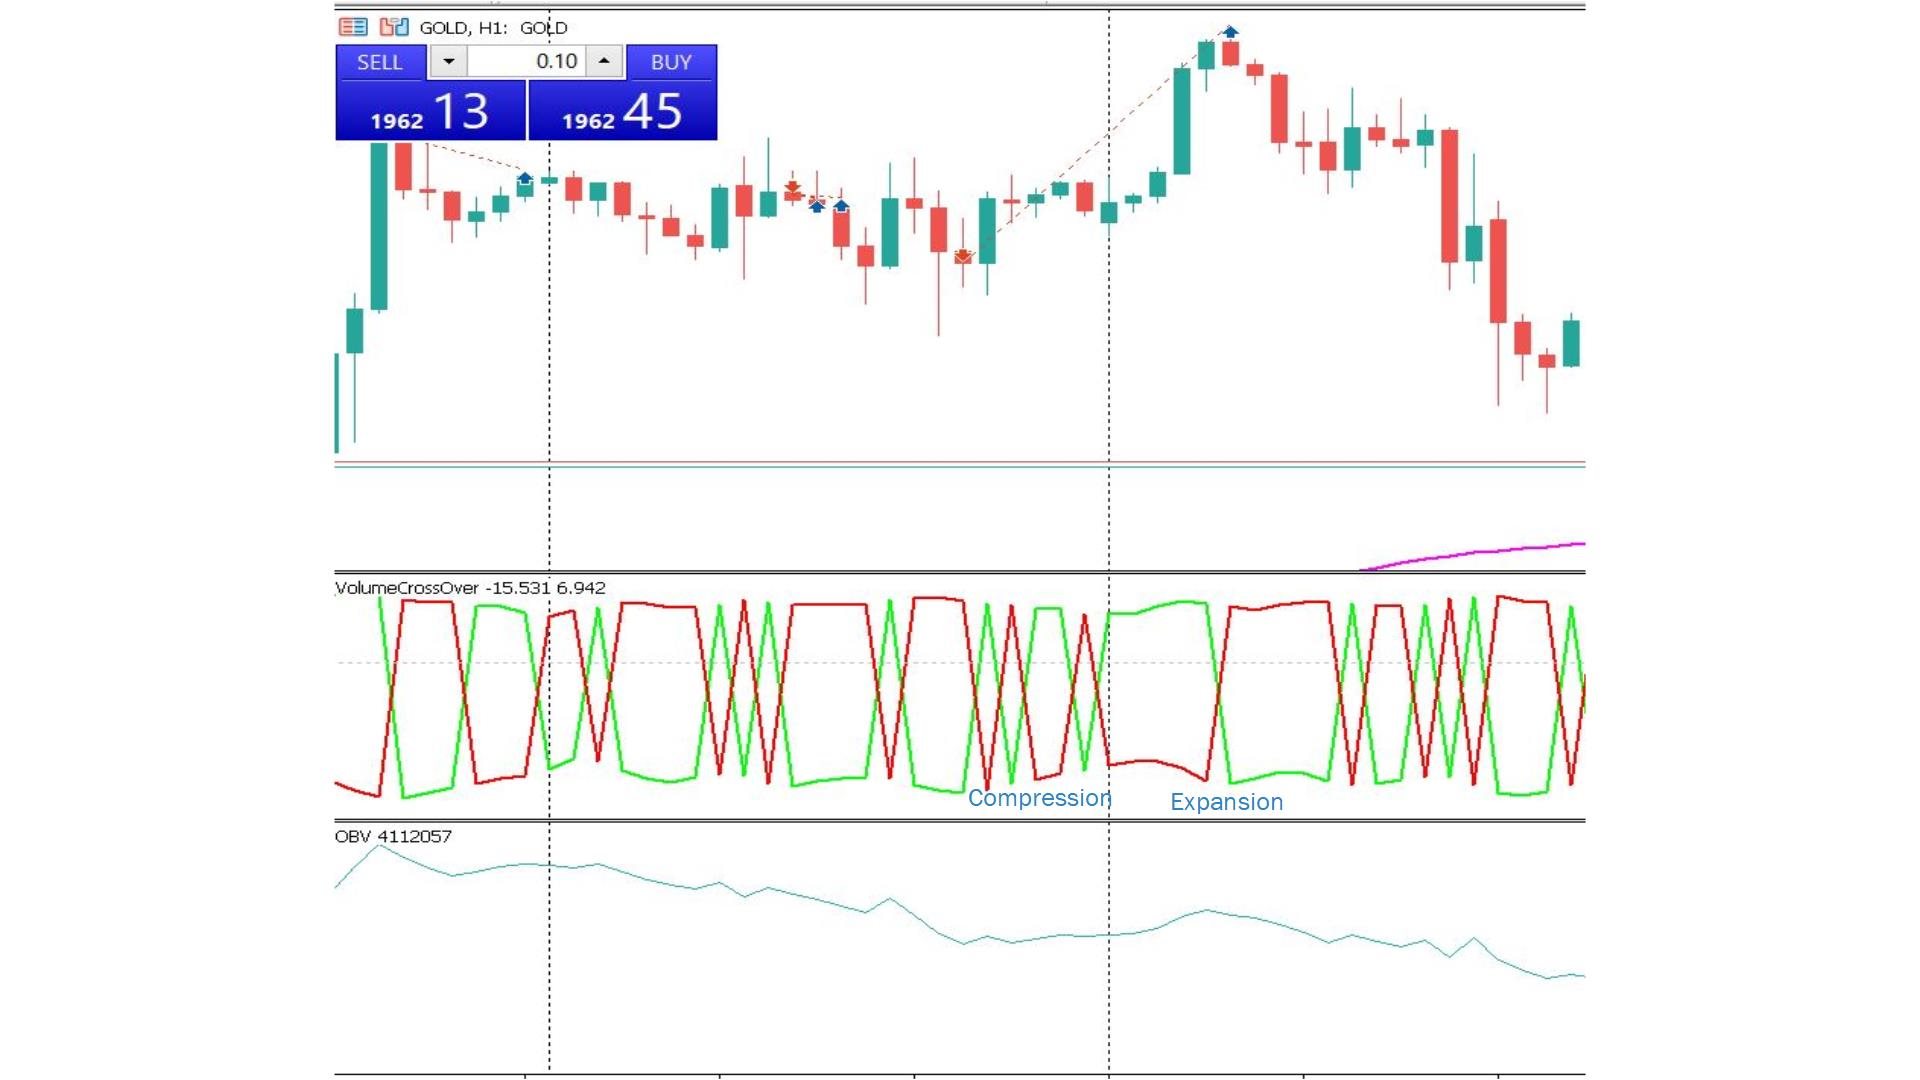
The volume cross over forms a spring-like pattern with compression and expansion period. Every compression is followed by an expansion and vice versa. It can be
Advantage:
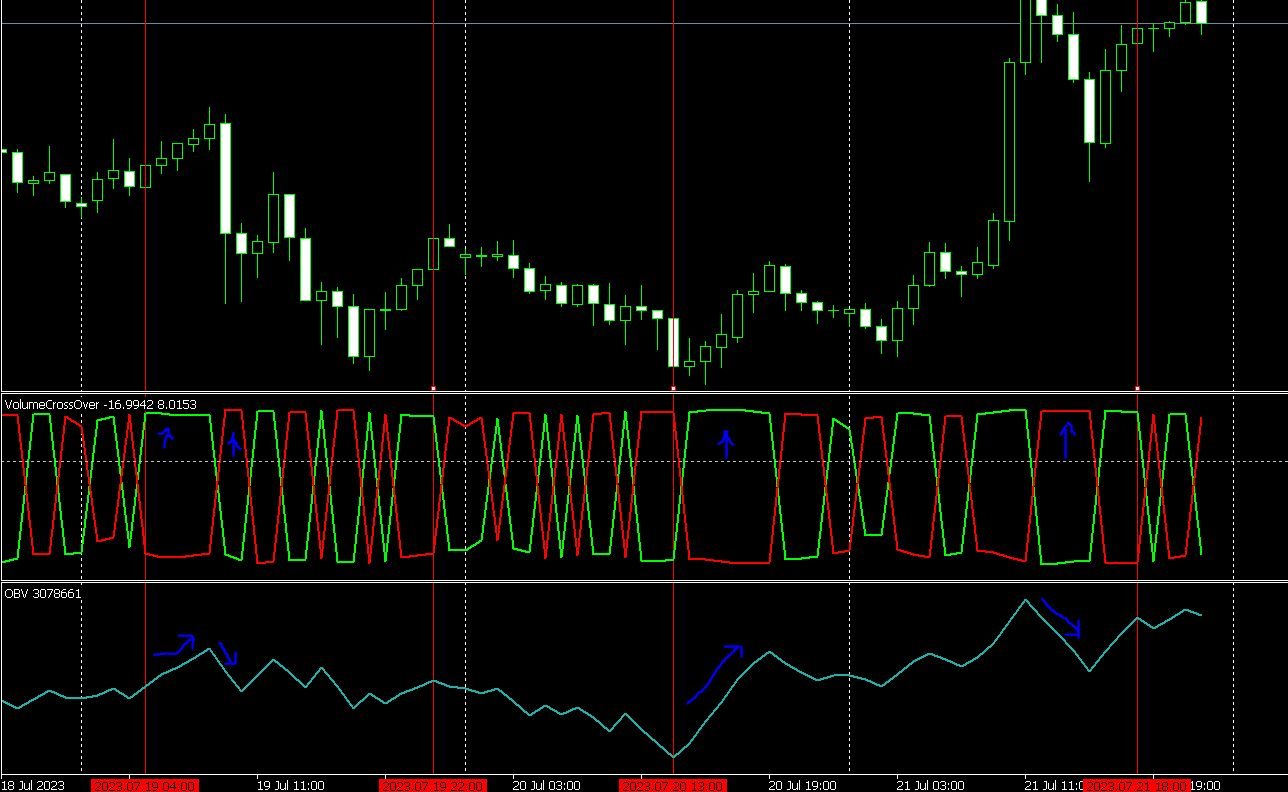
- The compression and expansion of this indicator enables traders to identify potential market entry. Once there is expansion, contraction follows and vice versa.
- It is a leading indicator as in the case of on-balance volume.
Disadvantage:
- It does not indicate divergence between the price and the indicator as in the case of on-balance volume.