Speed Meter MT5
- Indicadores
- Ahmed Soliman
- Versión: 1.1
- Actualizado: 17 junio 2023
- Activaciones: 10
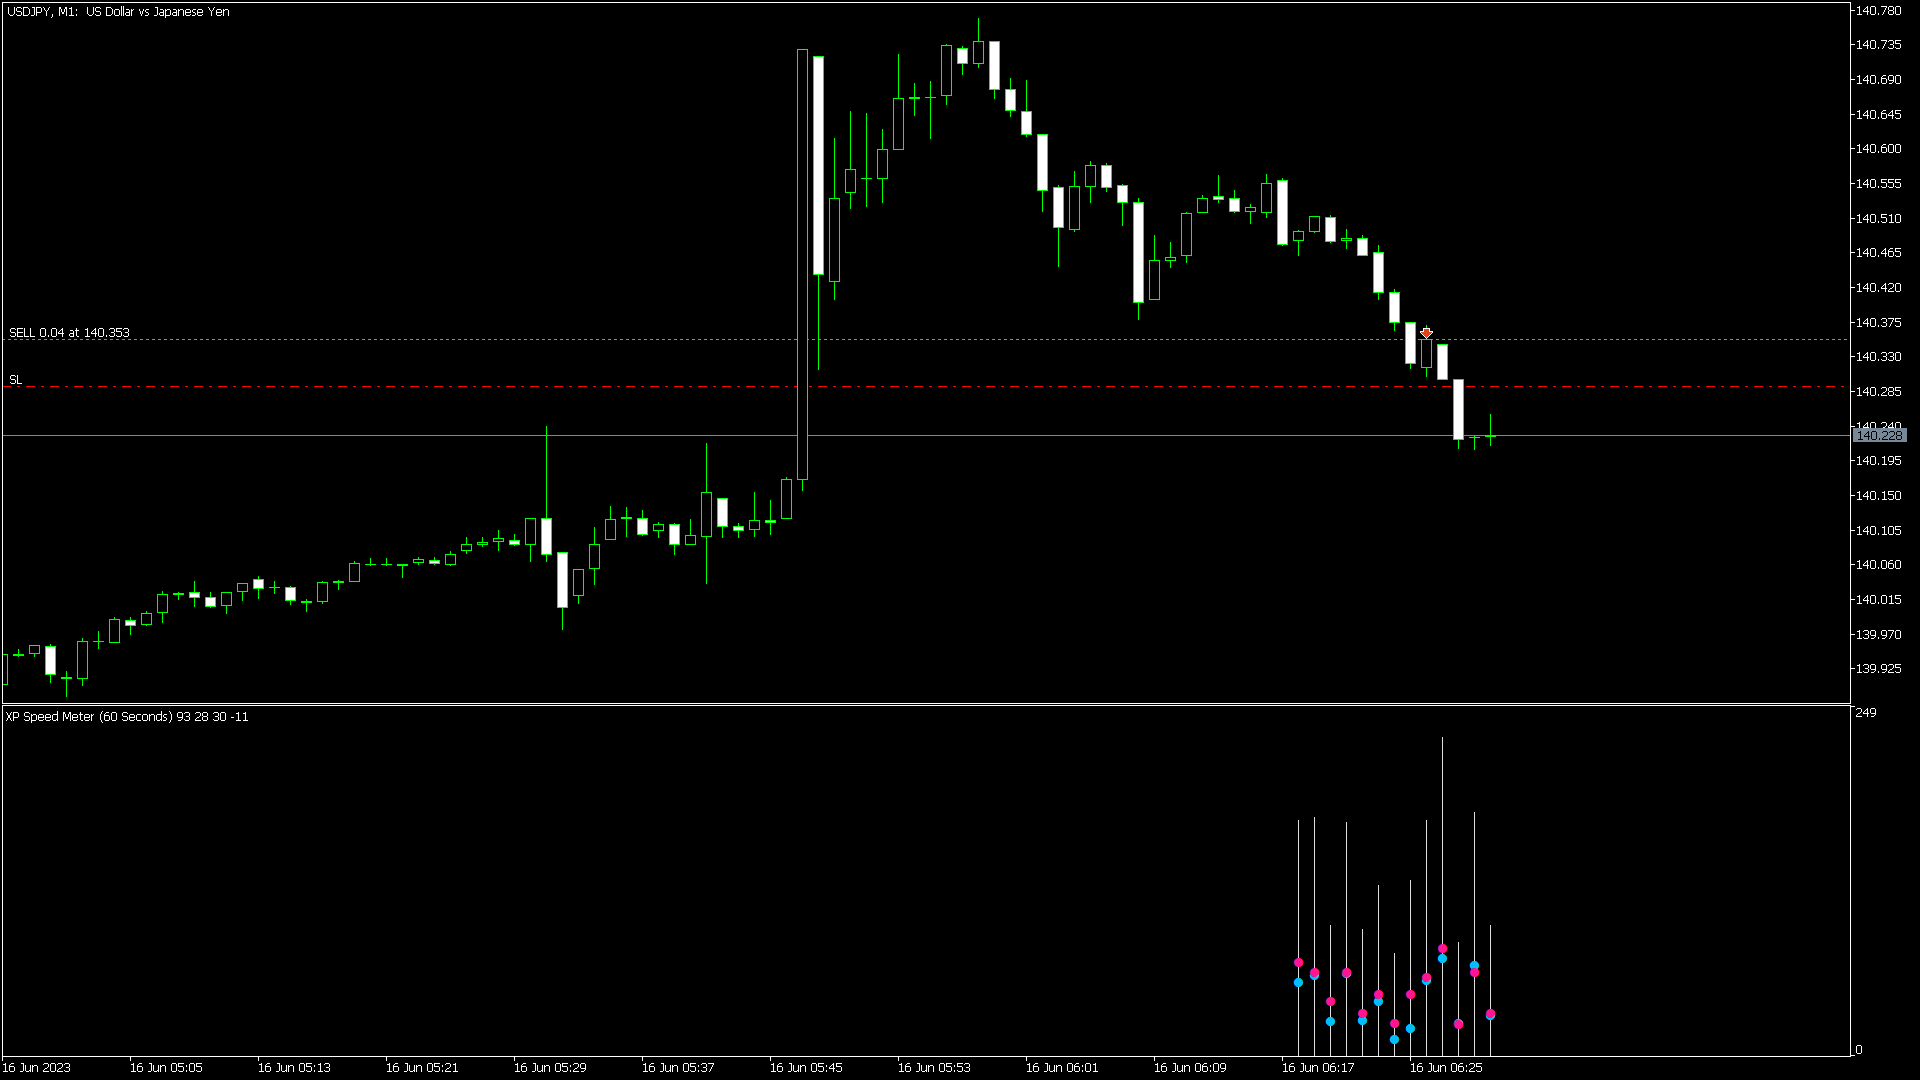
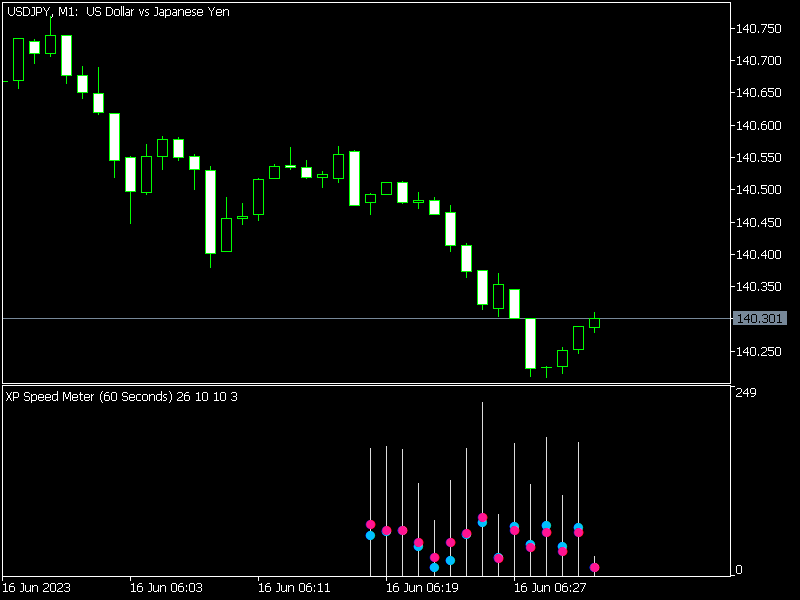
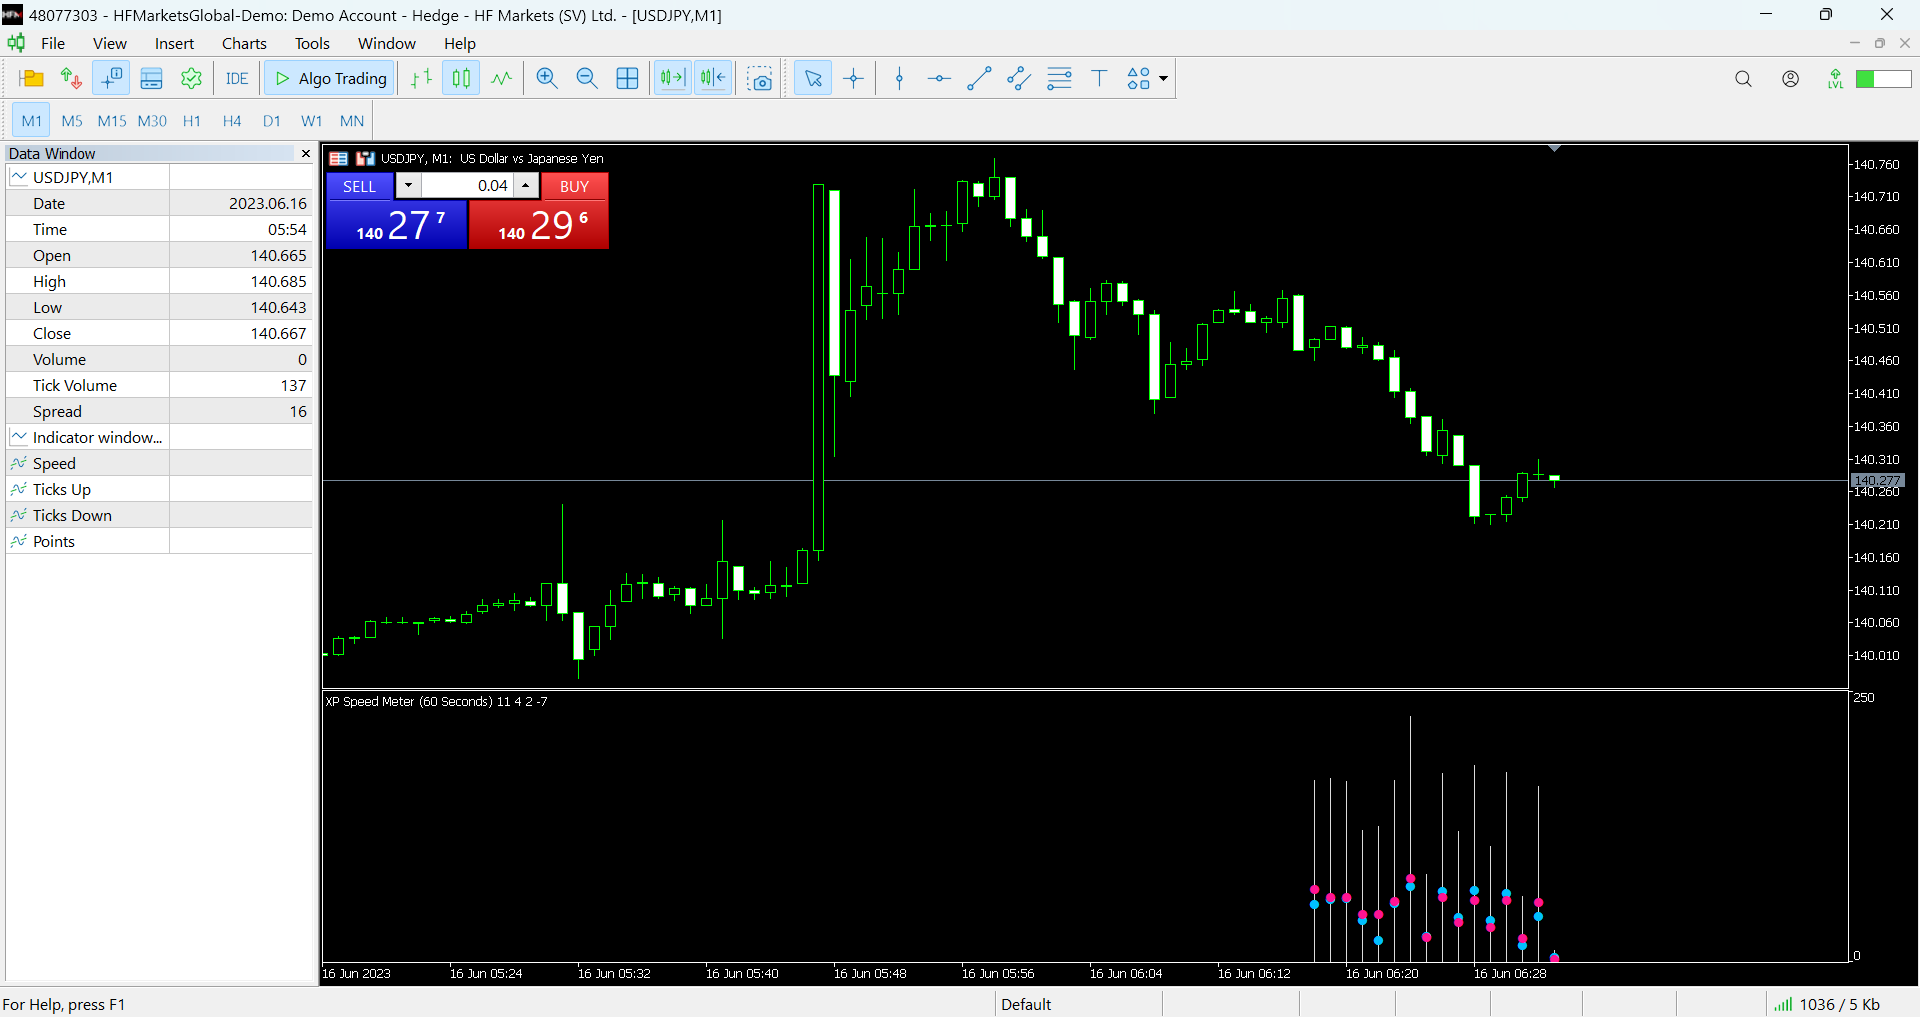
XP Speed Meter the best indicator that measures the price/tick’s currency speed for you.
It will give you the ability to know when the pair moving fast or slow. So, you can trade or not trade. It’s very important tool for scalper traders – news traders. Even for trend traders it will be useful to know if the market is trending fast or slow.
XP Speed Meter is better than the volume type indicators of course. Because it shows the currency speed on the run-time without any lacking like what the volume indicators do.
You can download a demo version (works only with EURUSD) from here:
SETTINGS:
| INPUT | DESCRIPTION |
|---|---|
| Speed Bar Period | Set the period of the speed meter bar. |
| Speed Bar Unit | Choose the bar unit. It can be Seconds - Minutes - Hours. |
| Wait New Chart Bar? (Y/N) | Do you want the indicator to wait the new bar of the chart to start or it starts once it attached. |
| Alert Points (+/-) | After how many points (+/-) you want the alert. |
| Max Bars | Set the max bars to show. |
| Pop-up Alerts? (Y/N) | Turn Pop-up alerts on/off. |
| Mobile Notifications? (Y/N) | Turn mobile notifications on/off. |
| Email Notifications? (Y/N) | Turn email notifications on/off. |