• Información general
  • Comentarios (3)
  • Discusión (16)
  • Novedades

Fast Polynom moving average and channel

5

A useful and convenient tool for traders when analyzing and making decisions.

Peculiarity

The main feature of this indicator is its fast algorithm.
The gain in the speed of calculating the polynomial and its value of the standard deviation in comparison with classical algorithms reaches several thousand times.

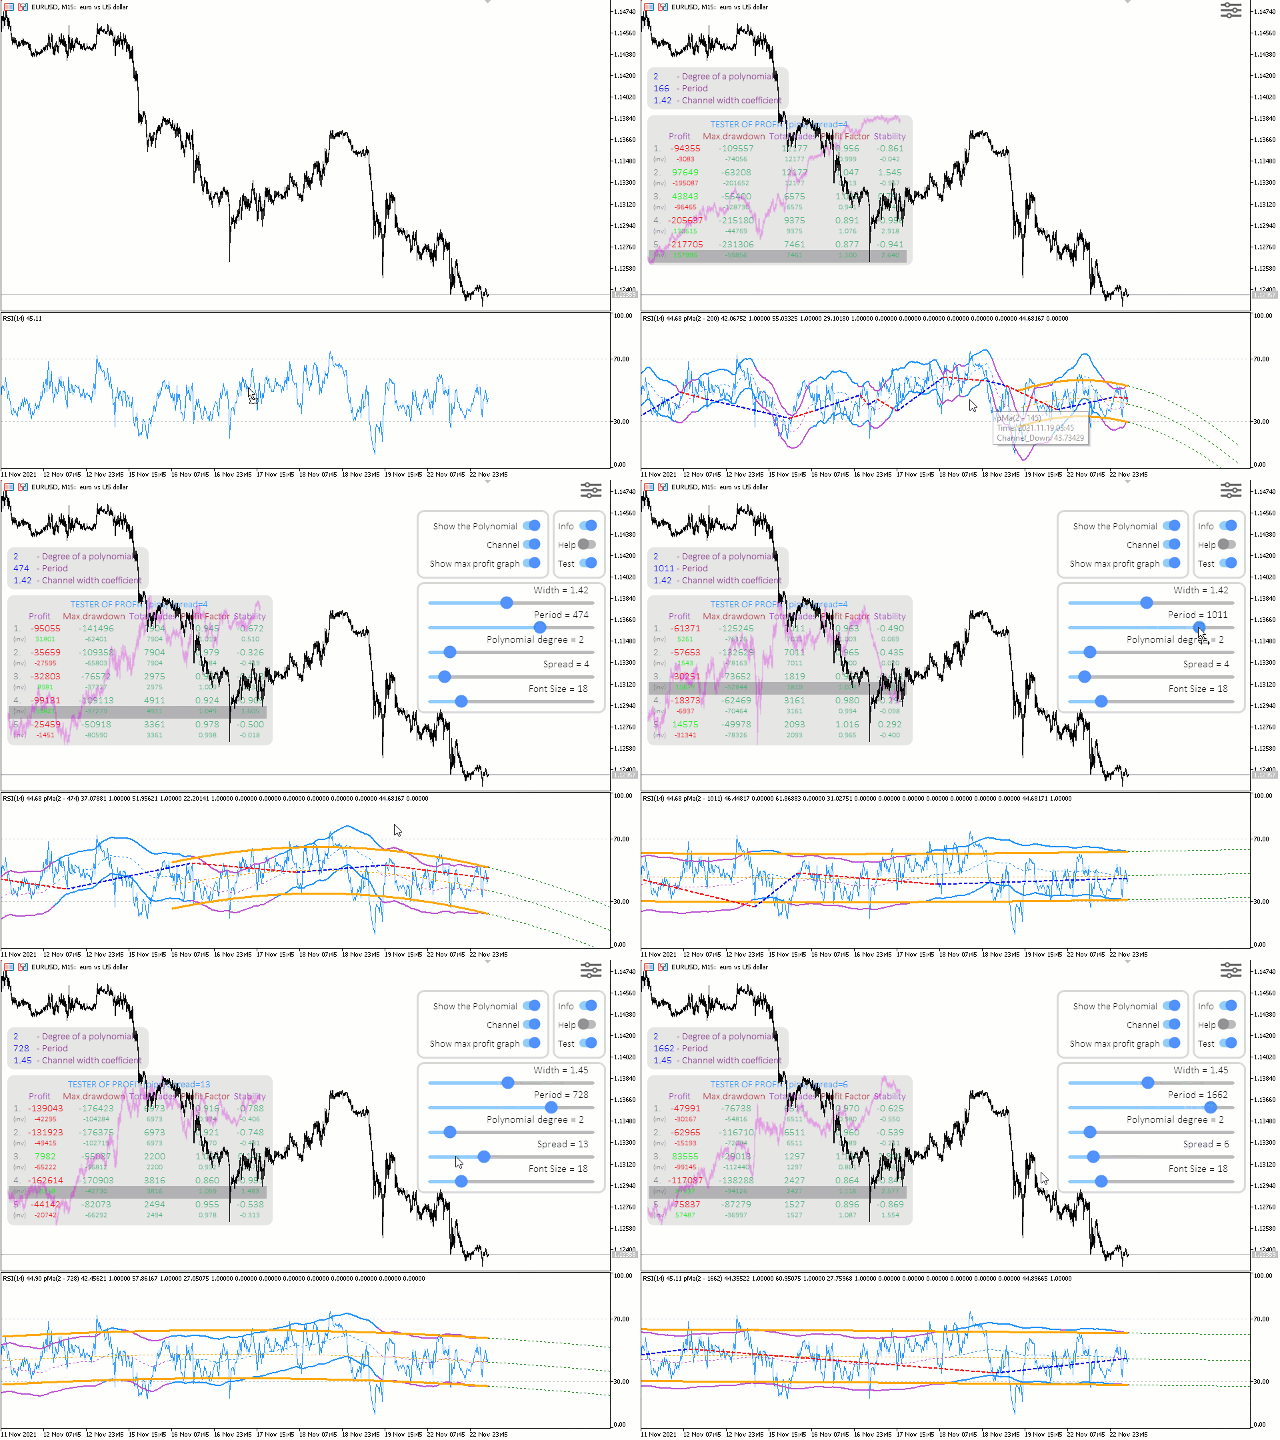
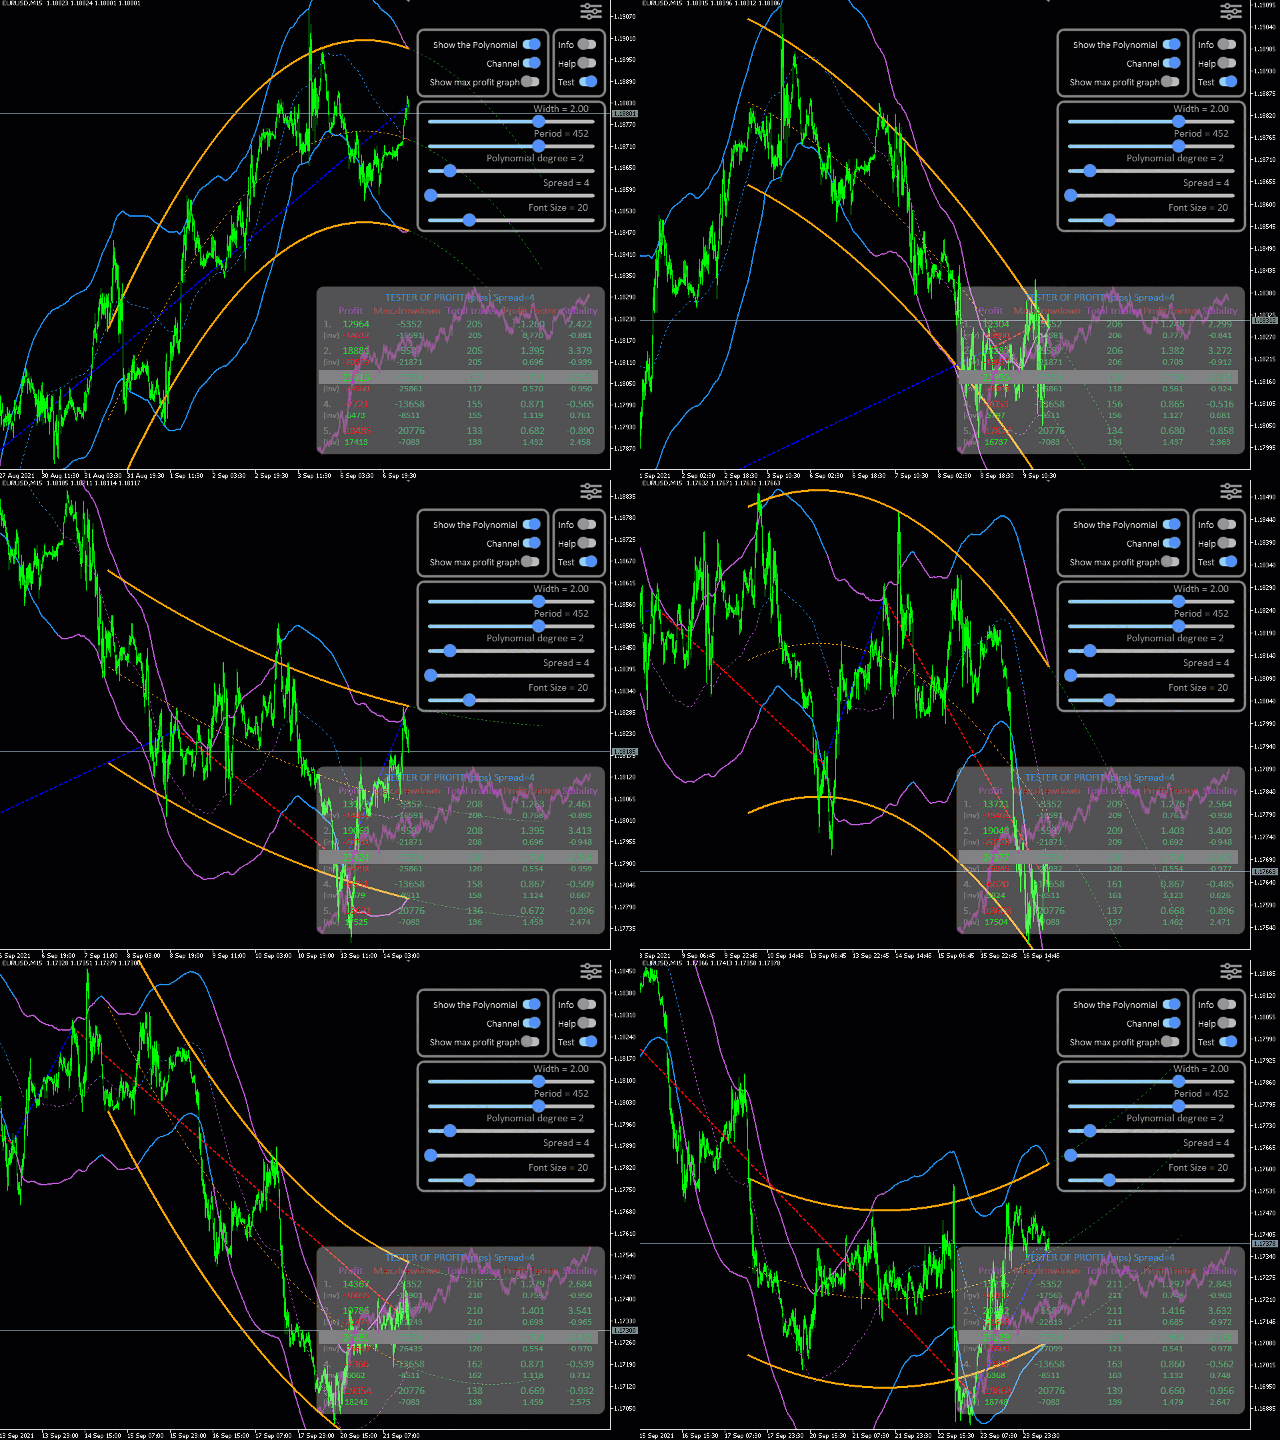
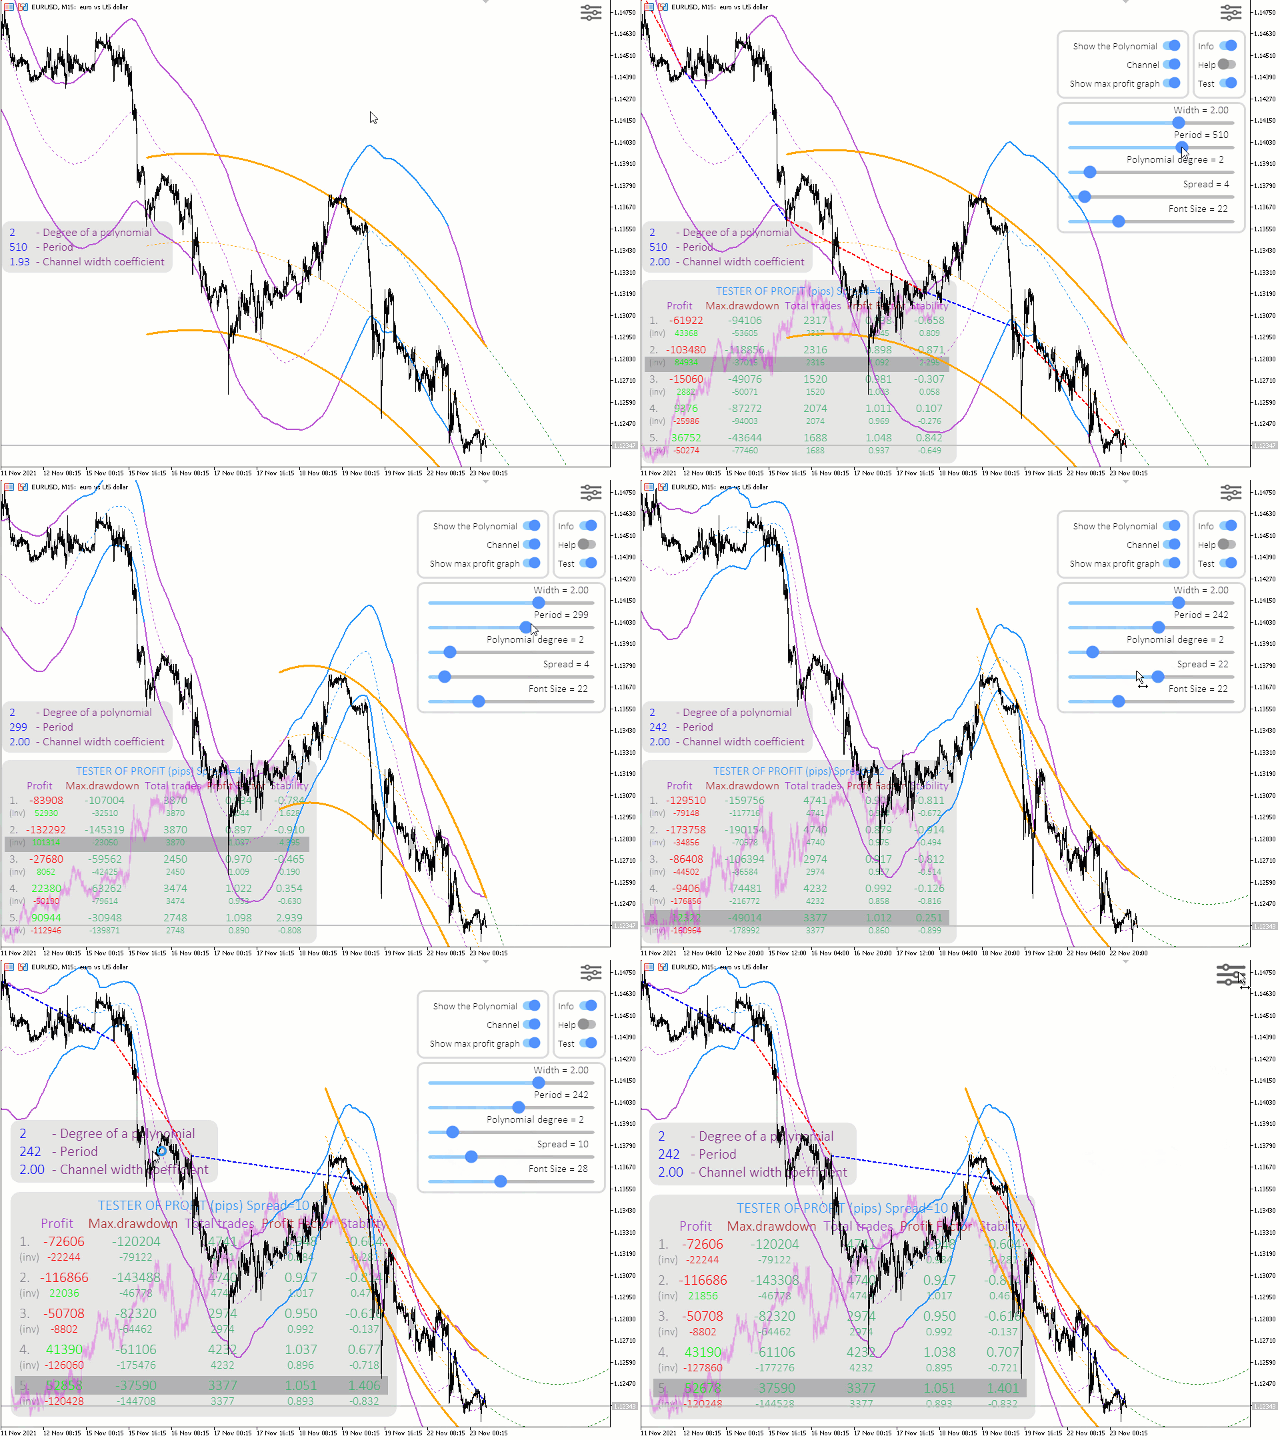
Also, this indicator includes a Strategy Tester with a clear visualization of transactions, an equity chart and simultaneous calculation and display of the following data in the form of a table:

  • profit (in points)
  • maximum drawdown (in points)
  • total number of transactions
  • profit Factor (total profit / total loss)
  • stability (total profit / maximum drawdown)

Built-in tester

20 strategies are given as an example: 5 channel and 5 non-channel, as well as their inverse strategies (when Sell and Buy are swapped).
A brief description of the strategies can be seen by hovering the mouse pointer over the line in the tables of the corresponding strategy.

    You can further expand the capabilities of this Tester by applying this indicator to another indicator, for example, RSI.

    It is especially worth noting the possibility of changing the parameters in two ways:
    1. using the keyboard and mouse (control keys can be viewed by selecting "Help" in the menu)
    2. using sliders and switches in the control menu
    Language support has been implemented (so far 8 languages). The language is set automatically according to the selected language in the terminal, but you can also change the language with the "L" (Language) key.
    Text fields can be dragged with the mouse.


    Indicator lines

    • Yellow lines - Polynomial channel is redrawn with each tick. The green dashed lines are the extrapolation of the Polynomial to the future.
    • Two-colour lines - non-redrawable channel, which is a trace from the Yellow Polynomial, Blue - when the lines of the Polynomial are directed up, Violet- when down.
    • Red line - Sell, Blue line - Buy. Displayed when the Tester is on.


    Parameters

    • Degree of a polynomial - degree of the polynomial, from 0 to 20
      • 0 - regular MA (Bollinger Bands channel)
      • 1 - linear regression
      • 2 - nonlinear regression without inflection points (parabola)
      • 3 - nonlinear regression with one inflection point (wave)
      • etcetera
    • Number of bars for the calculation (period) - number of bars for calculation (period).
    • Width of the channel, 0-no channel, 1-width = standard deviation - Channel width:
      • 0 - do not draw the channel
      • 1 - the width is equal to the standard deviation of the polynomial
    • Bars to extrapolate in the future - how many bars to extrapolate into the future
    • Show Polynom? - if true, then show the Polynomial line (yellow line)
    • Spread for Tester - the size of the spread for the Tester
    • Notify channel trend change - enable notifications (push notifications to the phone and a pop-up window) in case of a change in the trend of the Polynomial channel (orange color). This is equivalent to changing the color of a two-color line.
    • Allow all notifications for tester mode - Enable/disable permission to use all downstream notifications
    • Send Alert Notification - Enable text notification of a buy and sell signal according to the selected strategy from the strategy tester
    • Send Sound Notification - Enable Sound notification of a new buy and sell signal according to the selected strategy from the strategy tester
    • Send Push-Notification to Mobile - Send PUSH notifications to your phone (requires setting in your terminal Tools -> Options-> Notifications -> MetaQuotes ID) about buy and sell signals according to the selected strategy from the strategy tester

    Notifications

    You can configure notifications to be sent: text notification in a separate window, sound notification and push notifications to the phone. 
    These notifications are sent in case of a new buy or sell signal in accordance with the selected strategy in the tester. If the tester is disabled, then notifications will not be generated.
    Signals are sent when the red and blue dotted lines change color.

        Recommendations

        The degree of the Polynomial is limited to 20. But this is very redundant.
        In my opinion, it is quite enough to use this indicator with a Polynomial degree less than 10.
        My recommendation for trading is to use the 2nd degree of the polynomial (parabolic channel), but for cryptocurrencies, the 3rd degree of the polynomial, in my opinion, is better due to the strong volatility.

        Comentarios 3
        elite luis
        3331
        elite luis 2023.03.09 06:36 
         

        Author is a Genius! Super Duper Impressive, deserved more than 5 stars, Best buy of 2023! Hidden Gem! I have bought all 4x product from Author, Polynom MT4+5 and also Native Channel MT4+5, very unique and innovative first time I seen in MQL and is the one and only product different from the crowd, well worth every penny! Simply Amazing!

        Axl120480
        39
        Axl120480 2016.12.22 02:38 
         

        Один из лучших индикаторов для скальпинга на БО!!!

        Productos recomendados
        ATR Line
        Evgeny Levchenko
        El indicador - "Línea ATR" determina la tendencia actual y da señales para comprar (flecha verde hacia arriba) o vender (flecha roja hacia abajo). El cálculo del indicador se basa en la desviación del precio promedio del instrumento de su rango real promedio: ATR. La media móvil de precios se utiliza para reducir el "ruido del mercado". Si la línea principal del indicador - "Línea ATR" es más baja en el gráfico de precios del instrumento, entonces el mercado está en una tendencia "alcista". Si l
        Market Overview MT5
        Mehran Sepah Mansoor
        Optimice sus decisiones de trading con nuestro indicador de fuerza y sentimiento del mercado y deje de operar contra tendencia! Diseñado meticulosamente para los operadores serios que valoran la información precisa y oportuna, nuestro indicador proporciona una vista de pájaro de los 28 pares principales de una manera muy sencilla. Esta herramienta es capaz de clasificar los pares de divisas basándose en términos de popularidad, fuerza de tendencia alcista o bajista y porcentaje de compradores y
        An customize Indicator by which you can have Triple moving averages at close prices and send push notification on each crossing.  This indicator is especially useful when you are doing manual trading. Notes: Cation: forex trading is a very risky business,...              don't invest the money you cannot bear to lose.             the probability of losing is high ... more high aaaand exponentially high.... something like EMA enjoy losing with us...
        AW Prime Oscillator MT5
        AW Trading Software Limited
        Una combinación de dos osciladores. El primero muestra los puntos de entrada, el segundo muestra la tendencia actual. El indicador puede mostrar señales de oscilador mediante flechas en dos modos, todas señales de oscilador rápido o señales solo en la dirección de la tendencia actual. Tiene un panel de múltiples períodos de tiempo y tres tipos de notificaciones de señales. Beneficios: Adecuado para operaciones intradía y especulación. Filtrado de tendencias Configuración sencilla y sensible Pane
        Trend Piramide
        Ignacio Agustin Mene Franco
        Trend Piramide ! es un indicador que cumple con la estrategia de caza de tendencias !  donde clara mente da la señal de entrada cuando muestra el punto de color celeste cazando la tendencia con la linea azul , para la compra (BUY) donde para la venta (SELL) muestra el punto rojo con la linea de tendencia Yellow  se puede usar para cualquier temporalidad ,  siempre y cuando quieras cazar una tendencia corta o una tendencia larga .  Disponible para todos los pares de Forex y Indices Sinteticos ! W
        ATR Profesional
        Ignacio Agustin Mene Franco
        ATR Profesional .  es un indicador similar a las bollinger ,  pero este atr esta mas avanzado para hacer scalp y largos en h4 o h1 ,  cuenta con sus bandas , la estrategia es que te marca entrada cuando la vela sale de la banda ,  o hace algun rebote en el techo superior o piso inferior ,  sirve para todas las temporalidades !  sirve para los mercados de forex y indices sinteticos  tambien crypto ! Buen profit ! World Inversor .
        Beauty Trend
        Nikolay Kositsin
        Простой индикатор тренда в NRTR виде с отрисовкой линий стоплосса и тейпрофита, цвет и направление движения которых определяются действующим трендом. Индикатор имеет возможность подавать алерты, отправлять почтовые сообщения и push-сигналы при смене направления тренда. Следует учесть что значение входного параметра индикатора Deviation of the take profit line in points для каждого финансового актива на каждом таймфрейме   необходимо подбирать индивидуально!
        The volatility scanner indicator is a tool that helps traders identify and analyze  volatility in all the market timeframes for the current chart. This way you can find potentially profitable trades on every timeframe for the current symbol. What It Does? Scan all timeframes to find a volatility contraction. Color the button yellow if there is a volatility squeeze at that timeframe. Clicking on the button instantly changes timeframe. How To Use It? Just put it on the chart and click on the y
        FREE
        Top indicator   for MT5   providing accurate signals to enter Trades. This Indicator will provide pretty accurate trading signals and tell you when it's best to open a trade by giving alerts to buy or sell. Mainly was created to target Volatility Index on Deriv broker however, the Spot Detector Arrow Indicator can be applied to any financial assets(Forex, Crypto, Indices, Volatilities) on MT5 Brokers.  HOW TO BUY Wait for signal Alert to Buy will be sent to your MT5 Terminal Blue arrow facin
        The "Deviation Scaled Moving Average Crosses" indicator is a powerful technical analysis tool designed for the MetaTrader 5 trading platform. It facilitates informed trading decisions by visually presenting the interaction between two moving averages, both of which are smoothed and scaled to offer enhanced insights into market trends. This custom indicator is developed by mladen and is copyright-protected for the year 2023. Using a unique approach, the indicator displays two types of deviatio
        Trend Strength MA indicator Trend Strength MA is a part of a series of indicators used to characterize market conditions. Almost any strategy only works under certain market conditions. Therefore, it is important to be able to characterize market conditions at any time: trend direction, trend strength, volatility, etc. Trend Strength MA is an indicator to be used to characterize trend strength: Up extremely strong Up very strong Up strong No trend Down strong Down very strong Down extrem
        Make no mistake, this is not just another indicator; it's much more than that! Welcome to a groundbreaking approach! Sunrise Divergence is not just another tool; it represents a deep understanding in how market dynamics are analyzed and traded. This indicator is crafted for traders who seek to navigate the markets with precision, leveraging the powerful concept of asset correlation, both positive and negative, to unveil trading opportunities that many overlook. In the markets, understanding the
        Super Zone   For several years of observing the principles of the market, Super Zone worked, both then and now, because the indicator  allows you to see the trading range of the  week and even the month that major market participants use. It’s very easy to use, we work on H4 in the weekly range (  in the tester it doesn’t work in the demo mode  ) - we sell from the upper zones, we buy from the lower ones. It marks the zones from the beginning of the week (month) that are  not redrawn  , works on
        Binary MA Cross   MA Cross indicator by 4Umbella Create for traders both experienced and inexperienced to use it because it is a basic indicator How to use : 1. MA Fast  : Moving Average fast (Period 4 upto 50) 2. MA Middle :  Moving Average Middle (Period 10 upto 100) 3. MA Slow :  Moving Average Slow (Period 50 upto 200) to control trend markets. and trader can be set for Apply to price (Close, Open,Low,High,Median,Typical,weightd) For alert you can set to alert Next bar or instant bar
        TrendDetect
        Pavel Gotkevitch
        The Trend Detect indicator combines the features of both trend indicators and oscillators. This indicator is a convenient tool for detecting short-term market cycles and identifying overbought and oversold levels. A long position can be opened when the indicator starts leaving the oversold area and breaks the zero level from below. A short position can be opened when the indicator starts leaving the overbought area and breaks the zero level from above. An opposite signal of the indicator can
        Trend Chief mt5
        Vladimir Stepanov
        5 (1)
        Trend Chief es un algoritmo de indicador avanzado que filtra el ruido del mercado, determina la tendencia, los puntos de entrada y los posibles niveles de salida. Use marcos de tiempo más cortos para el scalping y marcos de tiempo más altos para el swing trading. Trend Chief es perfecto para todos los símbolos de Metatrader: divisas, metales, criptomonedas, acciones e índices * Cómo usar el indicador Trend Chief: - Obtenga la tendencia principal mirando los gráficos diarios y H4 - Si la tendenci
        The indicator is a bundle of EIGHT different fundamental functions required for a trader: 1] Forex Session where you can determine your own timings/highlights. 2] High low marking from 1H to 1M 3] Sweetspot 4] Spread and Candle Stick Timer 5] Background logo for branding- You can place the images at any zone of the chart you want 6] Profit and Loss 7] Days names (SUN MON TUE…) on the chart 8] High/low break notification
        Multi Trend
        Ignacio Agustin Mene Franco
        Multi trend es un indicador que va marcando los low y high para poder hacer un buen scalping sea ala alza o ala baja recomendable usar en h1, m30, m15 , m5 y m1 , funciona muy bien para los indices sinteticos y forex en los pares eur/usd , usd/jpy , aud/cad , etc y en sinteticos en los pares Boom 300, crash 300 , crash 500 y boom 500 , volatility 75 , jump 100 , jump 75 , volatility 10 etc !
        Fibrillar
        Vitalii Zakharuk
        It is very easy to use the Fibrillar indicator, since the simplest is to look at the chart and act according to the indications of the colored arrows. The algorithm takes into account the measurement of prices, and this method also focuses on measuring each of the price drops (H / C, H / O, LC, LO) - which gives more detailed information, but also more averaged. When calculating this indicator, logarithmic gains are first calculated at the closing price, which allows you to filter out the tre
        MultiTF MA
        Vitor Salvador
        Multi-Timeframe Moving Average Indicator Provides you a simple edge. How? Let me explain.. Have you ever tried using Moving Average Strategy to trade but you find those entries too late? Have you ever tried to trade with moving averages on 1 Timeframe chart (example 4h) and when i try to lower the timeframe, moving averages change position? If you answered Yes to Both questions , This indicator is the solution for you! 1- You can visualize lower timeframes moving averages on higher timeframes ex
        A lot of professional traders use high quality divergence signals as a part of their strategy to enter a position. Spotting correct divergences quickly can often be hard, especially if your eye isn’t trained for it yet. For this reason we’ve created a series of easy to use professional oscillator divergence indicators that are very customisable so you get only the signals you want to trade. We have this divergence indicator for RSI, MACD, Stochastics, CCI and OBV. RSI:   https://www.mql5.com/en/
        FFx Universal MTF Alerter MT5
        Eric Venturi-Bloxs
        4.67 (3)
        The FFx Universal MTF alerter shows on a single chart all the timeframes (M1 to Monthly) with their own status for the chosen indicator. 9 indicators mode (MACD-RSI-Stochastic-MA-ADX-Ichimoku-Candles-CCI-PSAR). Each can be applied multiple times on the same chart with different settings. Very easy to interpret. Confirm your BUY entries when most of the timeframes are showing green color. And confirm your SELL entries when most of the timeframes are showing red color. 2 Alert Options : input to
        This indicator has a unique support and resistance calculation program, which is a unique trading system. Index characteristics Imagine if you can accurately determine the important trading support and resistance areas and points in advance, how will your trading improve? Based on a unique calculation method, the indicator analyzes the trend, analyzes the current support and resistance, and obtains the current important support resistance and single direction, the calculated stop profit and st
        Indicador para determinar plano y tendencia. Si el precio está por debajo de cualquiera de los dos histogramas y dos líneas (rojo y azul), esta es una zona de venta. Al comprar esta versión del indicador, la versión MT4 para una cuenta real y una demo, ¡como regalo (para recibir, escríbame un mensaje privado)! Si el precio está por encima de cualquiera de los dos histogramas y dos líneas (rojo y azul), esta es una zona de compra. Versión MT4: https://www.mql5.com/en/market/product/3793 Si
        Hush mt5
        Iurii Plokhov
        4.33 (3)
        Hush mt5 is an advanced indicator that gives a signal about the overbought or oversold market in a certain period of time Hush mt5 the advantage of this indicator is that it does not disappear after the signal on the chart Suitable for any trade: forex, stocks, cryptocurrency, metals Hush mt5 can be used on any time period. The signal goes to the beginning of the next candle after the arrow Hush mt5 performed best on the period H1,H4,daily It can be used in addition to forex, in binar
        [ Versión MT4 ] Order Block Indicator MT5 Order Block Indicator MT5 es actualmente el indicador más preciso y personalizable del mercado. Ha sido desarrollado para facilitar el análisis de operativas basadas en Bloques de Órdenes y Zonas de Oferta y Demanda. Estas zonas son posibles puntos de reversión de un movimiento. Order Block Indicator MT5 resalta los bloques de órdenes activos de hasta 4TFs simultáneamente. A su vez, Order Block Indicator MT5 provee de un sistema de alerta visual que p
        Skiey
        Vitalii Zakharuk
        Skiey - Indicator of easy solutions! Using this indicator is very simple, since the simplest is to look at the chart and act according to the color arrows. Such a calculation option takes into account intraday price fluctuations and focuses on measuring the "candlestick" share in the trend. The algorithm takes into account the measurement of prices, this method also emphasizes the measurement of each of the price drops (H / C, H / O, LC, LO) - which gives more detailed information but also mo
        40% off. Original price: $50 (Ends in May 15th) Moving Average Trend Scanner is a multi symbol multi timeframe triple MA crossover dashboard that helps traders to monitor, and identify potential market trends from one chart. This panel scans 3 moving averages in up to 28 configurable instruments and 9 timeframes for triple moving average alignment and moving average crossover with a deep scan feature to scan all market watch symbols (up to 1000 instruments!).   Download Demo   here   (Scans o
        Gioteen Volatility Index (GVI) - your ultimate solution to overcoming market unpredictability and maximizing trading opportunities. This revolutionary indicator helps you in lowering your losing trades due to choppy market movements. The GVI is designed to measure market volatility, providing you with valuable insights to identify the most favorable trading prospects. Its intuitive interface consists of a dynamic red line representing the volatility index, accompanied by blue line that indicate
        Owl Smart Levels MT5
        Sergey Ermolov
        4.49 (37)
        Versión MT4  |  FAQ El Indicador Owl Smart Levels es un sistema comercial completo dentro de un indicador que incluye herramientas de análisis de mercado tan populares como los fractales avanzados de Bill Williams , Valable ZigZag que construye la estructura de onda correcta del mercado y los niveles de Fibonacci que marcan los niveles exactos de entrada. en el mercado y lugares para tomar ganancias. Descripción detallada de la estrategia Instrucciones para trabajar con el indicador Asesor de c
        Los compradores de este producto también adquieren
        Primero que todo, vale la pena enfatizar que este Sistema de Trading es un Indicador No Repintado, No Redibujado y No Retrasado, lo que lo hace ideal tanto para el trading manual como para el automatizado. El "Sistema de Trading Inteligente MT5" es una solución completa de trading diseñada para traders nuevos y experimentados. Combina más de 10 indicadores premium y presenta más de 7 estrategias de trading robustas, lo que lo convierte en una opción versátil para diversas condiciones del merca
        Atomic Analyst MT5
        Issam Kassas
        5 (11)
        En primer lugar, vale la pena enfatizar que este Indicador de Trading no repinta, no redibuja y no se retrasa, lo que lo hace ideal tanto para el trading manual como para el automatizado. El Analista Atómico es un Indicador de Acción del Precio PA que utiliza la fuerza y el impulso del precio para encontrar una mejor ventaja en el mercado. Equipado con filtros avanzados que ayudan a eliminar ruidos y señales falsas, y aumentan el potencial de trading. Utilizando múltiples capas de indicadores
        Quantum Trend Sniper
        Bogdan Ion Puscasu
        5 (37)
        Introduciendo       Indicador Quantum Trend Sniper   , el innovador indicador MQL5 que está transformando la forma en que identificas y negocias los cambios de tendencia. Desarrollado por un equipo de comerciantes experimentados con experiencia comercial de más de 13 años,       Indicador de francotirador de tendencia cuántica       está diseñado para impulsar su viaje comercial a nuevas alturas con su forma innovadora de identificar cambios de tendencia con una precisión extremadamente alta.
        FX Volume MT5
        Daniel Stein
        4.94 (17)
        Obtenga su actualización diaria del mercado con detalles y capturas de pantalla a través de nuestro Morning Briefing aquí en mql5 y en Telegram ! FX Volume es el PRIMER y ÚNICO indicador de volumen que proporciona una visión REAL del sentimiento del mercado desde el punto de vista de un bróker. Proporciona una visión impresionante de cómo los participantes institucionales del mercado, como los brokers, están posicionados en el mercado Forex, mucho más rápido que los informes COT. Ver esta info
        Trend Screener Pro MT5
        STE S.S.COMPANY
        4.89 (61)
        Desbloquee el poder del comercio de tendencias con el indicador Trend Screener: ¡su solución definitiva para el comercio de tendencias impulsada por lógica difusa y un sistema multidivisa!Mejore su comercio de tendencias con Trend Screener, el revolucionario indicador de tendencias impulsado por lógica difusa. Es un poderoso indicador de seguimiento de tendencias que combina más de 13 herramientas y funciones premium y 3 estrategias comerciales, lo que lo convierte en una opción versátil para co
        Este es un genial indicador para MT5 que ofrece señales precisas para entrar en una transacción sin redibujar. Se puede aplicar a cualquier activo financiero: fórex, criptomonedas, metales, acciones, índices. Nos dará valoraciones bastante precisas y nos dirá cuándo es mejor abrir y cerra una transacción. Eche un vistazo  al vídeo  (6:22), ¡contiene un ejemplo de procesamiento de una sola señal que ha amortizado el indicador! La mayoría de los tráders mejoran sus resultados comerciales durante l
        FX Power MT5 NG
        Daniel Stein
        5 (4)
        Obtenga su actualización diaria del mercado con detalles y capturas de pantalla a través de nuestro Morning Briefing aquí en mql5 y en Telegram ! FX Power MT5 NG es la nueva generación de nuestro popular medidor de fuerza de divisas, FX Power. ¿Y qué ofrece este medidor de fuerza de nueva generación? Todo lo que le encantaba del FX Power original PLUS Análisis de fuerza de ORO/XAU Resultados de cálculo aún más precisos Períodos de análisis configurables individualmente Límite de cálculo persona
        RelicusRoad Pro MT5
        Relicus LLC
        4.82 (22)
        Ahora $ 147 (aumentando a $ 499 después de algunas actualizaciones) - Cuentas ilimitadas (PC o Mac) Manual de usuario de RelicusRoad + Videos de capacitación + Acceso al grupo privado de Discord + Estado VIP UNA NUEVA MANERA DE VER EL MERCADO RelicusRoad es el indicador comercial más poderoso del mundo para divisas, futuros, criptomonedas, acciones e índices, y brinda a los comerciantes toda la información y las herramientas que necesitan para mantenerse rentables. Brindamos análisis téc
        Advanced Supply Demand MT5
        Bernhard Schweigert
        4.53 (15)
        ¡Actualmente con 33% de descuento! ¡La mejor solución para cualquier tráder principiante o experto! Este indicador es una herramienta comercial única, de alta calidad y asequible, porque incorpora una serie de características patentadas y una nueva fórmula. Con esta actualización, podrá mostrar zonas de doble marco temporal. No solo podrá mostrar un marco temporal más alto, sino también mostrar ambos, el marco temporal del gráfico MÁS el marco temporal más alto: MOSTRANDO ZONAS ANIDADAS. A todos
        TPSpro TRENDPRO  - is a trend indicator that automatically analyzes the market and provides information about the trend and each of its changes, as well as giving signals for entering trades without redrawing! The indicator uses each candle, analyzing them separately. referring to different impulses - up or down impulse. Exact entry points into transactions for currencies, crypto, metals, stocks, indices!  -  Version MT4                  DETAILED DESCRIPTION        /       TRADING SETUPS       
        A key element in trading is zones or levels from which decisions to buy or sell a trading instrument are made. Despite attempts by major players to conceal their presence in the market, they inevitably leave traces. Our task was to learn how to identify these traces and interpret them correctly. Reversal First Impulse levels (RFI)   -  Version MT4                  INSTRUCTIONS                 RUS                 ENG                         R ecommended to use with an indicator   -  TREND PRO  
        Professional Scalping Tool on Deriv Attention! The indicator will be sold in limited quantities!!! The previous 5 copies were sold for $250 The next 5 copies will be sold for $350 The next price is $500 Description: This trading indicator is designed for professional traders focused on scalping. Designed with the market in mind, it provides highly accurate spike trading signals. It works on the M1 timeframe and supports the following symbols: Boom 300 Index, Boom 500 Index, Boom 1000 Index,
        Blahtech Supply Demand MT5
        Blahtech Limited
        4.57 (14)
        Was: $299  Now: $99   Supply Demand uses previous price action to identify potential imbalances between buyers and sellers. The key is to identify the better odds zones, not just the untouched ones. Blahtech Supply Demand indicator delivers functionality previously unavailable on any trading platform. This 4-in-1 indicator not only highlights the higher probability zones using a multi-criteria strength engine, but also combines it with multi-timeframe trend analysis, previously confirmed swings
        Introduciendo       Quantum Breakout PRO   , el innovador indicador MQL5 que está transformando la forma en que comercia con Breakout Zones. Desarrollado por un equipo de comerciantes experimentados con experiencia comercial de más de 13 años,       Desglose cuántico PRO       está diseñado para impulsar su viaje comercial a nuevas alturas con su innovadora y dinámica estrategia de zona de ruptura. El indicador de ruptura cuántica le dará flechas de señal en las zonas de ruptura con 5 zonas
        XQ Indicator MetaTrader 5
        Marzena Maria Szmit
        5 (1)
        Step into the realm of Forex trading with confidence and precision using XQ, a cutting-edge Forex indicator designed to elevate your trading game to unprecedented heights. Whether you're a seasoned trader or just stepping into the world of currency exchange, XQ Forex Indicator empowers you with the insights and signals needed to make informed trading decisions. The signal conditions are a combination of three indicators, and XQ Forex Indicator only display  medium and long-term trends . The ind
        MetaBands M5
        Vahidreza Heidar Gholami
        4.67 (3)
        MetaBands utiliza algoritmos potentes y únicos para dibujar canales y detectar tendencias para que pueda proporcionar a los traders puntos potenciales para entrar y salir de operaciones. Es un indicador de canal junto con un potente indicador de tendencia. Incluye diferentes tipos de canales que se pueden fusionar para crear nuevos canales simplemente utilizando los parámetros de entrada. MetaBands utiliza todos los tipos de alertas para notificar a los usuarios sobre eventos del mercado. Caract
        Antes que nada, vale la pena enfatizar que este Sistema de Trading es un Indicador No Repintado, No Redibujado y sin Retardos, lo que lo hace ideal para el trading profesional. El "Sistema de Trading de Soporte y Resistencia Inteligente" es un indicador avanzado diseñado para traders nuevos y experimentados. Empodera a los traders con precisión y confianza en el mercado de divisas. Este sistema integral combina más de 7 estrategias, 10 indicadores y varios enfoques de trading, incluyendo estr
        Was: $249  Now: $99   Market Profile defines a number of day types that can help the trader to determine market behaviour. A key feature is the Value Area, representing the range of price action where 70% of trading took place. Understanding the Value Area can give traders valuable insight into market direction and establish the higher odds trade. It is an excellent addition to any system you may be using. Inspired by Jim Dalton’s book “Mind Over Markets”, this indicator is designed to suit the
        Malaysian SNR Levels
        Matthias Horst Pieroth
        This indicator can be used to display Support and Resistance levels according to  the  Malaysian SNR concept , in which Support and Resistance are exact levels of a line chart. Malaysian SNR There are 3 different horizontal levels in Malaysian SNR: A-Level : This level is located at the peak of this line chart. (shape looks like the letter A) V-Level : Level at the valley of a line chart, (shape looks like the letter V) Gap-Leve l: This level is located at the Close/Open gap between two cand
        The Volume by Price Indicator for MetaTrader 5 features Volume Profile and Market Profile TPO (Time Price Opportunity). Get valuable insights out of currencies, equities and commodities data. Gain an edge trading financial markets. Volume and TPO histogram bar and line charts. Volume Footprint charts. TPO letter and block marker charts including split structures. Versatile segmentation and compositing methods. Static, dynamic and flexible ranges with relative and/or absolute visualizations. Lay
        Este indicador es una herramienta de transacción única, de alta calidad y asequible porque hemos incorporado una serie de características propias y una fórmula secreta.   Con solo un gráfico, da Alertas para los 28 pares de divisas.   ¡Imagina cómo mejorarás porque puedes identificar el punto de activación exacto de una nueva tendencia u oportunidad de crecimiento! Basado en   nuevos algoritmos subyacentes , hace que sea aún más fácil identificar y confirmar   operaciones potenciales . Esto se d
        TPA True Price Action indicator reveals the true price action of the market makers through 100% non-repainting signals strictly at the close of a candle! TPA shows entries and re-entries, every time the bulls are definitely stronger than the bears and vice versa. Not to confuse with red/green candles. The shift of power gets confirmed at the earliest stage and is ONE exit strategy of several. There are available now two free parts of the TPA User Guide for our customers. The first "The Basics"
        Golden Gate Algo MT5
        James David Lane
        4 (6)
        ¡40% DE DESCUENTO PARA NAVIDAD! ¡AUMENTO DE PRECIO A $250 EL 1 DE ENERO! Presentamos GoldenGate Entries: ¡Una Solución de Trading de Vanguardia! Descubre un enfoque revolucionario para el trading con GoldenGate Entries (GGE), un indicador avanzado diseñado para elevar tu experiencia de trading. GGE proporciona un conjunto completo de características para capacitar a los usuarios con precisión y confianza en sus decisiones comerciales. Pares: Cualquiera (FX - Materias primas - Acciones - A
        If you want to find good trading opportunities, then you must trade near the Trend Line. This allows you to have a tighter         stop loss   on your trades — which improves your       risk to reward . But that’s not all… Because if you combine Trend Line with Support and Resistance, that’s where you find the best trading opportunities. Now you might wonder: “So when do I enter a trade?” Well, you can use reversal     candlestick patterns   (like the   Hammer, Bullish Engulfing, etc.) as your e
        Boom and Crash Spike Detector v1.0 Boom and Crash spike detector prints Down non repaint Arrow for catching crash spikes and Up non repaint arrow for catching boom spikes.  It is suitable for 1M time frame for majorly crash500 and Boom 500.  When the Red arrow prints in a red zone moving averages, it indicates high probability of crash spikes downwards, likewise, blue arrow printing in a blue zone of moving average, it indicates high probability of boom spikes.  Its pretty straight forward since
        Bill Williams Advanced
        Siarhei Vashchylka
        5 (3)
        Bill Williams Advanced is designed for automatic chart analysis using Bill Williams' "Profitunity" system. The indicator analyzes four timeframes at once. Manual (Be sure to read before purchasing) Advantages 1. Automatically analyzes the chart using the "Profitunity" system of Bill Williams. The found signals are placed in a table in the corner of the screen. 2. Equipped with a trend filter based on the Alligator indicator. Most of the system signals are recommended to be used only accordi
        TrendMaestro5
        Stefano Frisetti
        note: this indicator is for METATRADER4, if you want the version for METATRADER5 this is the link:  https://www.mql5.com/it/market/product/108106 TRENDMAESTRO recognizes a new TREND in the bud, he never makes mistakes. The certainty of identifying a new TREND is priceless. DESCRIPTION TRENDMAESTRO identifies a new TREND in the bud, this indicator examines the volatility, volumes and momentum to identify the moment in which there is an explosion of one or more of these data and therefore the mome
        - 50% off - Telegram group : https://t.me/+5RIceImV_OJmNDA0 MT4 version : https://www.mql5.com/en/market/product/84526?source=Unknown%3Ahttps%3A%2F%2Fwww.mql5.com%2Fen%2Fmarket%2Fmy Master Pullback is a complete system that gives unique trading opportunities and a clear indication of the market: trend, signals as well as stop loss and take profit levels. This system has been designed to be as simple as possible and detects extreme overbought and oversold zones, support and resistance levels, a
        Eng Gold
        Ely Alkrar Xshkaky
        ENG-GOLD Scalper It is an auxiliary indicator that identifies potential targets and determines the place of entry with a stop loss that works on Heiken Ashi candles  The green lines are usually the targets, the red lines are the stop loss, and the yellow lines are the entry location.  This file is recognized on small and medium frames, usually less than the watch frame I highly recommend using XAUUSD US100 US30 USOIL 
        Gartley Hunter Multi
        Siarhei Vashchylka
        5 (5)
        Gartley Hunter Multi - An indicator for searching for harmonic patterns simultaneously on dozens of trading instruments and on all classic timeframes: (m1, m5, m15, m30, H1, H4, D1, Wk, Mn). Manual (Be sure to read before purchasing) | Version for MT4 Advantages 1. Patterns: Gartley, Butterfly, Shark, Crab. Bat, Alternate Bat, Deep Crab, Cypher 2. Simultaneous search for patterns on dozens of trading instruments and on all classic timeframes 3. Search for patterns of all possible sizes. Fr
        Otros productos de este autor
        Native Channels
        BeeXXI Corporation
        5 (2)
        This indicator recognizes all support and resistance levels. A number of unique high-performance techniques have been applied, which made the existence of this indicator possible. All formed channels are naturally visible: horizontal linear linear parabolic cubic (Polynomial 3 degrees - Wave) This is due to a bundle of approximating channels. The formed channels form "standing waves" in a hierarchical sequence. Thus, all support and resistance levels are visible. All parameter management is
        Polynom Moving and Channel
        BeeXXI Corporation
        5 (2)
        The use of a polynomial expansion of data opens up new possibilities for analysis and decision making. But the problem of all existing algorithms is a very slow computation. The main feature of this indicator is its fast algorithm. The speed of calculation of the polynomial algorithm and its standard deviation values ​​is several thousand times faster than conventional algorithms. So this is a convenient algorithm for use without the need to apply supercomputers. Also, starting from version 1.4
        Drawing Parabolic Channels
        BeeXXI Corporation
        5 (6)
        Convenient drawing of parabolic channels by four points (two lower and two upper extremums). Additional control keys: N (New) - Start drawing a new channel. C (Clear) - Deletes the current channel. By default, the current channel is the last channel. But you can click on the line of any channel to make it current. Click on the gear in the upper right corner to set some parameters for all channels or the current channel. All work is visible from the animated Gif. Do not forget to express your
        FREE
        Convenient drawing of parabolic channels by four points (two lower and two upper extremums). Additional control keys: N (New) - Start drawing a new channel. C (Clear) - Deletes the current channel. By default, the current channel is the last channel. But you can click on the line of any channel to make it current. Click on the gear in the upper right corner to set some parameters for all channels or the current channel. All work is visible from the animated Gif. Do not forget to express your w
        FREE
        This indicator significantly expands the capabilities of the usual ZigZag due to the addition of parabolic channels at the earliest stage of their inception. Download the demo version and test it in the tester. All graphics in the tester are working. But the ZigZag algorithm is special here, because it is implemented on a unique author's ultrafast loop-less algorithm for calculating parabolic regression and calculating its standard deviation. The features of this ZigZag are: Fast calculation, r
        Native Channels MT4
        BeeXXI Corporation
        5 (2)
        This indicator recognizes all support and resistance levels. A number of unique high-performance techniques have been applied, which made the existence of this indicator possible. All formed channels are naturally visible: horizontal linear linear parabolic cubic (Polynomial 3 degrees - Wave) This is due to a bundle of approximating channels. The formed channels form "standing waves" in a hierarchical sequence. Thus, all support and resistance levels are visible. All parameter management is
        ZigZagus Parabolicus
        BeeXXI Corporation
        5 (2)
        This indicator significantly expands the capabilities of the usual ZigZag due to the addition of parabolic channels at the earliest stage of their origin. Download the demo version and test it in the tester. All graphics in the tester are working. But the ZigZag algorithm is special here, because it is implemented on a unique author's ultrafast loop-less algorithm for calculating parabolic regression and calculating its standard deviation. The features of this ZigZag are: Fast calculation, rega
        Gravity Channels
        BeeXXI Corporation
        5 (1)
        This indicator allows the trader to see what is difficult to see and recognize with the eyes. The indicator naturally recognizes and visualizes all processes in the behaviour of a trading instrument, which will be an excellent assistant for a trader who likes to make decisions on his own. This indicator draws a set of approximating channels in all sections of history with different periods. Formed channels form naturally and form their own hierarchy of channels by seniority (length and width
        Filtro:
        elite luis
        3331
        elite luis 2023.03.09 06:36 
         

        Author is a Genius! Super Duper Impressive, deserved more than 5 stars, Best buy of 2023! Hidden Gem! I have bought all 4x product from Author, Polynom MT4+5 and also Native Channel MT4+5, very unique and innovative first time I seen in MQL and is the one and only product different from the crowd, well worth every penny! Simply Amazing!

        StableDollar
        66
        StableDollar 2019.10.05 07:48 
         

        El usuario no ha dejado ningún comentario para su valoración

        Axl120480
        39
        Axl120480 2016.12.22 02:38 
         

        Один из лучших индикаторов для скальпинга на БО!!!

        Respuesta al comentario
        Versión 2.21 2024.04.04
        Added menu positioning:
        input AlignmentX XPos = Left; // Menu horizontal position
        input AlignmentY YPos = Top; // Menu vertical position
        Versión 2.20 2023.03.29
        At the request of the user, the chart is now in the background, not in the front
        Versión 2.19 2023.03.28
        fixed some bugs
        Versión 2.18 2023.03.28
        At the request of users, a notification setting has been added (a pop-up window and a push notification to the phone) when the slope of the polynomial channel changes (yellow line). In other words, when a color change occurs on a two-color line.
        Versión 2.17 2023.03.28
        Added the ability to send notifications (sound, text alerts and push notifications to the phone) at the moment when a buy or sell signal arrives, depending on the chosen strategy in the tester's template.
        Versión 2.16 2023.03.22
        Added an option to set up a sound alert for a buy or sell signal for the current strategy. The signal occurs when a new blue (buy signal) or red (sell signal) dotted line is formed, depending on the selected current strategy in the strategy tester.
        Versión 2.15 2022.01.25
        Fixed some bugs
        Versión 2.14 2021.11.30
        Fixed some bugs
        Versión 2.13 2021.11.24
        Small bug fixed
        Versión 2.12 2021.11.24
        Fixed some bugs.
        Improved colour scheme, as well as work in the regular tester.
        Versión 2.11 2021.11.23
        improved chromaticity when working with a dark theme.
        Versión 2.10 2021.11.23
        Улучшена адаптация для штатного тестера MT5.
        Versión 2.9 2021.11.23
        - Implemented automatic search for the most profitable strategy from the current table with the output of the equity graph.
        To disable this function, turn off the "Show max profit graph" switch.
        - some bugs are fixed.
        - the default is the average spread over the last 10,000 ticks.
        Versión 2.8 2021.11.22
        fixed array overflow bug
        Versión 2.7 2021.11.22
        Fixed overflow error on MN1
        Versión 2.6 2021.11.20
        Small bug fixed.
        Versión 2.5 2021.11.20
        Added:
        - changing the spread for test calculation using the slider
        - changing the font size using the slider
        - Equity charts are displayed for a better understanding of the quality of the strategy.
        Versión 2.4 2021.11.19
        Small bug fixed
        Versión 2.3 2021.11.18
        Continued work on changing the interface and control of the indicator.
        - added sliders for changing parameters.
        Versión 2.2 2021.11.17
        - Fixed some bugs
        - Added "Stability" column in test mode, which equals = profit / maximum drawdown
        Versión 2.1 2021.11.17
        The indicator interface has been changed:
        - Text fields can now be dragged with the mouse
        - Added information block switches
        Versión 1.13 2020.08.23
        Recompilation for better performance.
        Fixed one bug.
        Versión 1.12 2020.07.17
        Recompilation for better performance.
        Versión 1.11 2020.06.06
        Recompilation for better performance.
        Versión 1.10 2020.03.29
        at the request of the buyer, a shift of graph in the input parameters is added.
        Versión 1.9 2020.03.29
        recompiled for new builds
        Versión 1.8 2020.03.29
        recompiled for new builds
        Versión 1.7 2020.03.29
        recompiled for new builds
        Versión 1.6 2019.09.24
        Introduced automatic language selection in accordance with the current language of the terminal.
        Versión 1.5 2016.06.30
        Fixed saving and passing the indicator parameters when closing the terminal.
        Versión 1.4 2016.06.21
        1. Added language support (English, Russian, Chinese, French, German, Arabic, Spanish and Italian). Change language by pressing L.
        2. Added ability to change the font size. Press F and move your mouse up and down.
        3. P key - show/hide the Polynom
        4. С key - switch Channel/Line
        5. G key - show/hide Grid and (or) Period Separator
        6. Added the powerful visual tool – the Strategy Tester (T key). It allows users to visualize deals, calculate profit, maximum drawdown, and profit factor using 10 simple strategies as examples - 5 channel strategies and 5 strategies involving the polynomial moving averages (switch by С key). Each of the 10 strategies is complemented by the inverse strategy (when Sell and Buy are reversed). You can view a brief description of each strategy as a tooltip when hovering a mouse cursor over the information line. Transactions are displayed. Sell - red dotted line. Buy - blue dotted line.
        7. You can use several instances of the indicator on a single window. In this case, managing visualization and parameters via keyboard and mouse is possible only for the first indicator, while the properties of other indicators can be changed only via the parameter window.
        Versión 1.3 2016.04.11
        1. Added the ability to move the information block using the mouse. Press M to do that
        2. Fixed the conflict between adjusting the indicator using the properties window and using the keys.
        Versión 1.2 2016.04.07
        1. Indicator channel lines have become two-colored (blue - positive polynom slope, purple - negative polynom slope).
        2. Added dynamic configuration of parameters (H - help, I - information, W - change the channel width, Ctrl - change the polynom initial position, Shift - change the polynom calculation period, 0-9 - amount of polynom harmonics).
        3. Changed the polynom extrapolation algorithm.
        Versión 1.1 2015.06.19
        fixed some bugs