Indicadores técnicos para MetaTrader 5 - 52

Trend Line ! indicador de linea tendencial , soporte y resistencia , ideal para cazar largos y cortos ! donde recurre a 2 lineas , la roja y la azul , la roja te marca rebotes para ventas , la azul te marca rebotes para compra y no solo eso si no que tambien te marca , la tendencia alcista y bajista . sirve para cualquier temporalidad , sirve para los mercados de forex y indices sinteticos ! tambien crypto . Buen Profit ! World Inversor .

Volumen estelar . es un oscilador , que indica los rangos altos y los rangos bajos . marcando en el oscilador el techo y piso de cada tendencia , donde la linea violeta cruza la linea gris da entrada de compra , donde la linea violeta cruza hacia abajo la linea roja da señal de venta, muy facil de usar y muy sencillo , sirve para los mercados de forex y indices sinteticos ! y para cualquier temporalidad para operar . Buen Profit ! World Inversor .

Ma Distance Parabolic ! es un indicador moving average con parabolic sar ! ideal para cazar tendencia donde ay dos puntos ideales que muestra entrada son 2 puntos donde son puntos azules que marca el alza y el otro punto verde donde marca la baja el indicador te da la señal de entrada cuando da el segundo punto se toma la posicion . apto para forex y indices sinteticos , tambien crypto ! Buen Profit ! World Inversor .

Zigzag Oscillador . es un indicador programado para cazar cada punto del zigzag de la vela ! como en primer plano de zigzag este oscilador lo lleva a simples medidas , para captar cada rebote del piso al techo ! ideal para hacer scalping y intradiario . sirve para cualquier temporalidad ! para todos los pares de forex ! para todos los pares de indices sinteticos ideal para los volatility 75 y demas jumps ! Buen Profit ! World Inversor .

Oscillador Moving ! es un oscillador donde tiene 3 puntos de entrada donde tiene la linea naranja , la linea roja y la linea azul , donde la linea naranja toca el techo de la linea azul da señal de entrada en compra . donde la linea roja cruza la linea azul da señal de venta ! muy claro de ver y muy simple de usar ! se puede usar en cualquier temporalidad ! se puede usar en los mercados de Forex . En los mercados de indices sinteticos y crypto ! Buen Profit World Inversor .

High Low Expert ! es un indicador donde marca los high y lows en corto y largo plazo funciona como demand and suply y soporte y resistencia tambien ideal para hacer scalp en M1 , tambien funciona para largos en H1 o H4 ! funciona para todas las temporalidades , funciona para los mercados de forex y para los mercados de indices sinteticos ! ideal para los pares de volatilitys y jumps tambien va en crypto ! Buen Profit World Inversor.

Bear Bull ! es un indicador que marca con velas heikin ashi pero modificado , las ventas y compras a largas y cortas tendencia ! con 2 colores verde marca la compra , violeta marca la venta , sirve para cualquier tipo de temporalidad , sirve para los mercados de forex y indices sinteticos ! ideal para cualquier par , tambien sirve para los pares de crypto , Buen Profit ! World Inversor -

Crash Scalper señal ! es un indicador programado %100 para el crash , donde tiene la funcion de scalpear en M1 donde te manda señales de entrada con la flecha azul y señales de salidas con la flecha bordo , tiene como principio scalping de 2 a tendencias largas de velas siempre te va a marcar la flecha de salida , mandandote una mensaje de señal , tambien tiene mensaje para email y mensaje para celular donde te manda las señales ! funciona para todas las temporalidades ! Buen Profit ! Worl

Boom Scalper ! es un indicador programado %100 para el indice Boom , se puede usar en el boom 1000, 500 y 300 funciona para hacer scalping en M1 y largos en cualquier temporalidad siempre mandandote la señal con mensaje de compra y la señal donde se vende , tiene el sistema para mandar email como señal y mensaje como señal por si no estas en tu pc de escritorio para que no te pierdas ninguna señal ! Buen Profit ! World Inversor .
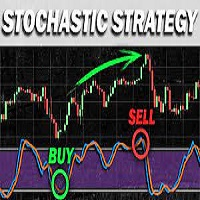
Stochastic cross alert signal overlay is indicator show signal buy and sell you can attach it easy in your chart mt5, it work all time frame it work all time frame Setting: input int KPeriod=5; input int DPeriod=3; input int Slowing=3; input ENUM_MA_METHOD MA_Method=MODE_SMA; Contact me immediately after the purchase to get the settings and a personal bonus!

- Times and Trades, também chamado de Time and Sales ou histórico de negócios, é uma ferramenta essencial para quem opera através do Tape Reading (Fluxo). - O Metatrader 5 não informa os dados das corretoras, sendo assim, impossível diferenciar quem enviou a ordem. - Os dados só podem ser usados por corretoras que informam os dados dos volumes de negociação, como a B3. No mercado forex não é possível usar.

Multi-Timeframe Moving Average Indicator Provides you a simple edge. How? Let me explain.. Have you ever tried using Moving Average Strategy to trade but you find those entries too late? Have you ever tried to trade with moving averages on 1 Timeframe chart (example 4h) and when i try to lower the timeframe, moving averages change position? If you answered Yes to Both questions , This indicator is the solution for you! 1- You can visualize lower timeframes moving averages on higher timeframes ex
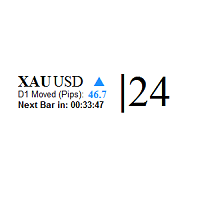
This indicator shows: The market spread Current candle time left to be closed and the pips of market movement from the beginning of the day play sound when candle is going to be closed This is an extremely useful tool for watching the spread rise and fall, allowing you to enter the market at just the right time. This indicator will help you stay out of the market when the spread begins to rise and help you get into the market as the spread begins to fall again.
very useful for day trading and
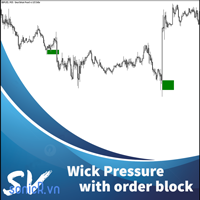
Multiple Wicks forming at OverSold & OverBought levels create Buying and Selling Pressure. This indicator tries to capture the essence of the buy and sell pressure created by those wicks. Wick pressure shows that the trend is Exhausted. Order block should display when buying or selling pressure wick. When price go inside buy order block and up to outside order block, trader should consider a buy order. If price go inside buy order block and down to outside order block, trader should consider a s

Price DNA es un indicador de tendencia que utiliza medias móviles ponderadas por relación compuesta para reducir los desfases y permitir la detección temprana de tendencias. El indicador no se repinta y puede aplicarse a cualquier instrumento financiero en cualquier marco temporal.
¿Cómo funciona el ADN de precio? El indicador mostrará múltiples ondas en el gráfico, que indican la dirección de la operación actual. Cinco ondas verdes o cinco rojas indican una fuerte tendencia alcista o bajista,

FRB Trader - Our mission is to provide the best support to customers through conted and tools so that they can achieve the expected results
FRB Support and Resistance
- Indicator places lines on the chart to show Support and Resistance regions. - You can choose the timeframe you want to calculate, as well as the colors of the lines. - Algorithm calculates the points where the strengths of the asset are considered and are extremely important for decision making.

Este indicador muestra información de precios filtrada en forma de tres histogramas de colores y una línea de color común. Este es un indicador muy colorido y hermoso. Ideal para determinar la fuerza y dirección del movimiento de precios. Este indicador tiene configuraciones muy simples: 1) elección de tres opciones para calcular el indicador: - original, - marcador, - Volumen de equilibrio. 2) selección de cinco períodos diferentes. 3) selección del color visualizado. 4) elección de la precisi
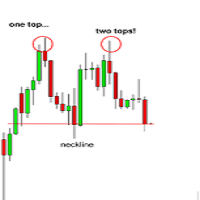
Hello all!
This is indicator 2 top and 2 bottom It will send alert to your phone when price hit top or bottom input uint InpMinHeight = 10; // Minumum Height/Depth input uint InpMaxDist = 20; // Maximum distance between the twin tops/bottoms input uint InpMinBars = 3; // Maximum number of bars after the top/bottom input string Inp_TOP_stringDOWN ="Signal Sell";// TOP: Level UP label input string Inp_BOTTOM_stringUP =

With dynamic Moving average, you can estimate the price movement, predict the next trend of price and have a better decision. Parameters setup: Period start <= Period Stop Period start >= 1
Maximum lines is 100 You can customize Moving average method: Simple averaging, Exponential averaging, Smoothed averaging, Linear-weighted averaging and price to apply: PRICE_CLOSE: Close price
PRICE_OPEN: Open price
PRICE_HIGH: The maximum price for the period
PRICE_LOW: The minimum price for the period
The Scalping Project EA follows a scalping breakout strategy. It trades the breakouts from relative highs and lows. For the entry stop orders are used for the fastest possible execution. Profits can be secured by the adjustable trailing stop. Since the strategy works with small average profits it is highly suggested to trade with a low spread and commission broker. Trading costs are crucial here! The backtests shown in the screenshots were done with the default settings. There might be better or
ONLY 3 COPIES OUT OF 10 LEFT AT $299! After that, the price will be raised to $349. IMPORTANT! Contact me immediately after the purchase to get instructions and a bonus! Advanced Fibo levels is a trading robot for the trading on forex. This is a Fibonacci system that designed to trade for most popular Fibonacci strategy that's completely automated. Warning:
I only sell EA's through MQL5.com. If someone contacts you saying it is me trying to sell you something, they are a Scammer. Block and rep

Fit line supports to extrapolation next movement of market, support for buy/sell decision. Indicator using spline algorithm to extrapolation. You can change number of spline with parameter "PointsNumber" and number of extrapolation point with "ExtrapolateBars". Eextrapolation points will be save into csv format, with prefix in parameter "PointsPrefix", and store in folder File of Data Folder.

FRB Trader - Our mission is to provide the best support to customers through conted and tools so that they can achieve the expected results
FRB Strength - Indicator shows the current strength of the asset between buyers and sellers. - It can only be used by brokerage houses that report data on trading volumes, such as B3. In the forex market it is not possible to use.

El indicador Crash Wizard funciona en un marco de tiempo de 1 minuto de Crash 500 y Crash 1000 SOLAMENTE. Este indicador trazará una roja (x) en la vela Drop. trazará flechas verdes como señal de entrada de COMPRA y trazará naranja (x) como puntos de salida múltiple. Usted el indicador es 85% Preciso. puede usarlo junto con la acción Price.
NOTA:
Para usar el indicador, asegúrese de tener una cuenta con Deriv, el único corredor de índices sintéticos. NO lo use en ningún otro activo.

Impulse Fibo indicator is used to determine price levels after some price impulse occurs. How to use it you can see in screenshots and video. In the indicator setup you can fix two different setups for two different patterns. For drawing convenience also two different rectangles can be easy put on the screen to draw support/resistance levels. .
Inputs Draw pattern 1 Line color - choose color from dropdown menu
Line style - choose style from dropdown menu
Line width - enter integer number 1,2

Perfect Sniper ! es un indicador triple con deteccion de soporte resistencia , canal de tendencia bajista, canal de tendencia alcista Bandas incluidas ! donde caza los rebotes en las lineas rojas marca venta , en las lineas verdes marca compra , en las bandas de mas abajo que son los quiebres da otra segunda entrada sea buy o sell , perfecto para aprobechar la doble entrada , se usa en cualquier temporalidad , sirve para hacer scalping y largos en h1 o h4 asta D1 . Sirve para los merc
One of the basic needs of every trader is to have a checklist to enter every position. Of course, using pen and paper may not be convenient forever. With this indicator, you can have a small checklist next to the screen for each of your charts and use it for better use in your trades.
By pressing the r button, you can return everything to the original state.
MT4 Version
This indicator will have many updates and special settings will be added to it.
You can contact us via Instagram, Telegram
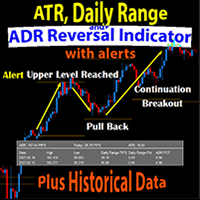
The Daily Range ATR ADR Reversal Indicator shows you where price is currently trading in relation to its normal average daily range. You will received alerts via pop-ups when price exceeds its average daily range. This will enable you to identify and trade pullbacks and reversals quickly.
The Indicator also shows you the Daily Range of Price for the current market session as well as previous market sessions. It shows you the ATR which is the average range of pips that a candle may move in that
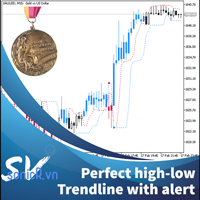
This indicator calculate trendline base on high, low of two period: fast and slow. From that, we have two line for fast signal and low signal. We tested many time on many assets, in most case, when fast signal crossup slow signal, price going up and vice verser. We also add alert function when two signal line crossed. For most effecient, user can change fast and slow period in setting. This indicator is good advice for price move. It better when combine with other trend indicator. For me, i us

The TrendChangeZone indicator displays global and local price highs and lows on the chart. The indicator also shows the global trend on the chart and corrective waves. This indicator is designed to determine the direction and change the trend. Most importantly, the indicator shows trend continuation or reversal zones. An indispensable assistant in trading. The indicator does not redraw. The indicator can work on all trading instruments.
Important !!! Top trend if 2 (two) or more b

An oscillator that shows price changes and identifies areas of overbought and oversold. It can also show trend reversal points. WaveTrend Oscillator is a port of a famous TS /MT indicator. When the oscillator is above the overbought band (red lines) and crosses down the signal (solid line), it is usually a good SELL signal. Similarly, when the oscillator crosses above the signal when below the Oversold band (green lines), it is a good BUY signal. Good luck.

Máquina Trader Tendência Count on our trend tracker to carry out your operations on the Mini Index and the Mini Dollar!!! Operational Green is BUY and Pink is SELL!!! Enter the operation after closing the first color block!!! Developed and Tested on the 5 or 15 minute Chart for Mini Index and Mini Dollar!!! Can be used on any chart!!! Editable colors and period!!!
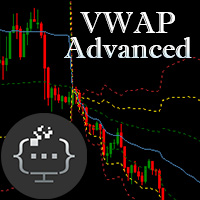
Introducing the Advanced VWAP tool - an essential technical analysis indicator that can help you identify trend directions and locate price extremas with multipliers. Designed to suit the needs of both traders and EA developers, this tool features customizable parameters that allow you to tailor it to your specific trading style. With Advanced VWAP, you have the ability to customize the colors and styles of all bands to your liking. If you don't require any bands, you can simply set their values
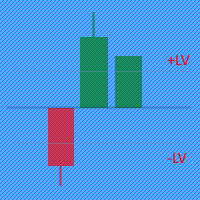
The Price Movement Strength indicator displays the direction and strength of the price change in the form of a candle on each price bar. If the indicator shows the closing level of the candle equal to zero on the current bar, then the price has not changed during bar. If the indicator shows a green candle, then the price of the trading instrument is growing, and vice versa, a red candle signals a price fall. Input parameters: The indicator has two parameters for setting buy/sell levels: BuyLevel

Defina su propio patrón de velas y este indicador se mostrará en la pantalla cuando aparezca este patrón Puede probarlo gratis en el Probador de estrategias y ver cuántas veces aparece su patrón de velas japonesas en el activo de su elección. También puedes pintar todas las velas de tu patrón o solo una Este indicador es útil para el análisis de velas japonesas, para que lo use en la acción del precio y con estrategias comerciales desnudas. Es un indicador que muestra el movimiento que elijas

Optimized Trend Tracker OTT is an indicator that provides traders to find an existing trend or in another words to ser which side of the current trend we are on.
We are under the effect of the uptrend in cases where the prices are above OTT ,
under the influence of a downward trend, when prices are below OTT
it is possible to say that we are.
The first parameter in the OTT indicator set by the two parameters is the period/length.
OTT will be much sensitive to trend movements if i
Unlike many other indicators including the moving average indicator, Pivot Point can be a leading indicator. In these systems, the price levels of the previous period are used to determine the critical points instead of relying on the current price performance. Such an approach provides a clear framework for traders to plan their trades in the best possible way.
You can use this method and its combination with the methods you want to build and use a powerful trading setup. MT4 version
Let us k
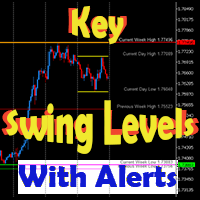
This dynamic indicator will draw the Key Swing High and Low Levels for any symbol on any timeframe!
User may Hide or Show any Level or Label and also Receive Alerts when price returns to that key level via Pop-Up, Push, Email or Sound.
Levels include Current Day High/Low, Previous Day High/Low, Current Week High/Low, Previous Week High/Low and Monthly High/Low.
The Levels are labeled with the Price Point Data Listed next to it for quick easy reference.
You can change the Style, Size an

The Advanced Momentum Trend indicator is an indicator used to determine trend directions. It determines the trends by considering many factors while calculating the trend. You can use this indicator as a trend indicator or in combination with other indicators that suit your strategy. You can also use it as a stand-alone trend filtering. Thanks to the alert feature, you can instantly learn about the new trends. To View Our Other Products Go to the link: Other Products

The Intra Daily Range Projection indicator forecasts the current day’s price range on the basis of the previous day data. All calculations are based on the book “New Science of Technical Analysis” by Thomas R. DeMark.
When you're analyzing investments, the trading range is a valuable analytical tool. The average trading range is the average distance between the high and the low over a specified period of time. You can calculate the average high-low range on a piece of paper, a spreadsheet, o

Phase accumulation adaptive bandpass filter MT5 Indicator is a Metatrader 5 (MT5) indicator and the essence of this technical indicator is to transform the accumulated history data. Phase accumulation adaptive bandpass filter MT5 Indicator provides for an opportunity to detect various peculiarities and patterns in price dynamics which are invisible to the naked eye. Based on this information, traders can assume further price movement and adjust their strategy accordingly.
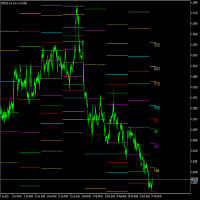
Fibonacci Pivots is a multi-timeframe indicator with custom alerts, designed to help traders easily identify key levels of support and resistance on any financial instrument. This advanced indicator uses the popular Fibonacci sequence to calculate pivot points based on the specified timeframe, depth, and backstep parameters. It also comes with customizable alerts. You can choose to be alerted when the price crosses any of the pivot points or when the price is within a specified frequency and pi

Correlation indicator is a trading indicator that compares price correlations on up to 8 different instruments simultaneously. This indicator is designed to be very versatile. It can be used to trade many different strategies from scalping to hedging to simple trend-following based on an average trend direction of multiple currency pairs or it can signal only when all the pairs correlate on the same side of a particular moving average. The indicator automatically applies the same moving average

"Scalper Channel MT5" is a modern channel indicator that shows the trader the direction of the trade. For work, the indicator uses built-in and proprietary technical means and a new secret formula. Load it on the chart and the indicator will show you the entry direction in color:
If the upper limit of the price channel of the indicator is blue, open a buy position. If the lower limit of the price channel of the indicator is red, open a sell position. If the border of the indicator is gray, ne

This indicator is suitable for trading on the pair and many others. The indicator itself uses universal calculations of additional accuracy, but so far they are optimized for some currency pairs. Many settings can be configured on the main menu. He displays his calculations on the graph in the form of icons. There are two types of icons. In the tester, it works fine by default in the settings. You can specify a color for its icons. There is a panel. Happy trading.

Price Stelar ! es un bot que cuenta con la estrategia de agarrar rebotes en los techos o pisos del canal Yellow, acompañando una ema para cazar la tendencia alcista o bajista , se ve bien claro en la foto de que trata la estrategia sirve para todas las temporalidades para hacer scalping y largos sirve para todos los pares de forex y para los pares de indices sinteticos ! desde ya a disfrutar buen profit World Inversor .

Trend Urano ! es un indicador que funciona en la sintonia de soporte y resistencia , dando entradas con los techos y pisos Red (Venta) Green (Compra) para agarrar una mejor tendencia ideal para hacer scalping en el Volatility 75 ! funciona para todos los pares de indices sinteticos ! y para todos los pares de forex ! ideal para el par Eur/Usd , Usd/Jpy ! desde ya a disfrutar Buen profit World Inversor .

Arrow Venus ! es un oscilador que usa la estrategia de cruzes captando la entrada sea en venta o compra , donde bieen se ve en la foto , cuando la linea cruza la linea azul con la roja , marcando la flecha roja es venta , cuando la linea azul cruza la roja hacia arriba y marca la flecha azul es señal de compra muy bueno para hacer scalping y largos ! se usa en cualquier temporalidad para los mercados de forex y indices sinteticos !

Fibo expert ! es un indicador de fibonacci automatico , adaptandose a cualquier temporalidad , para cazar perfect esos rebotes , o el camino de esa tendencia , especial para hacer largos en H1 o H4 clara la tendencia , pero tambien sirve para scalp en m1 asta m15 funciona para todos los pares de forex y para todos los pares de indices sinteticos , ideal para el volatility 75 en sinteticos sin mas a disfrutar buen profit World Inversor .

Stoch Mantra es un oscilador que sirve para cazar tendencias largas , como bien se ve en el mantra , da entrada cuando se cruzan las lineas , la linea azul de arriba cruzando la linea roja da entrada en venta , cuando es al reves cruzando la linea azul la roja para arriba da señal de entrada en compra . super simple y efectivo ! sirve para todos los pares de forex y indices sinteticos ! se usa en todas las temporalidades Buen profit World Inversor .

"AV Monitor MT5" is an indicator for MetaTrader 5, which alowes a history analysis of the closed orders. It helps to achieve a quick visual analysis of your own trading or different expert advisors among themselves. Compare and analyze your expert advisors: Which one is the best?
I use an "AV Monitor MT5" indicator per running expert advisor chart to track its performance split into long & short, as well as an index chart e.g. DOW with this indicator and the setting "Show Balance & Equity" to
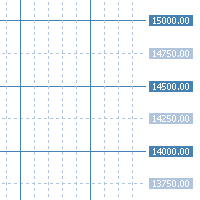
"AV Grid MT5" is an indicator for MetaTrader 5, which automatically displays round numbers as horizontal lines and a sensible period separation .
Round prices can be used as support and resistance in trading.
It is an improvement on the "Grid" setting, which also draws a grid on the chart.
Improvements :
- Round levels instead of arbitrary positioning of the horizontals
- Structure by highlighting all x lines (main lines, 2 or 5 makes sense)
- Vertical lines are each in two p
El indicador "EMA43 vs EMA89" es una herramienta poderosa para traders que buscan identificar cambios en la tendencia y oportunidades potenciales de trading. Este indicador muestra dos promedios móviles, el EMA34 y EMA89, en el gráfico. Cuando estos promedios móviles se cruzan, se genera una alerta de compra o venta, indicando un posible cambio en la dirección de la tendencia. Características: Fácil de usar: simplemente adjunte el indicador a su gráfico y comience a recibir alertas cuando el EMA

Count on our trend tracker to carry out your operations!
Operational Green is BUY and Pink is SELL! Enter the operation after closing the first color block!
Developed and Tested on the 5 or 15 minute Chart for Mini Index and Mini Dollar!
Can be used on any chart!
Editable colors and period!
“All strategies and investments involve risk of loss. No information contained in this channel should be interpreted as a guarantee of results or investment recommendation!”

Bienvenido al indicador de reconocimiento Ultimate Harmonic Patterns Este indicador detecta el patrón de Gartley, el patrón de murciélago y el patrón de cifrado en función de HH y LL de la estructura de precios y los niveles de Fibonacci, y cuando se alcanzan ciertos niveles de fib, el indicador mostrará el patrón en el gráfico. Este indicador es una combinación de mis otros 3 indicadores que detecta patrones avanzados Características : Algoritmo avanzado para detectar el patrón con alta precisi

Bollinger Bands based on Returns This indicator characterizes the price and volatility by providing a channel/band of standard deviations like the Bollinger Bands. In contrary to standard Bollinger Bands which uses price directly, this indicator uses returns due to normalization. The standard Bollinger Bands based on price directly, were one of the first quant or statistical methods for retail traders available. The issue with these bands, standard deviations can only be calculated, if the u

OHLC Volume Histogram displays the difference between two streams of the OHLC Volume volume indicator as a colored histogram. There are no input parameters. Calculation: Histogram = StreamUP - StreamDN where: StreamUP = Volume * UP_Coeff / (UP_Coeff+DN_Coeff) StreamDN = Volume * DN_Coeff / (UP_Coeff+DN_Coeff) UP_Coeff = High-Open DN_Coeff = Close-Low Volume - tick volume

What Is Moving Average Convergence/Divergence (MACD)? Moving average convergence/divergence (MACD, or MAC-D) is a trend-following momentum indicator that shows the relationship between two exponential moving averages (EMAs) of a security’s price. The MACD line is calculated by subtracting the 26-period EMA from the 12-period EMA. The result of that calculation is the MACD line. A nine-day EMA of the MACD line is called the signal line, which is then plotted on top of the MACD line,

“Multi timeframe Slow Volume Strength Index” shows data of three SVSI indicators from different timeframes on the current chart. The indicator has nine adjustable parameters: EMA period – EMA SVSI calculation period Smoothing – SVSI smoothing period Overbought – overbought level Middle – middle line Oversold – oversold level Drawing mode – indicator drawing type Steps – as a ladder Slope – sloping lines First SVSI timeframe – the timeframe of the first SVSI Second SVSI timeframe – th

Indicador gráfico para analizar el resultado del comercio, los indicadores de flecha, el trabajo del asesor, el desarrollo de la estrategia comercial.
Un parámetro principal es el porcentaje mínimo de ganancias.
El indicador muestra todas las tendencias en cualquier gráfico, teniendo en cuenta la barra cerrada y el fractal, calcula el porcentaje máximo de ganancias en cada tendencia.
Además, calcula el porcentaje promedio de ganancias del instrumento. Un mayor porcentaje entre los instrum

Indicador MQL5 "Resistencia y soporte diarios": dibuja líneas diarias de soporte y resistencia. El dibujo se lleva a cabo solo con la ayuda de objetos gráficos (líneas de tendencia); los búferes de indicador no se utilizan en este indicador. El indicador no tiene configuraciones: la búsqueda de niveles se lleva a cabo en las últimas 500 barras del marco de tiempo "D1" y este parámetro está cableado dentro del código. Operaciones manuales: Al operar manualmente, se recomienda utilizar este indic
The Bounce strength indicator (BSI) for meta trader 5 illustrates the strength of the market bounce. The +10 and -10 extreme bounds are used by the indicator. The blue bars show a bullish bounce, while the pink bars show a bearish bounce. The indicator, in essence, depicts market volatility for both up and down moves. When utilized appropriately, the indicator performs equally well on all currency pairs and produces encouraging returns.
Extreme Price Meter
Basado en información histórica del mercado, el indicador calcula cuál será el próximo precio extremo con una alta probabilidad de reversión . Genera 2 bandas de precios donde existe una alta probabilidad de compra o venta. Es fácil ver la alta precisión del indicador considerando las flechas que coloca cuando una vela se cierra fuera de las bandas de probabilidad. Notificaciones para escritorio, teléfono y correo electrónico.
This is MT5 version of StochScanner It scans Stochastic from Multi Symbols and Multi Timeframes and displayed on the dashboard on a single chart. . 4 scanning modes: 1. Mode OverBought/OverSold Indicator scans Overbought and OverSold . OverBought : current stochastic is above level 80 and OverSold : current stochastic is below level 20 2. Mode Signal It means if the previous stochastic is on OverBought or OverSold ( either Main Line and Signal Line ) and the current Main Line cross over the curr
El indicador funciona con dos períodos de tiempo, tiene una visualización de eventos directamente en el gráfico de trabajo y puede mostrar niveles horizontales que sirven como niveles de soporte/resistencia. Los diferentes valores de los volúmenes formados se muestran como una marca de color en la barra correspondiente, a partir de la cual se construyen los niveles, dirigidos hacia el lado derecho del gráfico. En el gráfico de trabajo, también se muestran los niveles recibidos del período de tie
El indicador funciona con dos períodos de tiempo, tiene una visualización de ondas directamente en el gráfico de trabajo y muestra niveles de ondas horizontales. El indicador ZigZag conecta máximos y mínimos significativos en el gráfico de precios con líneas inclinadas visibles que facilitan la percepción del movimiento de las olas y divide las olas en rangos por niveles. Los extremos se calculan por precios High \ Low o Close. Los niveles de ola se proyectan en la siguiente ola, lo que le permi

Your search for a perfectly simple ICT Killzone indicator for MT5 is now over because here it is. If you trade ICT concepts, then you know what ICT Killzones are. ICT Killzones (by default is adjusted to EST New York Time, no recalibrating to your timezone needed. Just load it onto your chart and you're good to go): Asian Open Killzone (06:00PM - 12:00AM EST New York Time) London Open Killzone (02:00AM - 05:00AM EST New York Time ) New York Open Killzone (07:00AM - 9:00AM EST New York Time )
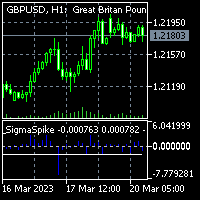
To get access to MT4 version please click here . - This is the exact conversion from TradingView: "SigmaSpikes(R) per Adam H. Grimes" by "irdoj75" - This is a light-load processing and non-repaint indicator. - All input options are available. - Buffers are available for processing in EAs. - You can message in private chat for further changes you need. Thanks for downloading

Índice de tipo de fractal CZSC
Características:
Llevó a cabo un procesamiento exhaustivo de la relación de inclusión.
Es conveniente usar la llamada de EA para juzgar si se trata de una clasificación de arriba a abajo, y el estado en "Enseñando a almacenar 93: la relación entre las dos tablas y el interior de la estructura de tendencia 2"
Mostrar clasificación superior-inferior con flechas
Mostrar posibles bolígrafos en diferentes colores.
La relación de inclusión de dos líneas K ad

Candlestick bar, you can call it Candlestick Scalping Beast(CBS). This indicator is made specifically for scalping. The strategy on the indicator is that it gives signal on the close of a candle following this rule, if the close of the candle/bar is high then the previous candle/bar ,then it is a buying signal (up-trend),a green arrow and if the close of the candle/bar is lower than the previous candle/bar , then it is a selling signal (Downtrend), a red arrow. And the ATR is a secrete recipe
MetaTrader Market ofrece a todos los desarrollador de programas de trading una sencilla y cómoda plataforma para ponerlos a la venta.
Le ayudaremos con la presentación y explicaremos cómo preparar la descripción de su producto para el Market. Todos los programas que se venden a través del Market están protegidos por una codificación adicional y pueden ser iniciados sólo en el ordenador del comprador. La copia ilegal es imposible.
Está perdiendo oportunidades comerciales:
- Aplicaciones de trading gratuitas
- 8 000+ señales para copiar
- Noticias económicas para analizar los mercados financieros
Registro
Entrada
Si no tiene cuenta de usuario, regístrese
Para iniciar sesión y usar el sitio web MQL5.com es necesario permitir el uso de Сookies.
Por favor, active este ajuste en su navegador, de lo contrario, no podrá iniciar sesión.