ZigZag Indicator with Trend Identification

MQL4 Indicadores

Trabajo finalizado

Plazo de ejecución 2 minutos
Comentario del Cliente
With commitment and patience

Tarea técnica

Hi,

i need an ZigZag Indicator which also identifies the higher trendlevels.

The ZigZag indicator should start at a reltive high or low. Relative high is where the previous high of a candle and the next high of a candle was lower, relative low same but the previous low and next low must be higher. There should be an input how many candles in the past the indicator should look for this, e.g. 100, means 100 candles back, if 102 fullfill the creteria of relative high or low, then start with this.

Once the first candle found, the indicator should paint the lines indicating an upward or downward movement.

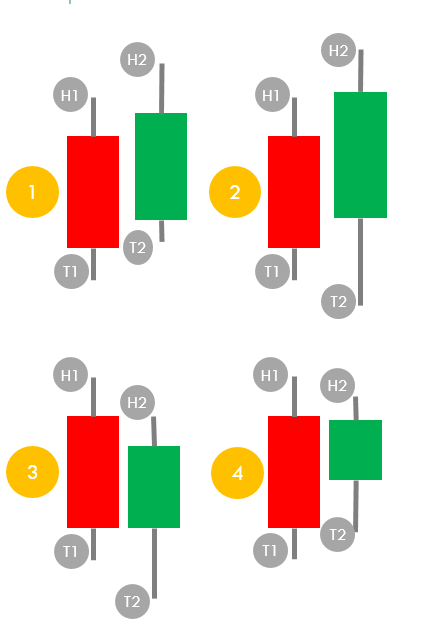
(1) Upward (2) cannot occur as there isnt a relative high or low (3) downward (4) neutral, wait for next candle

Once the initial movement is defined, all of the four situations above may occur. Lets assume there is an upward movement. (1) Continuing upward (3) turning from upward to downward (4) neutral, next candle, still upward .... what about (2)? its having higher high and lower low. Rule here: The existing overrules, if upward, then continuing upward when the candle body is long, if downward, continuing downward, WHEN the candle body is short, else turn.

On this lowest trendlevel the trend is defined. Its going up and down, creating 123 pattern. The next higher trendlevel only refers to the lowest trendlevel. As long the lowest trendlevel is in a downtrend, the upper trendlevel is in a downward movement, if the lowest trend is in an upward trend, the upper trendlevel is in an upward movement.

Ok but when the upward / downward movement of the upper level begin? When the lowest level starts an upward or downward trend by 123 pattern. Attention! When the lowest trend level breaks an upward or downward trend is the same as if a counter trend established.

Input is the number of historic candles. Outcome is the lowest trend level with lines, as per logic, it doesnt repaint. The upper level is painted based on the lowest trendlevel and will not repaint too.
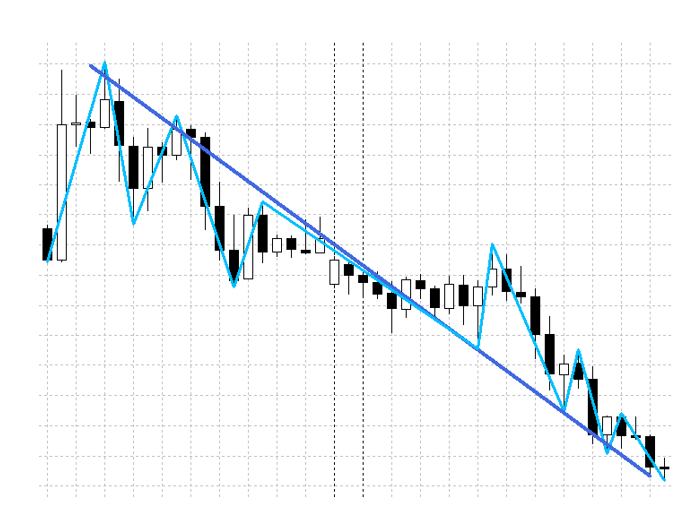
Example

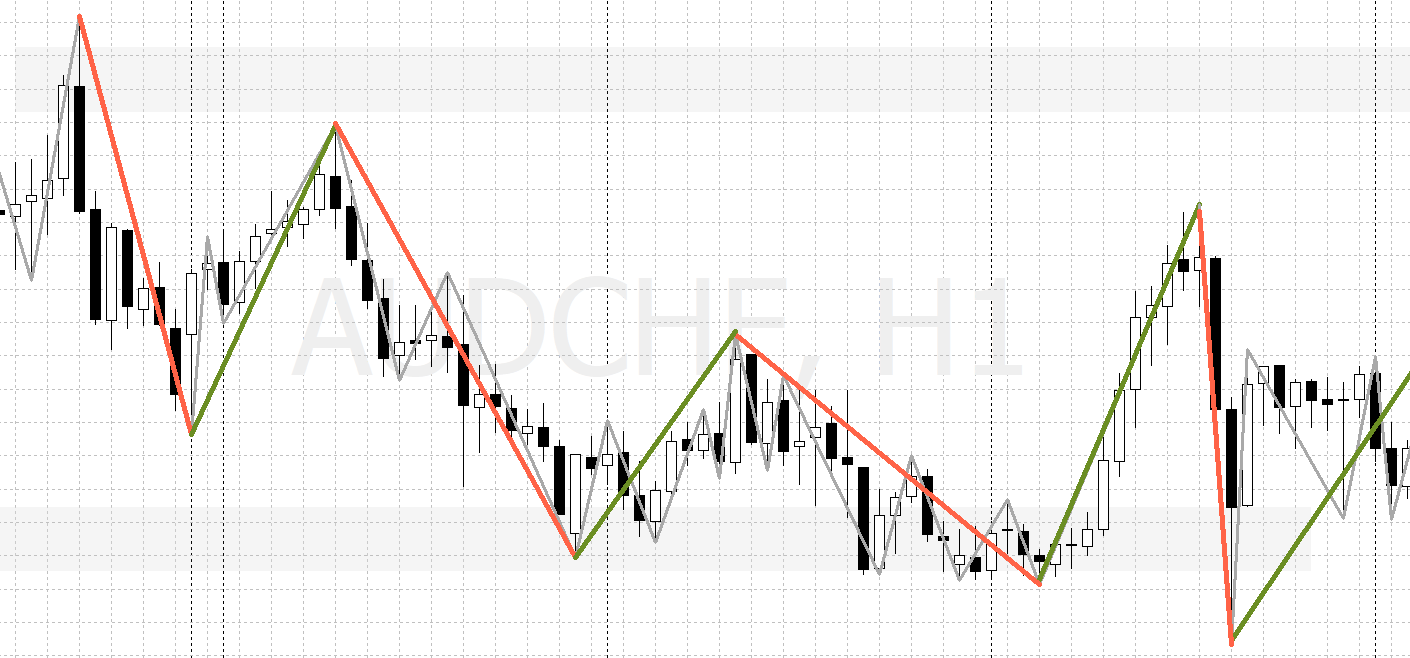
more examples grey line is lowest trend level, green and red are the upper trend


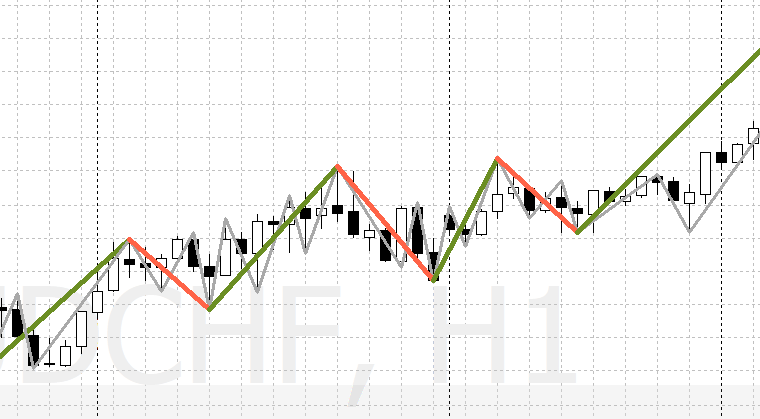
Another example for clarification,the lowest trend level (grey line) follows the highs and lows of the candles. Only the four situations explained above can occur. The upper trend level only follows the lowest trend level. You see how the trend breaks at the lowest level also defines upward or downward movements of the upper level. I have more examples if needed.


Han respondido

1
Desarrollador 1
Evaluación
(49)
Proyectos
134
27%
Arbitraje
62
13% / 53%
Caducado
58
43%
Libre
2
Desarrollador 2
Evaluación
(362)
Proyectos
501
41%
Arbitraje
145
17% / 73%
Caducado
98
20%
Ocupado
3
Desarrollador 3
Evaluación
Proyectos
0
0%
Arbitraje
0
Caducado
0
Libre
4
Desarrollador 4
Evaluación
(128)
Proyectos
236
65%
Arbitraje
30
37% / 23%
Caducado
49
21%
Libre
5
Desarrollador 5
Evaluación
(586)
Proyectos
1045
49%
Arbitraje
39
28% / 41%
Caducado
49
5%
Libre
6
Desarrollador 6
Evaluación
Proyectos
0
0%
Arbitraje
0
Caducado
0
Libre
7
Desarrollador 7
Evaluación
(219)
Proyectos
370
42%
Arbitraje
145
17% / 41%
Caducado
124
34%
Libre
8
Desarrollador 8
Evaluación
(4)
Proyectos
4
75%
Arbitraje
0
Caducado
0
Libre
Solicitudes similares
I need you to convert this tradingview indicator (PineScript) to MT5. The indicator need to work in any time frame and as the proposed script. It need to plot the ATR bands (as you can see in the attached image) and work as the proposed routine of ATR bands, when price close above or below the bands, the bars will change color (as you can see in the script and the image attached). Instead of sending alerts of buying
"Seeking an adept developer to help realize my custom NT8 strategy. Your expertise is integral to achieving success in this project. Are you interested in teaming up for a productive collaboration? Let's discuss the details together. Thank you!"
NinjaTrader 8 indicator that plots open prices of higher time frame bars. Time frames to choose from in the properties: 15sec, 30sec, 1min, 5min, 15min, 30min, 1hr, 4hr, 1day, 1week, 1month, 1 year (or any time based periods if that would make the development easier). Ability to customize lines is needed (style, color, thickness, etc.). Also, ability to extend certain lines all the way to the right by clicking on
"Looking for a proficient developer to bring my custom NT8 strategy to life. Your expertise is pivotal for the project's success. Interested in joining forces for a fruitful collaboration? Let's delve into the specifics together. Appreciate it!"
"Seeking a skilled developer to code my custom NT8 strategy. Your expertise is crucial for this project's success. If interested, let's discuss further details and ensure a mutually beneficial collaboration. Thank you!"
I need to convert a trading view indicator to mt4. the code was copied from here: Find it here ABC Finder by Melodicfish tv search on goo gl. It is a ABC Pattern finding tool. You can adjust the "Bars Back" setting to include more or less bars in the pattern. I usually have it set to 10 or 15 these settings seem to work well on most assets. The scripts allows you to set up a trade box automatically and has a call out
Looking for a tradingview expert to quickly code a 8 lined description for me (alert based) Apply if you are a proven expert in tradingview and have time to deliver this project under 2_3 days. I'll provide the file to the expert
Hi, I need an Indicator for my EA based on the VWAP and Standard deviation bands. Best if you have it already ready / working. It can look like this: https://ninjatrader.com/futures/blogs/what-is-volume-weighted-average-price-vwap/ https://www.sr-analyst.com/page_studydetail.php?prod=TV0015 It would need to have 2 modes: 1- Anchored one (in between some given hours) - reseting each day. 2- Continous
The future of the traders be a good traders and patient and humble person faithful loyalty to your job and last be a professional traders and helping a dream of us how to trade and etc,,,,,,,,,,,,,,,,,🤑
Firstly Indicator (1) or the first part \\ Draw a red line at the top of the zero candle _ M1 \\ Draw a blue line at the bottom of the zero _ M1 candle \\ Draw a red line at the top of the zero _ M2 candle \\ Draw a blue line at the bottom of the zero _ M2 candle \\ Draw a red line at the top of the zero candle _ M3 \\ Draw a blue line at the bottom of the zero _ M3 candle \\ Draw a red line at the top of the zero

Información sobre el proyecto

Presupuesto
100+ USD
IVA (19%): 19 USD
Total: 119 USD
Para el ejecutor
90 USD
Plazo límite de ejecución
a 5 día(s)