Hi,
i need an ZigZag Indicator which also identifies the higher trendlevels.
The ZigZag indicator should start at a reltive high or low. Relative high is where the previous high of a candle and the next high of a candle was lower, relative low same but the previous low and next low must be higher. There should be an input how many candles in the past the indicator should look for this, e.g. 100, means 100 candles back, if 102 fullfill the creteria of relative high or low, then start with this.
Once the first candle found, the indicator should paint the lines indicating an upward or downward movement.
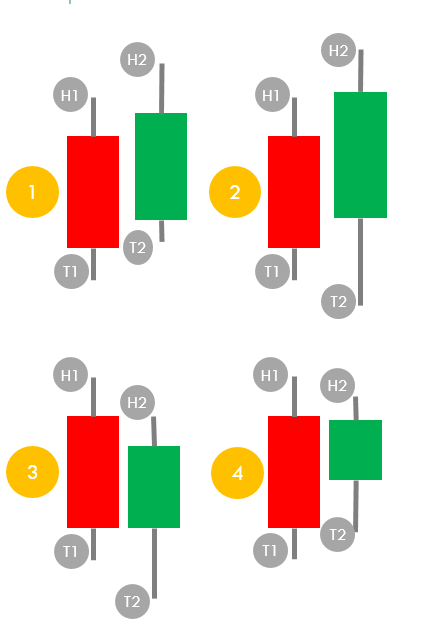
(1) Upward (2) cannot occur as there isnt a relative high or low (3) downward (4) neutral, wait for next candle
Once the initial movement is defined, all of the four situations above may occur. Lets assume there is an upward movement. (1) Continuing upward (3) turning from upward to downward (4) neutral, next candle, still upward .... what about (2)? its having higher high and lower low. Rule here: The existing overrules, if upward, then continuing upward when the candle body is long, if downward, continuing downward, WHEN the candle body is short, else turn.
On this lowest trendlevel the trend is defined. Its going up and down, creating 123 pattern. The next higher trendlevel only refers to the lowest trendlevel. As long the lowest trendlevel is in a downtrend, the upper trendlevel is in a downward movement, if the lowest trend is in an upward trend, the upper trendlevel is in an upward movement.
Ok but when the upward / downward movement of the upper level begin? When the lowest level starts an upward or downward trend by 123 pattern. Attention! When the lowest trend level breaks an upward or downward trend is the same as if a counter trend established.
Input is the number of historic candles. Outcome is the lowest trend level with lines, as per logic, it doesnt repaint. The upper level is painted based on the lowest trendlevel and will not repaint too.
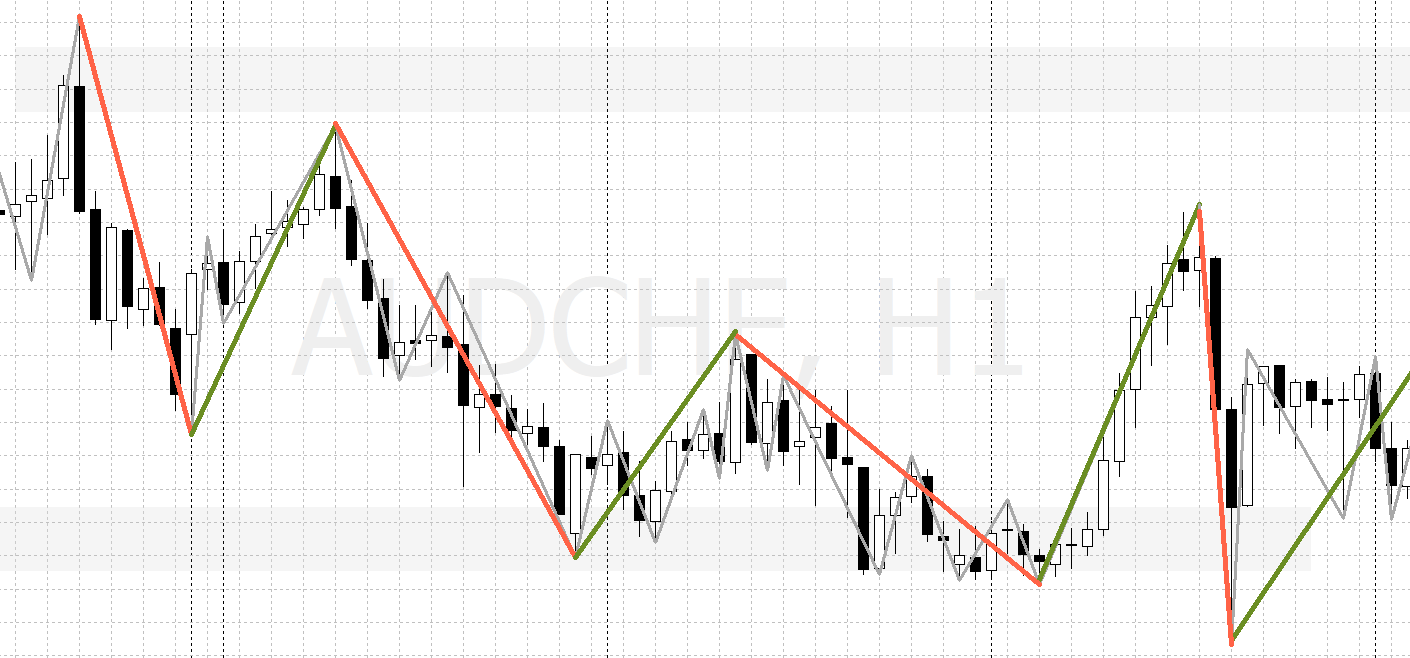
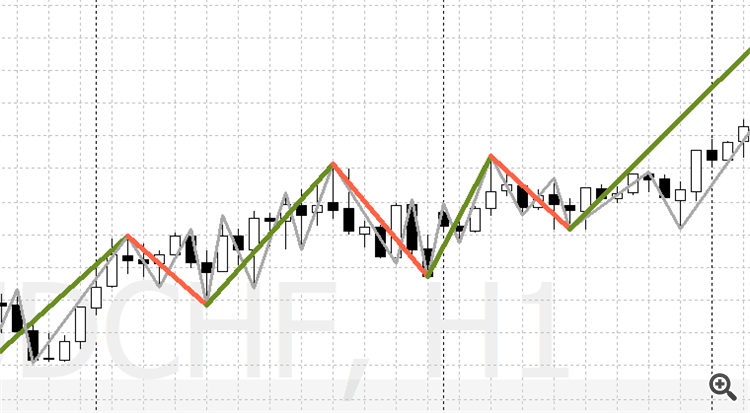
Example
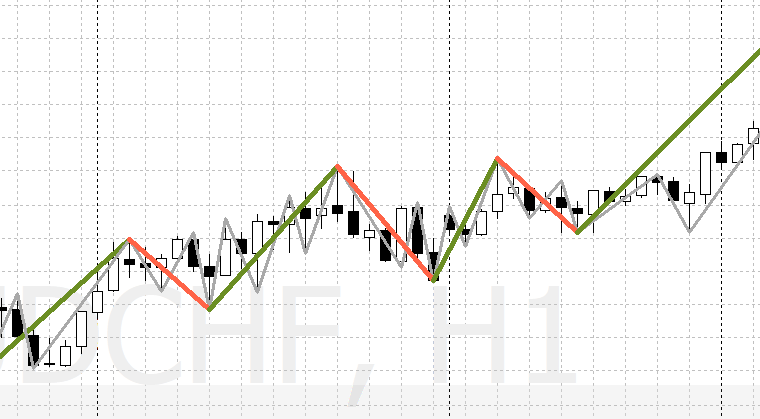
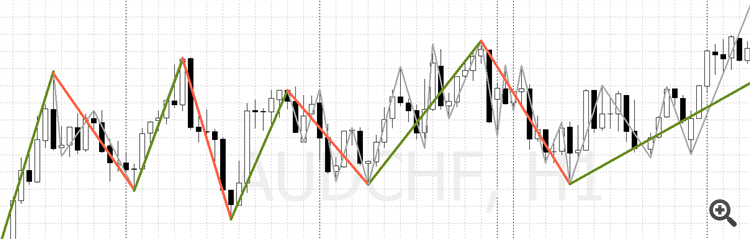
more examples grey line is lowest trend level, green and red are the upper trend
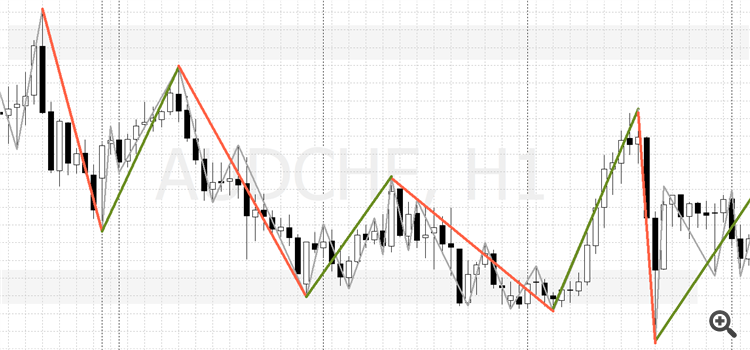
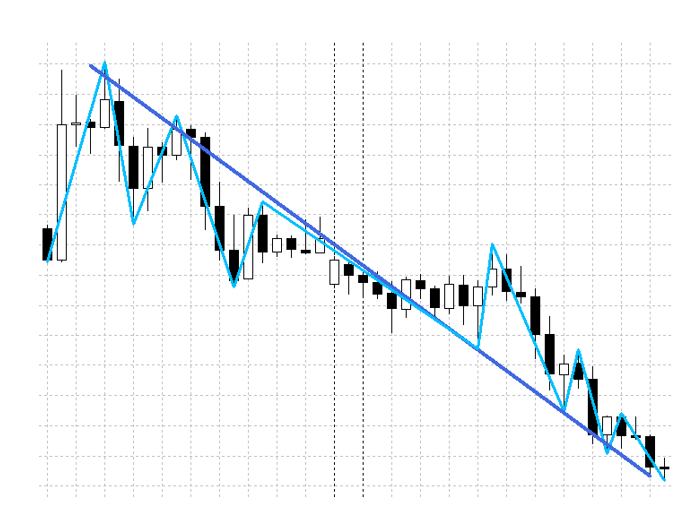
Another example for clarification,the lowest trend level (grey line) follows the highs and lows of the candles. Only the four situations explained above can occur. The upper trend level only follows the lowest trend level. You see how the trend breaks at the lowest level also defines upward or downward movements of the upper level. I have more examples if needed.
相似订单
I need a programmer for converting a MetaTrader indicator into ea for TradeLocker. Additionally, I would like to have a new EA built in TradeLocker that mirrors the logic of the original MetaTrader, including the specific rules and conditions I need. Please contact me only if you have prior experience converting scripts from MetaTrader to TradeLocker
I HAVE A SQ EA AND IT NEEDS TO RUN WITH 3 SETS WITH DIFFERENT TIME CONFIGURATION. Basically the trade logic will read different input values for the same parameter with the same and/or different timeframes and manage trades accordingly and individually. If it is a trouble, timeframe can be ignored and we can continue only with the parametrization
I need to make several modifications to an EA (Expert Advisor) and would appreciate it if you could provide your most competitive quote for these edits. Please let me know your best price for completing these changes, as I’m looking to get this done promptly and effectively. Thank you
hello here am looking for someone that can assist me in removing validation form my demo file and if anyone is interested dm the for more details i will be waiting to get any reply by some on that can assist me with this
I want a combined Standard deviation channel and Fibonacci channel indicators into just one indicator. The standard deviation channel lines would have same characteristics as the Fibonacci lines in terms of format (adjustable width, colors, type, size etc.). I want unique buffer values for all the lines (for both the 3 upper and 3 lower STD.DEV lines and the same for the Fibonacci channel lines) which would be
A green point should be added at the Low point of candlesticks in the oversold zone—it is the L point. If there is at least one L point between two H points, search for a LL point in the interval between two H points. The candlestick with the lowest Low price will be the LL point. Generally, the LL point is not necessarily an L point. Search for candlesticks with the lowest Low price. If there is at least one H point
Trading robots are programs, which operate according to underlying algorithms. An algorithm is a set of actions that need to be performed in response to certain events. For example, the most common task in algo trading is the identification of the "New bar" event. When the event occurs, the robot checks the emergence of trading signals and acts accordingly. Before you decide to program or order a trading robot, you
The overbought zone is determined as candlesticks, at which the indicator value Value > Lmax (Lmax=-20). The oversold zone is determined as candlesticks, at which the indicator value Value < Lmin (Lmin=-80). The values of Lmax and Lmin should be included in indicator parameters. A yellow point should be added at the High point of candlesticks in the overbought zone—it is the H point. A green point should be added at
Help me to trade create orders for me and analyze the markets and decide when is a good time to buy or sell. Determine which pairs are best to use to trade with and indicate trading signals to me
Hi, Greetings. Can somebody revert with an offer to code a FVG Scanner across Forex Pairs / Time Frame Selection / Alert please in order to support a Trading Strategy where entries are considered with the market direction confluence such as a Half Trend / Semafor Indicator. Look forward to hear back. Kind Regards. Anton