Hi,
i need an ZigZag Indicator which also identifies the higher trendlevels.
The ZigZag indicator should start at a reltive high or low. Relative high is where the previous high of a candle and the next high of a candle was lower, relative low same but the previous low and next low must be higher. There should be an input how many candles in the past the indicator should look for this, e.g. 100, means 100 candles back, if 102 fullfill the creteria of relative high or low, then start with this.
Once the first candle found, the indicator should paint the lines indicating an upward or downward movement.
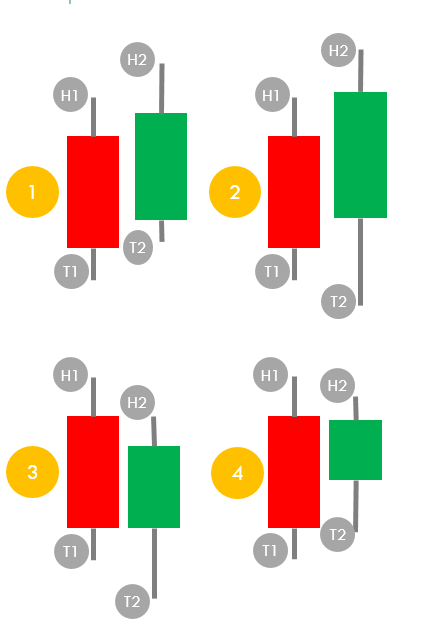
(1) Upward (2) cannot occur as there isnt a relative high or low (3) downward (4) neutral, wait for next candle
Once the initial movement is defined, all of the four situations above may occur. Lets assume there is an upward movement. (1) Continuing upward (3) turning from upward to downward (4) neutral, next candle, still upward .... what about (2)? its having higher high and lower low. Rule here: The existing overrules, if upward, then continuing upward when the candle body is long, if downward, continuing downward, WHEN the candle body is short, else turn.
On this lowest trendlevel the trend is defined. Its going up and down, creating 123 pattern. The next higher trendlevel only refers to the lowest trendlevel. As long the lowest trendlevel is in a downtrend, the upper trendlevel is in a downward movement, if the lowest trend is in an upward trend, the upper trendlevel is in an upward movement.
Ok but when the upward / downward movement of the upper level begin? When the lowest level starts an upward or downward trend by 123 pattern. Attention! When the lowest trend level breaks an upward or downward trend is the same as if a counter trend established.
Input is the number of historic candles. Outcome is the lowest trend level with lines, as per logic, it doesnt repaint. The upper level is painted based on the lowest trendlevel and will not repaint too.
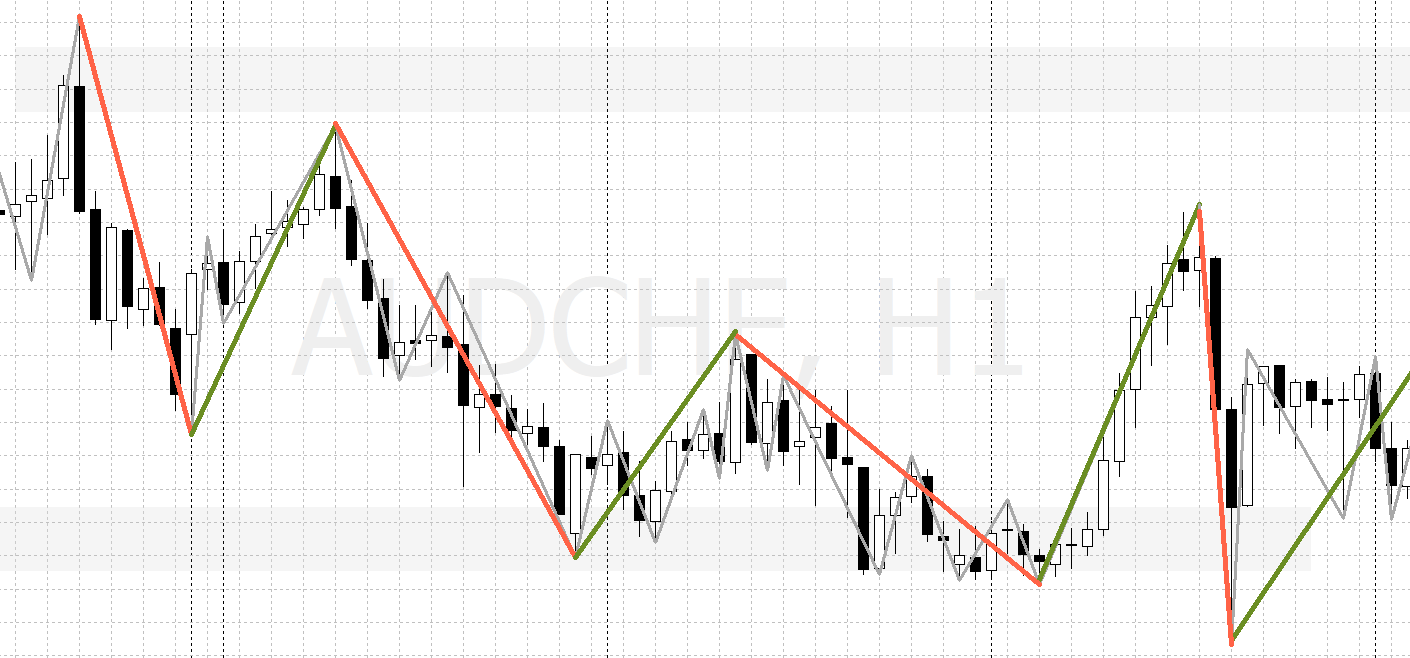
Example
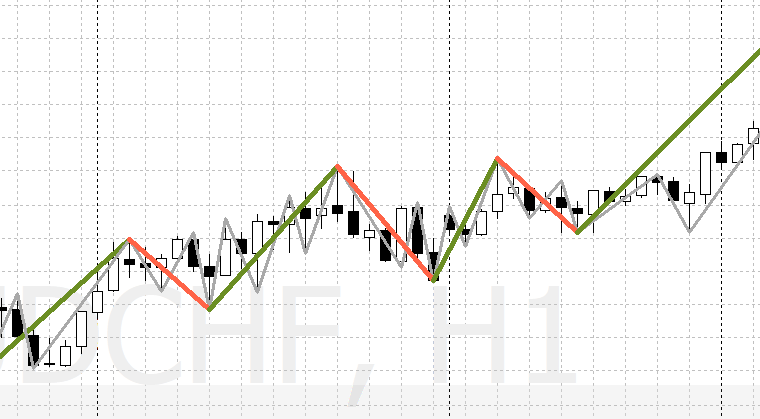
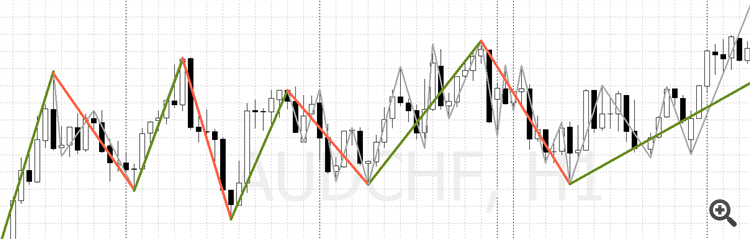
more examples grey line is lowest trend level, green and red are the upper trend
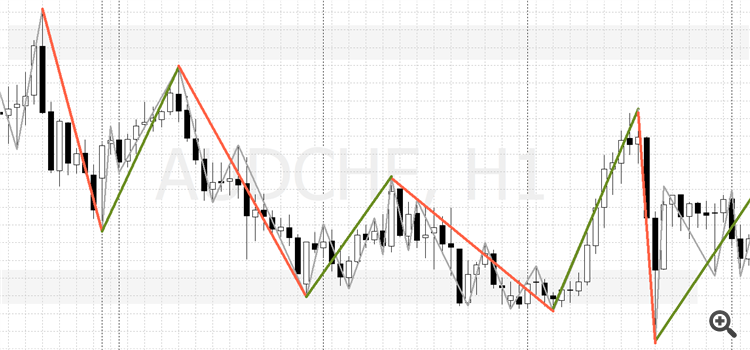
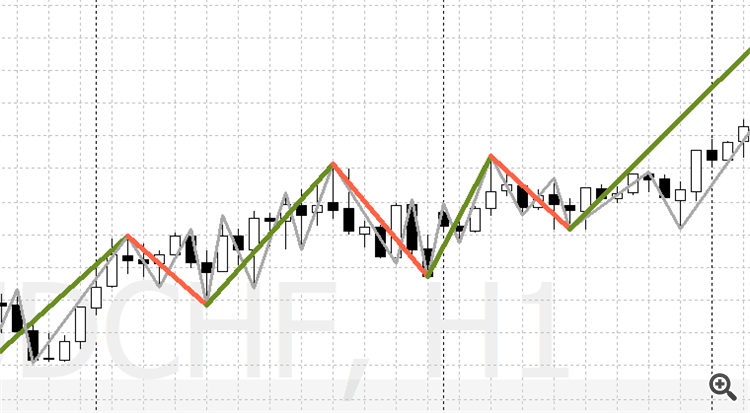
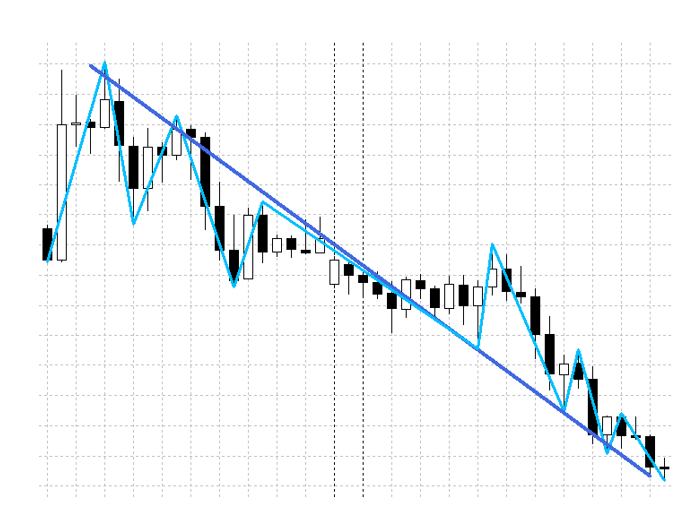
Another example for clarification,the lowest trend level (grey line) follows the highs and lows of the candles. Only the four situations explained above can occur. The upper trend level only follows the lowest trend level. You see how the trend breaks at the lowest level also defines upward or downward movements of the upper level. I have more examples if needed.
Similar orders
Hi, Greetings. Can somebody revert with an offer to code a FVG Scanner across Forex Pairs / Time Frame Selection / Alert please in order to support a Trading Strategy where entries are considered with the market direction confluence such as a Half Trend / Semafor Indicator. Look forward to hear back. Kind Regards. Anton
I am looking for an experienced expert to develop an Expert Advisor based on my idea. We can discuss the details in private messages. Please apply only if you are available now, as I need this project completed within one day
Project Description : I need an experienced programmer to convert the TradingView indicator "CURRENCY STRANGHT CHART by boitoki" into a MetaTrader 5 (MT5) format. The indicator should function identically to the original and be fully compatible for integration into an Expert Advisor (EA) on MT5. Requirements : Convert "TTD Middle Right Normal" from TradingView to a .mq5 file for MT5. Ensure all indicator features and
Project Description : I need an experienced programmer to convert the TradingView indicator "RSI BARS" into a MetaTrader 5 (MT5) format. The indicator should function identically to the original and be fully compatible for integration into an Expert Advisor (EA) on MT5. Requirements : Convert "TTD Middle Right Normal" from TradingView to a .mq5 file for MT5. Ensure all indicator features and visual signals are
Project Description : I need an experienced programmer to convert the TradingView indicator "TTD Middle Right Normal" into a MetaTrader 5 (MT5) format. The indicator should function identically to the original and be fully compatible for integration into an Expert Advisor (EA) on MT5. Requirements : Convert "TTD Middle Right Normal" from TradingView to a .mq5 file for MT5. Ensure all indicator features and visual
I want to create an indi to push notification when the candlestick chart forms 3 peaks or 3 bottoms forming a straight line: - 1,2,3 are 3 points in a straight line or NEARLY straight For example: Straight: NEARLY straight : means the peak/bottom of candle number 3 is NEAR the straight line connecting 1 and 2. Candle number 3 may or may not have crossed the straight line, as long as the peak/bottom of candle number 3
Hello! I am looking for an experienced Pine Script coder to create a custom indicator for mapping market structure based on fractals. The developer needs to know a lot about coding market structure indicators and be proficient in Pine Script. excited to collaborate with a gifted developer
I have list of free indicators in tradingview and i would like to convert them into an mt4 ea, But the EA will have and work based on the indicators features The list of the are listed as follows :> 1. Market Structure Break And Order block. By EmreKb 2. Rainbow Adaptive RSI by LuxAlgo 3. Multiple MA (21,50,100) 4. SuperTrend My budget for this 80$ max
good day i have an indicator but need the source for this reason The indicator only work on a single Time frame open trade, and close with only a single TF i will like the indicator work on multiple time frame just like other installed indicator My coder said the reason it cannot work like other indicator installed is because it has no buffer First confirm if you have the source code because its a popular indicator
Hello! I am looking for an experienced Pine Script coder to create a custom indicator for mapping market structure based on fractals. The developer must be skilled in Pine Script and have a solid understanding of how to code market structure indicators. Looking forward to working with a talented developer