Nguyen Thanh Trieu / Profile
- Information
|
no
experience
|
23
products
|
7
demo versions
|
|
3
jobs
|
0
signals
|
0
subscribers
|
My work is centered on:
- Market structure analysis
- Price action logic
- Risk visualization
- Custom indicators and utilities
I prioritize code quality, execution stability, and clear visual presentation.
Each product is designed to solve a specific trading problem, not to promise results.
I believe trading tools should support decision-making, not replace it.
All products are developed, tested, and maintained personally.
I am also available for freelance custom projects. If you have a specific trading idea or need a tailored solution, feel free to message me to discuss how we can work together.
You open your terminal. Three trades are running. The chart is moving. But is London active right now, or is this just noise before New York opens? Session Pulse Monitor displays live trading session status, volatility context, and open trade origin — directly on your chart. Designed for traders who work across multiple sessions and need to know when the market has institutional participation versus when it is drifting without direction. Works on all symbols — optimized for Gold (XAUUSD), major
MORVAN I am Morvan. I read direction. I wait for structure. I strike only when price hits the level where the move is most likely to unfold. No guessing. No revenge trades. No chasing candles through noise. I execute only when structure aligns — and I manage every position from entry to exit with discipline. Most traders do not lose because they cannot read a chart. They lose because they enter too late, size too loosely, place stops where liquidity expects them, and let emotion override the
Smart Confluence Radar Reading three separate indicators to find confluence takes time. By the time the signal is clear, the move has started. Smart Confluence Radar combines ATR expansion, volume momentum, and rate-of-change into a single visual layer directly on your candles. Free version with core features. For multi-timeframe overlay, alerts, and session filtering, see Smart Confluence Radar Advanced . What it shows: Colored candles: Bright coloring marks High confluence bars (score ≥70)
A candle closes with a large body. Looks like a breakout. You enter. The next bar reverses and stops you out. Volume was average. Momentum was already fading. Impulse Momentum Shift identifies bars with genuine impulse — and marks the moment that impulse reverses. Most traders read candle size. Real impulse combines three factors: body dominance, volume spike above the recent average, and directional momentum normalized by ATR. This indicator scores each bar across all three dimensions, paints
Murrey Math Channels Identifying key market reversal points and core trading ranges can be challenging. Traditional analysis often lacks clear mathematical structure, leading to inconsistent entries. Murrey Math Channels provides a mathematically grounded price framework based on the Law of Octaves to help traders define precise support, resistance, and reversal zones. How to Read the Chart: The indicator divides the price action into 8 main octaves (levels), each representing a different market
Parabolic Trend Corridor Identifying trend direction and volatility boundaries is a common challenge for day traders. Standard indicators often lack a holistic view of both trend structure and market noise. Parabolic Trend Corridor solves this by combining the adaptive nature of Parabolic SAR with dynamic ATR volatility bands. Key Features: Adaptive Trend Core: Uses Parabolic SAR as the foundation to follow price movement and volatility changes without lag. Dual-Color Cloud: Dynamic visual
SMC Liquidity Channel Guard Prices reverse just as your breakout trade triggers. Account suffers unexpected drawdown. Because standard channels ignore institutional liquidity sweeps and trap retail stop-loss orders. This utility automatically monitors highest buy-side and lowest sell-side liquidity pools to flag false breakouts. Key Features: Dynamic Liquidity Tracking: Maps Buy-Side (BSL) and Sell-Side (SSL) boundaries without lagging moving averages. Sweep Identification: Prints precise
| Specification quality | 5.0 | |
| Result check quality | 5.0 | |
| Availability and communication skills | 5.0 |
Keltner Breakout Caught in market chop. Fake breakouts trigger unwanted trades. Because standard indicators lack dynamic volatility context. This utility automatically combines a Dynamic Volatility Channel, Dual MA trend detection, and RSI momentum filtering into one visual system. Key Features: Trend Cloud: Visually fills the trend zone with a dynamic Keltner-style volatility channel. Multi-Factor Breakout: Only issues a signal when price breaks the volatility channel AND trend/momentum confirm
| Specification quality | 5.0 | |
| Result check quality | 5.0 | |
| Availability and communication skills | 5.0 |
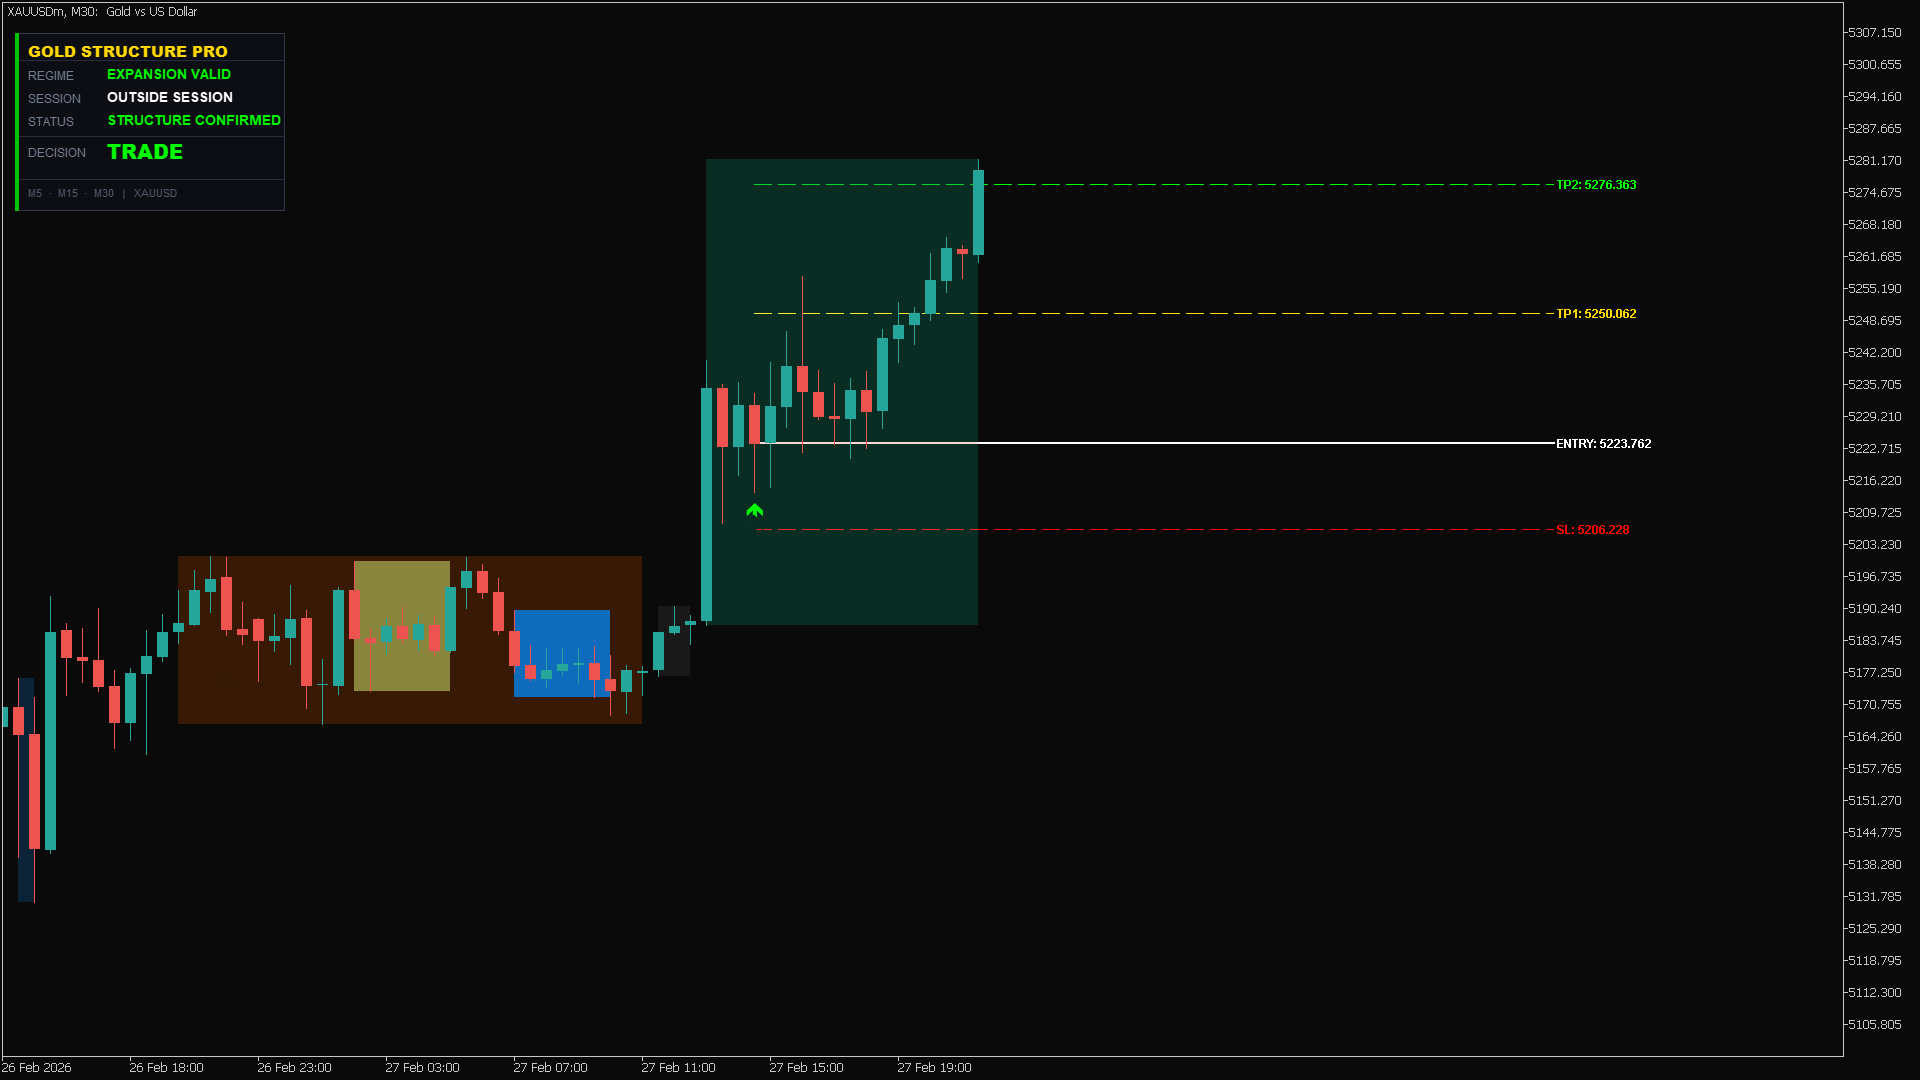
High-precision structure confirmation in action. As shown in the dashboard, the "Structure Confirmed" status gave us the green light to trade with confidence.
Asset: XAUUSD
Signal: Expansion Valid
Result: TP2 Hit perfectly 🎯
Stop guessing the trend. Let the algorithm do the heavy lifting.
👉 Try here: https://www.mql5.com/en/market/product/162441
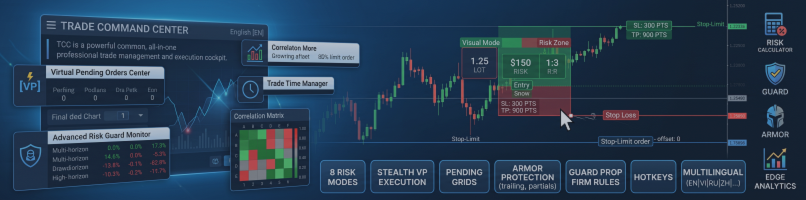
Trade Command Center is now live on the MQL5 Market.
It is a visual trade execution and risk management panel built for manual traders who want precise control over every order.
What it does:
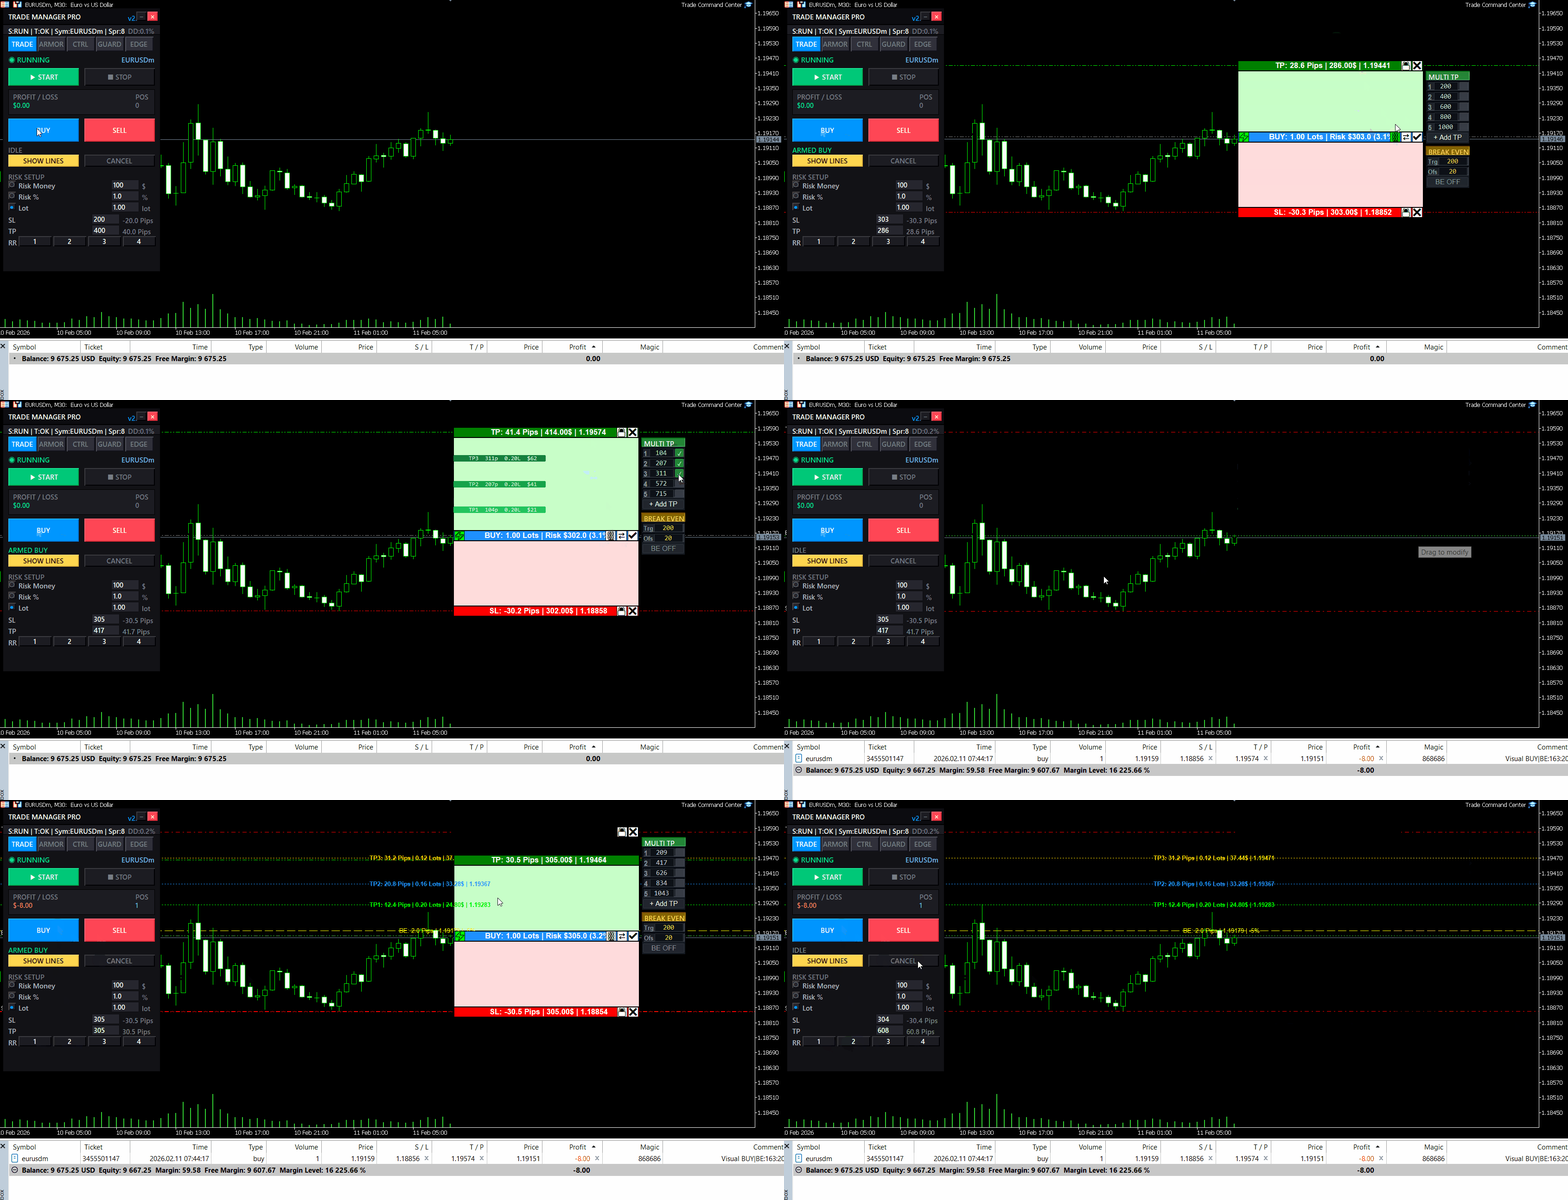
You place Entry, Stop Loss, and Take Profit directly on the chart as draggable boxes. The EA calculates your lot size automatically based on SL distance and your chosen risk mode (percent, dollar, or fixed lot). You see the exact dollar risk, pip distance, and R:R ratio before you click confirm.
Once the trade is open, automated management takes over:
- Break-even with per-trade override
- Trailing stop with step control
- Up to 5 partial take profit levels, each with its own trigger and close percentage
Risk Guard monitors your account across 6 timeframes: hourly, daily, weekly, monthly loss limits, equity drawdown percentage, and floating loss. A floating mini dashboard shows color-coded progress bars for each metric. When any limit is hit, all positions close immediately. Quick presets for FTMO and MFF rules are included.
Five tabs, one panel:
- TRADE — visual planning, risk calculator, one-click execution
- ARMOR — break-even, trailing, multi-level TP
- CTRL — position navigator, partial close, modify SL/TP, quick-close filters
- GUARD — drawdown limits, daily auto-close, advanced monitor
- EDGE — session stats, win rate, streaks, trade quality metrics
The panel uses chart objects.
It does not generate signals. It does not trade for you. It gives you the tools to execute and manage your own trades with precision.
Full feature demonstration available on the product page. Questions or feedback — use the Comments section.
Trade Command Center
👉 https://www.mql5.com/en/market/product/164935
Additional materials and instructions Installation instructions - Trial version of the application for a demo account ; Official Information Official channel Seller profile Trade Command Center — Professional Trade Execution & Real-Time Risk Guard Panel Trade Command Center is a high-performance visual trade execution, lot size calculator, and risk management utility for MetaTrader 5. It is engineered specifically for manual traders requiring strict risk enforcement, capital protection, and
You know that feeling when you enter a clean setup, only to watch it reverse 30 seconds later?
Not because your analysis was wrong.
Because the spread spiked. Or news dropped. Or the session died. Or volatility exploded while you weren't looking.
The chart showed movement. But movement without the right conditions is just noise.
I built something for that.
Market Bias Monitor MT5 — a real-time regime classifier that reads the market environment and tells you when conditions are actually favorable.
Four regime states: TREND, RANGE, TRANSITION, HIGH RISK.
A composite quality score from 0-100.
When conditions turn hostile, it shows you exactly why — spread, news, volatility, session, regime shift.
Multi-timeframe bias panel (M5 to W1). You see when lower timeframes conflict with higher ones before you enter.
Visual structure layer: swing zones, compression detection, ATR corridors.
Post-volatility stabilization logic — it won't let conditions flip back to "favorable" immediately after a spike. Forces you to wait.
Execution history strip — shows the last 5 bars as green (favorable) or red (unfavorable). Most traders are surprised how rarely conditions actually align.
This doesn't generate signals. It doesn't predict direction. It doesn't place trades.
It classifies the environment. You decide what to do with that information.
Demo available for testing. Works in Strategy Tester visual mode.
👉 Link: https://www.mql5.com/en/market/product/163815
Questions welcome in the comments.
Good setup. Wrong market state. Trade invalidated before it plays out. Wide spreads, off-session hours, volatility spikes, and proximity to high-impact news all destroy edge before execution. Market Bias Monitor classifies the live environment, scores execution quality from 0 to 100, and alerts you the moment conditions shift. Designed for discretionary and semi-automated traders analyzing Gold (XAUUSD), Forex pairs, and indices across M5 to W1 timeframes. Monitors regime, session, spread, news