PHAM KIM QUY RuaCoder / News feed
- Information
|
6+ years
experience
|
5
products
|
14
demo versions
|
|
0
jobs
|
3
signals
|
7
subscribers
|
Para entender por qué quedarse quieto es tan difícil, debemos observar la biología evolutiva humana. Nuestros cerebros se optimizaron para la supervivencia en la sabana, donde una reacción física inmediata ante el peligro marcaba la diferencia entre la vida y la muerte. Sin embargo, en los mercados financieros modernos, este exacto reflejo evolutivo se convierte en una costosa debilidad...
Lee el articulo completo aquí: https://forexbrokerchoose.com/es/learn/the-truth-about-action-bias-why-inaction-is-your-most-profitable-trade
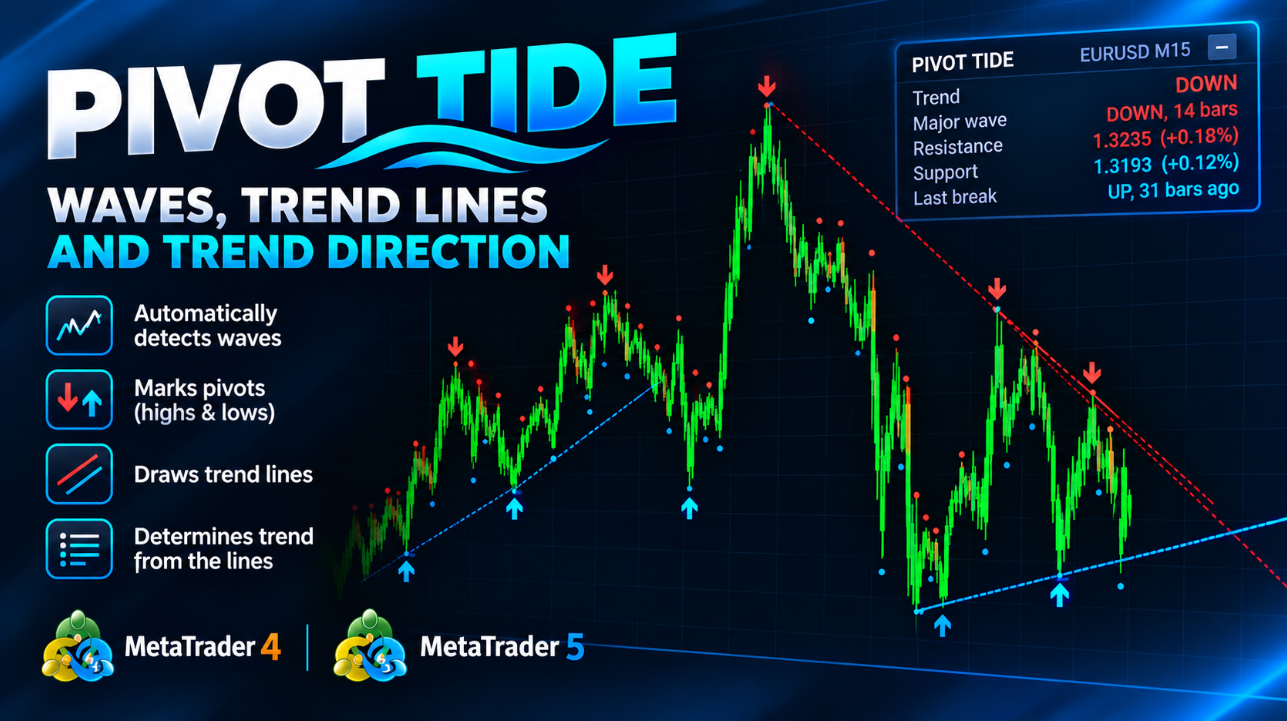
Pivots are joined into automatic trend lines: resistance through two falling peaks, support through two rising troughs. A line counts as broken when a candle closes beyond it, and live lines can extend to the right.
Trend comes from the lines. If both support and resistance are intact, it is a range. If only support survives, the trend is up. If only resistance survives, it is down. If neither survives, the last breakout decides. An optional draggable panel shows the trend, wave length, key levels and the last breakout, and alerts or push notifications fire on every trend change.
MT5-version: https://www.mql5.com/en/market/product/199662
MT4-version: https://www.mql5.com/en/market/product/199656
Pivot Tide — Wave Pivots, Auto Trend Lines and Line-Based Trend Direction Pivot Tide is an indicator for MetaTrader 4 that automatically splits the chart into waves, marks wave tops and bottoms, builds trend lines through them, and determines the trend direction from the state of those lines. Everything is drawn directly on the chart, together with a compact info panel. It works on any symbol and any timeframe. MT4-version: https://www.mql5.com/en/market/product/199656 What it does Detects
Pivot Tide — Wave Pivots, Auto Trend Lines and Line-Based Trend Direction Pivot Tide is an indicator for MetaTrader 4 that automatically splits the chart into waves, marks wave tops and bottoms, builds trend lines through them, and determines the trend direction from the state of those lines. Everything is drawn directly on the chart, together with a compact info panel. It works on any symbol and any timeframe. MT5-version: https://www.mql5.com/en/market/product/199662 What it does Detects
⭐️The classic trading style without any risky strategy (grid, martingale, doubling)
⭐️Every order has SL and trailing profit
⭐️ Bonus: any EA for free
Key Advantages of Vantage Platform
* Low & Competitive Transaction Costs: Extremely optimized Standard/Cent account spreads (XAUUSD from $12.15/lot, EURUSD from $6.30/lot, GBPUSD from $8.10/lot).
* Fast Order Execution: Smooth order execution with minimal delay (Fast Execution).
* High Security: Safe and secure protection of investor capital.
* Diverse Platforms: Full support for MT4 and MT5 trading platforms.
* Customer Support: 24/5 continuous customer service.
How to Register to Receive Backcom Rebates
👉 When registering a Vantage account, enter the partner code: BACKCOM68 to receive a transaction fee rebate.
https://vigco.co/la-com-inv/vi/Backcom68
Confluence Meter: one consolidated rating from 26 indicators Confluence Meter calculates the signals of 26 popular indicators and merges them into a simple sell / neutral / buy rating. You don't have to open dozens of windows and compare readings by hand. One glance at the panel is enough to see which way the market is leaning on the selected timeframe. MT5-version: https://www.mql5.com/en/market/product/199466 Our products: https://www.mql5.com/en/users/trendhunter/seller What you see on
Confluence Meter: one consolidated rating from 26 indicators Confluence Meter calculates the signals of 26 popular indicators and merges them into a simple sell / neutral / buy rating. You don't have to open dozens of windows and compare readings by hand. One glance at the panel is enough to see which way the market is leaning on the selected timeframe. MT4-version: https://www.mql5.com/en/market/product/199466 Our products: https://www.mql5.com/en/users/trendhunter/seller What you see on
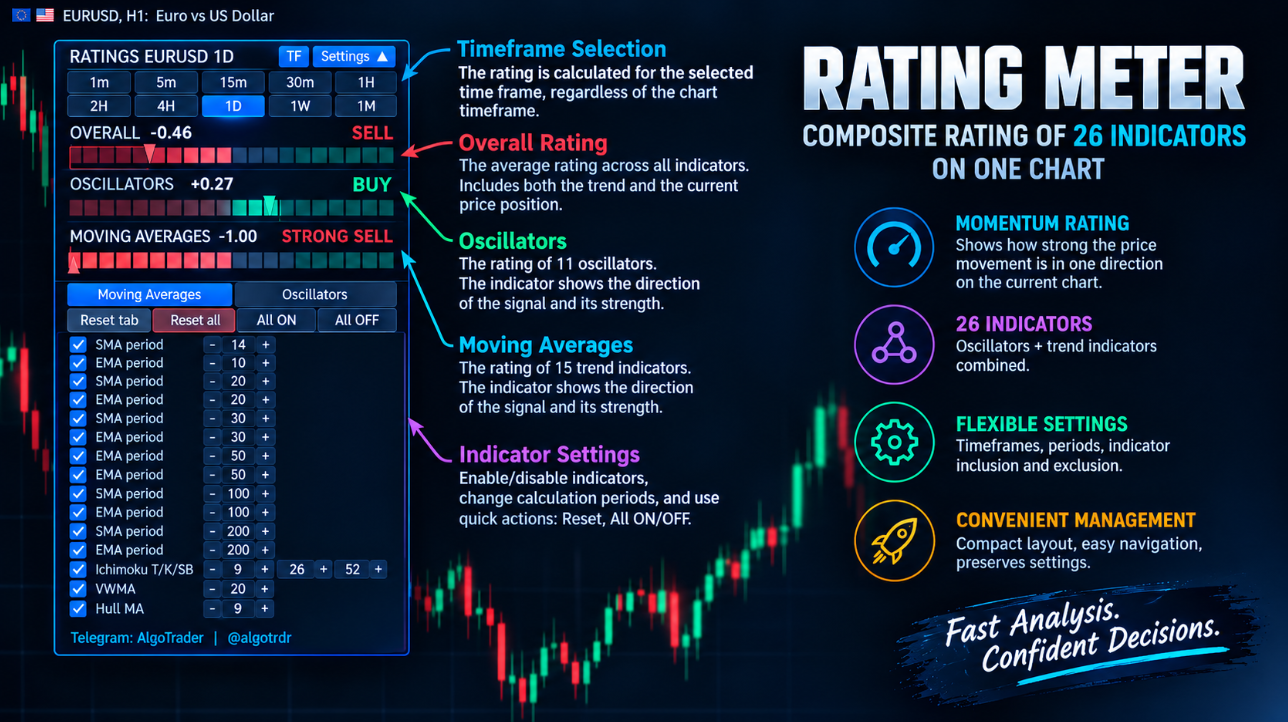
Rating Meter is a technical analysis panel for MetaTrader 5 that reads 26 popular indicators for you: 15 trend indicators (SMA and EMA on six periods, Ichimoku, VWMA and Hull MA) and 11 oscillators (RSI, Stochastic, MACD, CCI, ADX and others).
Each indicator casts a simple buy, neutral or sell vote, and the votes are averaged into a single rating from STRONG SELL to STRONG BUY. Two gauges show the oscillator and moving-average ratings separately, and an overall bar combines them. Each gauge has a needle and a vote counter, so you can see at a glance which way the market is leaning.
The panel is fully interactive. You can switch the rating between timeframes from 1 minute to 1 month, turn individual indicators on or off, and adjust their periods with plus and minus buttons, with the rating updating instantly.
The panel can be dragged anywhere on the chart, collapsed to show only the gauges, and it remembers your settings between restarts. It draws nothing on the price chart and opens no trades. It is a decision-support tool to use alongside your own strategy and risk management.
https://www.mql5.com/en/market/product/199402
Rating Meter: one consolidated rating from 26 indicators Rating Meter calculates the signals of 26 popular indicators for you and merges them into a simple sell / neutral / buy rating. You don't have to open indicator windows and compare readings by hand. One glance at the panel shows which way the market is leaning on the selected timeframe. Our products: https://www.mql5.com/en/users/trendhunter/seller What the panel shows Oscillators gauge: the rating of a group of 11 oscillators: RSI
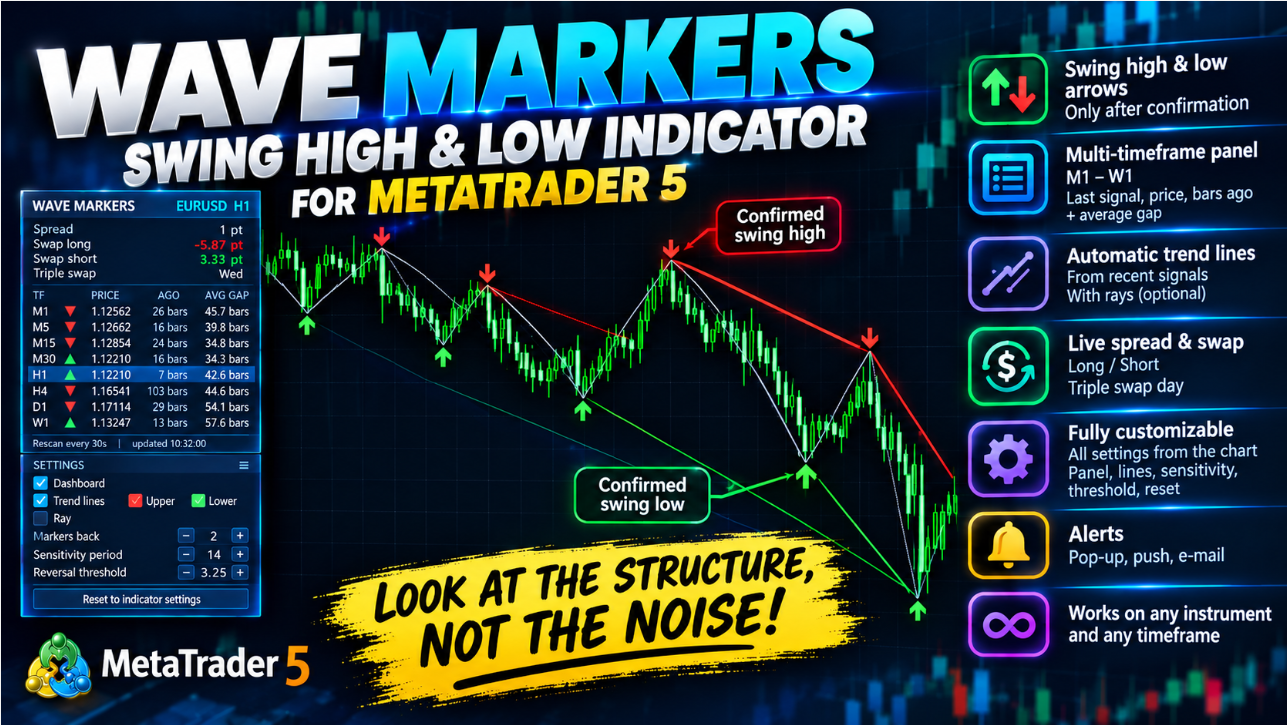
Wave Markers: adaptive swing map with a multi-timeframe dashboard See the real structure of the market, not just noise: confirmed swing highs and lows, trend lines through them, and the picture on every timeframe from M1 to W1 in one panel. What is it? Wave Markers is a chart-structure indicator for MetaTrader 5. It finds the turning points of price (swing highs and swing lows), marks them with clean arrows, and builds the analysis tools around them: trend lines, a multi-timeframe table, live
My Expert Advisor trade Gold (XAUUSD) on M5 time frame, Base on very special hedging strategy and it take a along time to test, I already run it on real account. Broker: only IC Markets (Raw Trading account: spread <15) and use VPS to run EA, Min deposit: from 100 usd. - From 100 usd to 1944.40 usd after 6 months (backtest but worthy to try). - No need to do, just run and get profit