Traders typically approach financial markets in one of two ways: either through technical analysis or fundamental analysis. The reality is that history is full of traders who have had very successful careers as traders that employed both of these types of analyses...
USDCAD Tests S3 Support Range Resistance Found at 1.0992 Prices above R4 Signal a Breakout USDCAD 30min Chart As seen in the chart above, the pair has retraced to its daily range support found at the S3 camarilla pivot near 1.0951...
“Of note is a weekly outside reversal and weekly RSI rolling over from above 70 this week. Prior instances of RSI rolling over (2004, 2006, and 2007) from above 70 indicated tops of at least several months...
1. Stock market investing vs. trading. Real stock market professionals understand that you cannot make money fast by investing into dividend paying stocks for the long haul. Stock trading is the only way for fast stock market investing success...
According to the reports, Republic of Ecuador will launch its official cryptocurrency in October this year. As its legislation has already been approved by the President Correa’s government last month, there would be no hassles in implementing this project...
Dojis Demonstrate Indecision From Traders Failure To Breach 103.00 Casts Doubt On Gains USDJPY may continue its consolidation with several successive Doji formations denoting indecision from traders. The pair remains in a congestion zone with sellers sitting nearby at 102.77/103...
Moving Average Convergence Divergence (MACD) shows the difference of two moving averages - EMA12 and EMA26, and a 9-day EMA of the difference is plotted against it to trigger buy or sell signal...
Three major types of charts 1. Bar Charts Bar charts provide traders with four key pieces of information for a given time frame: the opening price during that time frame; the closing price; the high price; and the low price. 2...
Fundamental Forecast for Yen: Neutral USDJPY Rallies as US GDP Rebounds Strongly in the Second-Quarter USDJPY Attempting to Breakout The USDJPY broke out of the bearish trend from earlier this year as the Federal Open Market Committee (FOMC) scaled back its dovish tone for monetary policy, but th...
Bollinger Bands indicator is used to identify and analyze trending markets. In a trending market this indicator clearly shows up or down direction. This indicator can be used to determine the direction of the forex trend...
Prices continue to race downward, with sellers now aiming to challenge 76.4% Fibonacci expansion at 97.30. A break below that on daily closing basis exposes a rising trend line set from June 2012, now at 96.28. Alternatively, reversal above the 61.8% level at 98.56 aims for 50% Fib at 99.58...
Building a buffer simply means adding profits to your account to protect your original balance/original account value (principle). For example, suppose you opened your account with $20K...
USD/JPY Technical Strategy: Flat Support: 102.71, 102.45, 102.25 Resistance: 103.03, 103.50, 103.79 The US Dollar may have completed a major upward breakout against Japanese Yen after prices cleared resistance capping gains since January...
Price Hovers Near Range Resistance Range Support Sits at 1.4533 Price Above R4 Signals a Breakout For the beginning of Wednesdays trading, the EURCAD remains locked between defined values of support and resistance. Range resistance, as marked above by the R3 camarilla pivot, resides at 1.4566...
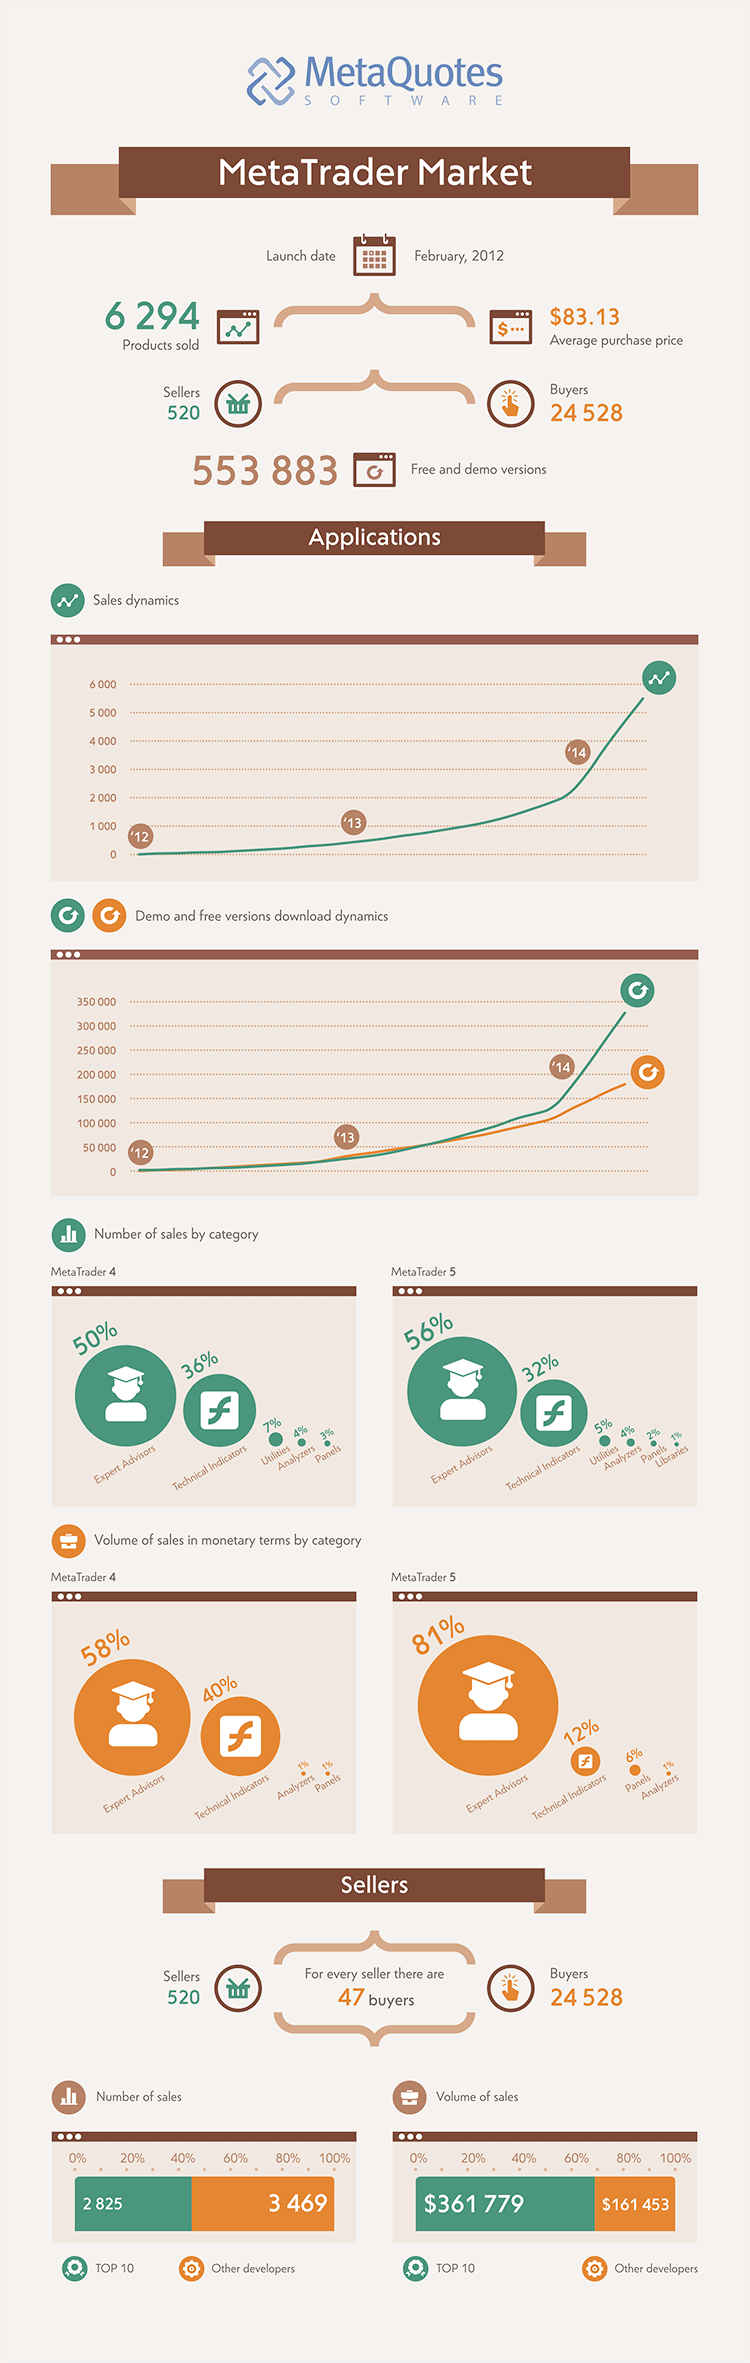
MetaTrader Market (https://www.mql5.com/en/market) was officially released in February 2012. The store of trading applications has come a long way since then. Initially the Market was introduced in MetaTrader 5. Then, the Market section was also launched for MetaTrader 4. The range of products has been expanded as well, from offering trading applications to provide also financial magazines and books.
The evolution of the Market increased the sales turnover: by July 2014, about 6 300 products worth a total of more than $522,000 have been sold in the Market, while 520 sellers and 24 500 buyers have already passed through the application store. This increase in sales has given rise to the emergence of the significant number of successful developers making $10,000 or more per month. Check the Market infographic below for more interesting statistical data on the Market service results.