Aleksandr Belykh / Profile
- Information
|
8+ years
experience
|
2
products
|
101
demo versions
|
|
0
jobs
|
0
signals
|
0
subscribers
|

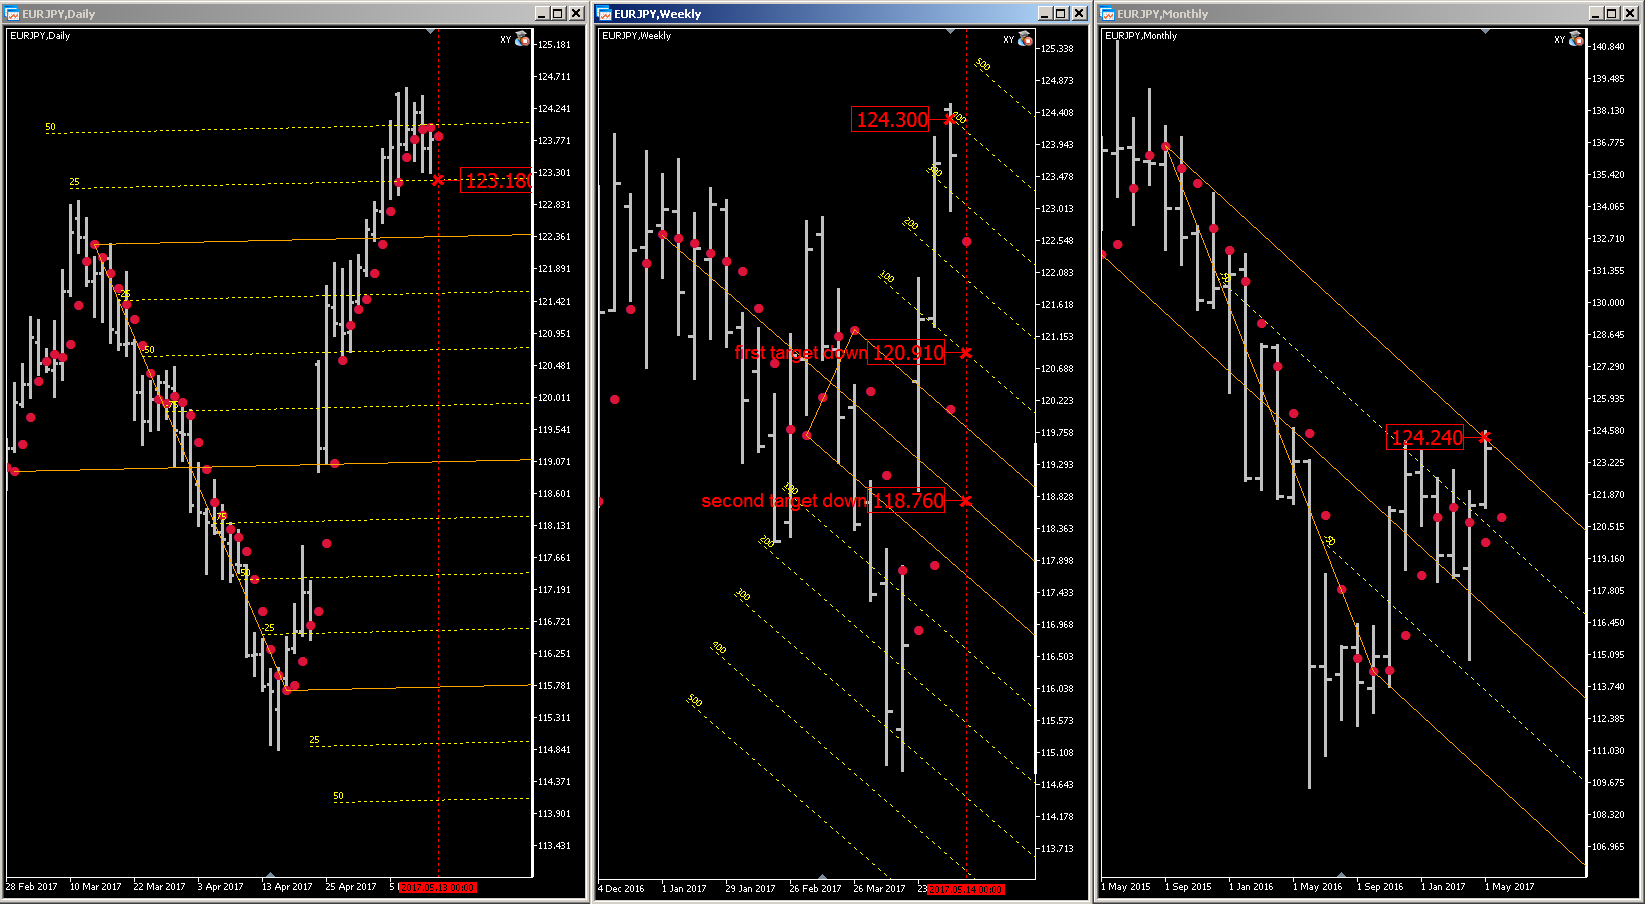
EURJPY trading opportunity 05.15 - 05.19 2017
EURJPY has good trading opportunity next week 05.15 - 05.19 2017. Multi time frame research using my tools (Multi time frame navigation and research tool XY adviser, MA and Andrews Pitchfork) on Monthly and Weekly charts has identified the key level 124.24 (M), 124.30 (W), and 123.18 (D), where the price highly likely to bounce down from 124.30 (W) to first target down 120.91 (W) and second target down 118.76 (W), because area 124.24 (M) - 124.30(W) is strong resistance zone. Selling after broken level 123.18 (D) is a good idea.

The article deals with managing MetaTrader user interface elements via an auxiliary DLL library using the example of changing push notification delivery settings. The library source code and the sample script are attached to the article.

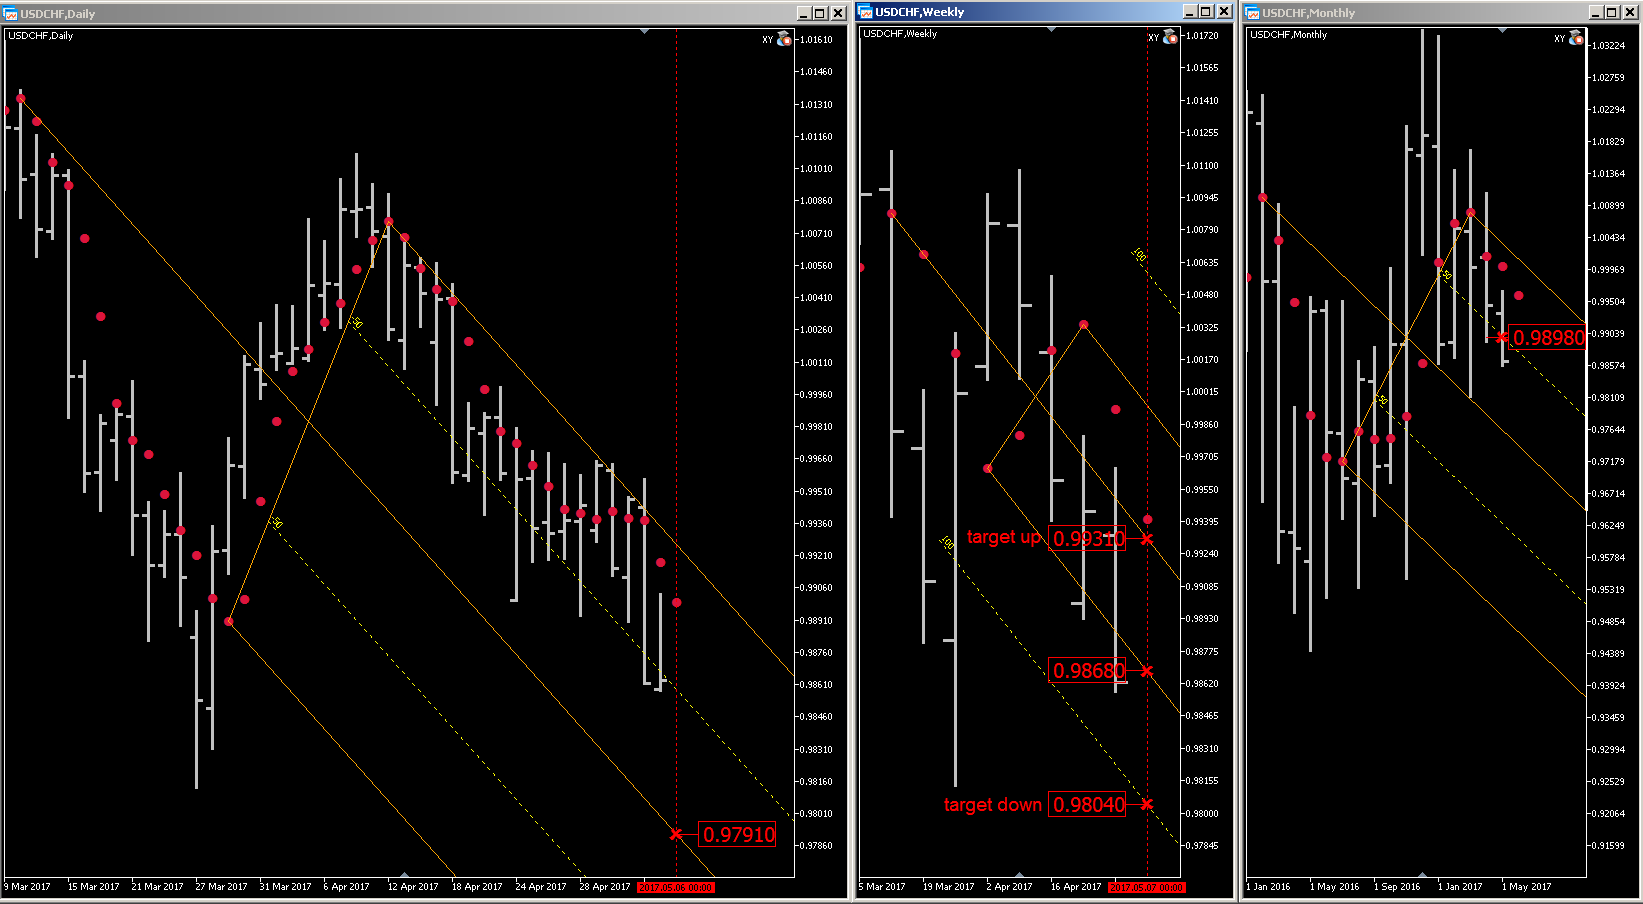
USDCAD trading opportunity 05.08 - 05.12 2017
USDCAD has good trading opportunity next week 05.08 - 05.12 2017. Multi time frame research using my tools (Multi time frame navigation and research tool XY adviser, MA and Andrews Pitchfork) on Monthly and Weekly charts has identified the key level 0.9898 (M), 0.9868 (W), and 0.9791 (D), where the price at first highly likely to bounce down from 0.9868 (W) to target down 0.9804 (W), because 0.9804 (W) is brocken that is confirmed by the last two bars on daily timeframe. Since the price is in the monthly support area of the level 0.9898 (M) is highly likely price to bounce up from strong support zone 0.9804 (W) 0.9791 (D) is a good idea, if the price do nont breaks through the key level zone 0.9804 (W) 0.9791 (D) down on daily time frame, the target up is 0.9931 (W).

NZDUSD trading opportunity 05.01 - 05.05 2017
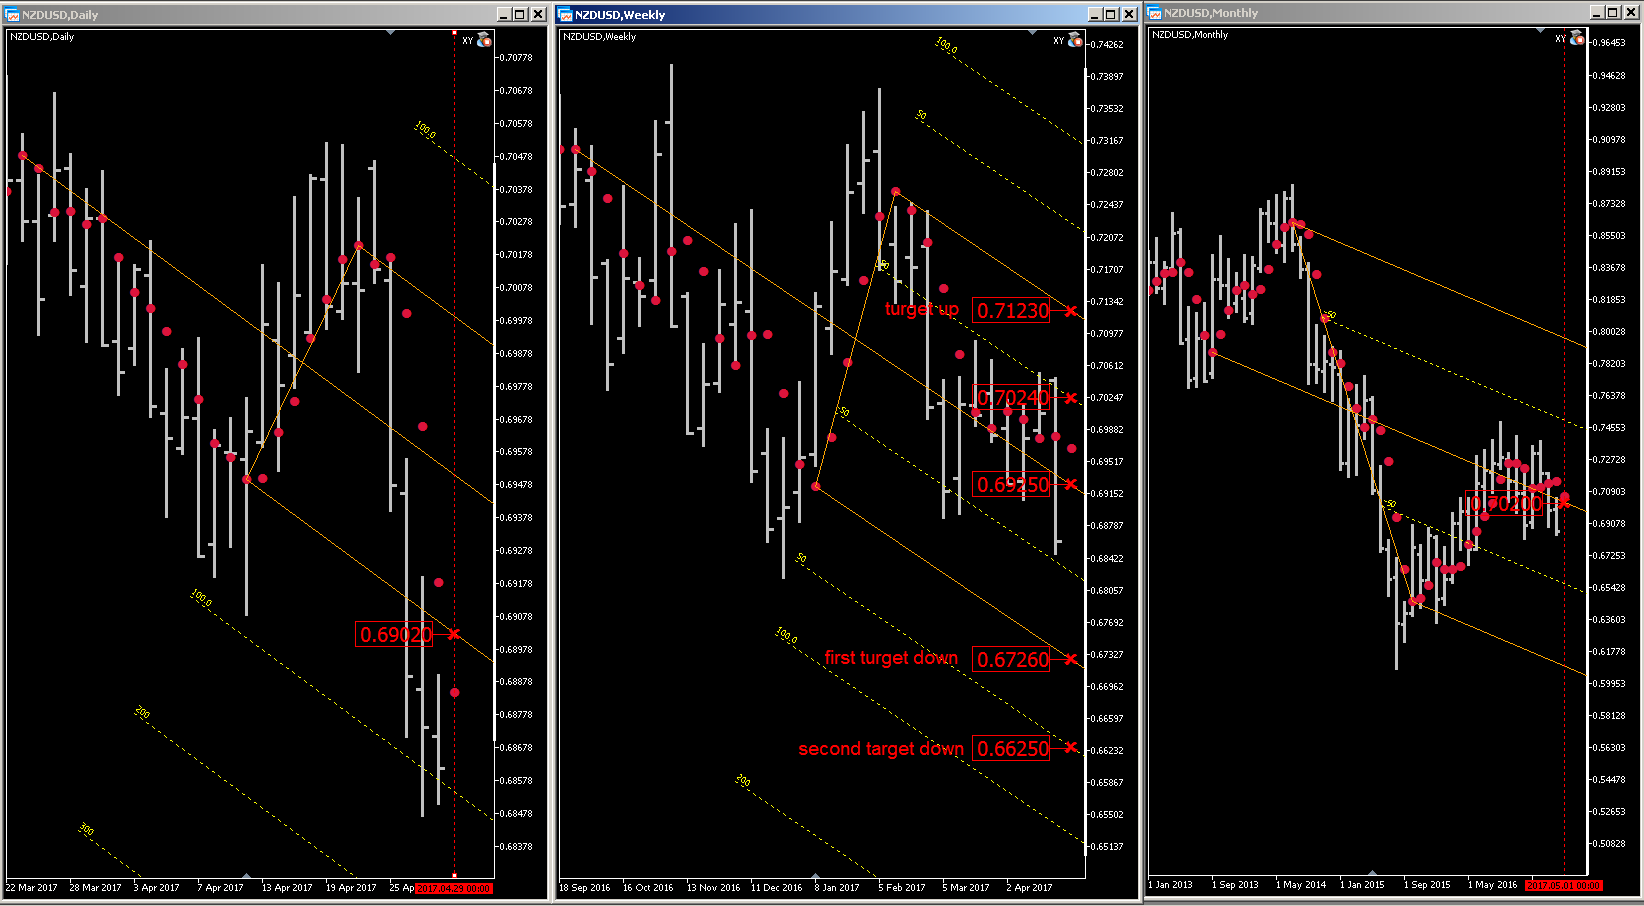
NZDUSD has good trading opportunity next week 05.01 - 05.05 2017. Multi time frame research using my tools (Multi time frame navigation and research tool XY adviser, MA and Andrews Pitchfork) on Monthly and Weekly charts has identified the key level 0.7020 (M), 0.6925 (W), and 0.6902 (D), where the price is highly likely to bounce down to the target down level 0.6726 (W) as first target and 0.6625 (W) as second target, because area 0.7020 (M) - 0.6925(W) is strong resistance zone. Selling in the area 0.6925 (W) - 0.6902 (D) is a good idea. If the price breaks through the key level 0.7024(W) up on daily time frame, the target is 0.7123 (W).

EURJPY trading opportunity 04.24 - 04.28 2017
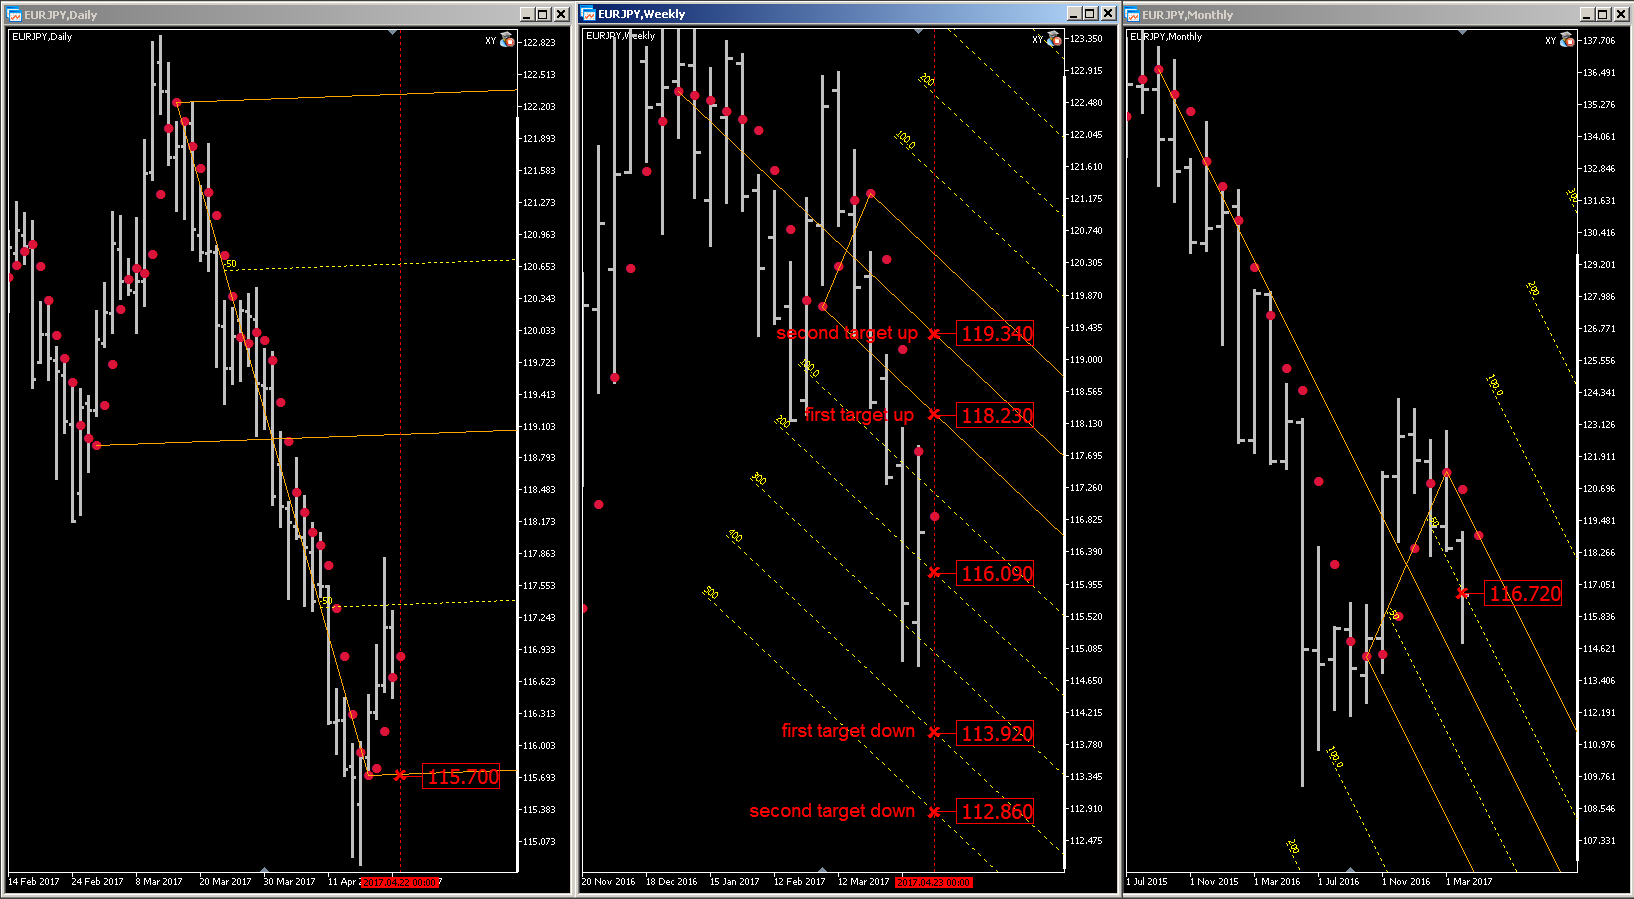
EURJPY has good trading opportunity next week 04.24 - 04.28 2017. Multi time frame research using my tools (Multi time frame navigation and research tool XY adviser, MA and Andrews Pitchfork) on Monthly and Weekly charts has identified the key level 116.72 (M), 116.09 (W) and 115.70 (D), where the price is highly likely to bounce up to the target up level 118.23 (W) as first target and 119.34 (W) as second target, because area 116.72 (M) - 116.09 (W) is strong support zone. Buying in the area 116.09 (W) - 115.70 (D) is a good idea. If the price breaks through the key level 115.70(D) down, the first target is 113.92 (W) and second target is 112.86 (W).
It has been over a year since MQL5 started providing native support for OpenCL. However not many users have seen the true value of using parallel computing in their Expert Advisors, indicators or scripts. This article serves to help you install and set up OpenCL on your computer so that you can try to use this technology in the MetaTrader 5 trading terminal.

This article focuses on some optimization capabilities that open up when at least some consideration is given to the underlying hardware on which the OpenCL kernel is executed. The figures obtained are far from being ceiling values but even they suggest that having the existing resources available here and now (OpenCL API as implemented by the developers of the terminal does not allow to control some parameters important for optimization - particularly, the work group size), the performance gain over the host program execution is very substantial.

In late January 2012, the software development company that stands behind the development of MetaTrader 5 announced native support for OpenCL in MQL5. Using an illustrative example, the article sets forth the programming basics in OpenCL in the MQL5 environment and provides a few examples of the naive optimization of the program for the increase of operating speed.
Multitimeframe navigation and research tool MT4 ( XY expert advisor) is a convenient tool that allows analyzing the trading instruments on different time frames and fast switching between them. Easy to use. It has no adjustable parameters. Charts with an XY Expert Advisor can be either the same symbol (instrument) or different (from version 2.0). When a symbol is changed on one of the charts with the XY expert advisor , cascade change of symbols occurs on other charts with the XY attached. The

The Market Profile was developed by trully brilliant thinker Peter Steidlmayer. He suggested to use the alternative representation of information about "horizontal" and "vertical" market movements that leads to completely different set of models. He assumed that there is an underlying pulse of the market or a fundamental pattern called the cycle of equilibrium and disequilibrium. In this article I will consider Price Histogram — a simplified model of Market Profile, and will describe its implementation in MQL5.

EURUSD trading opportunity 04.17 - 04.21 2017
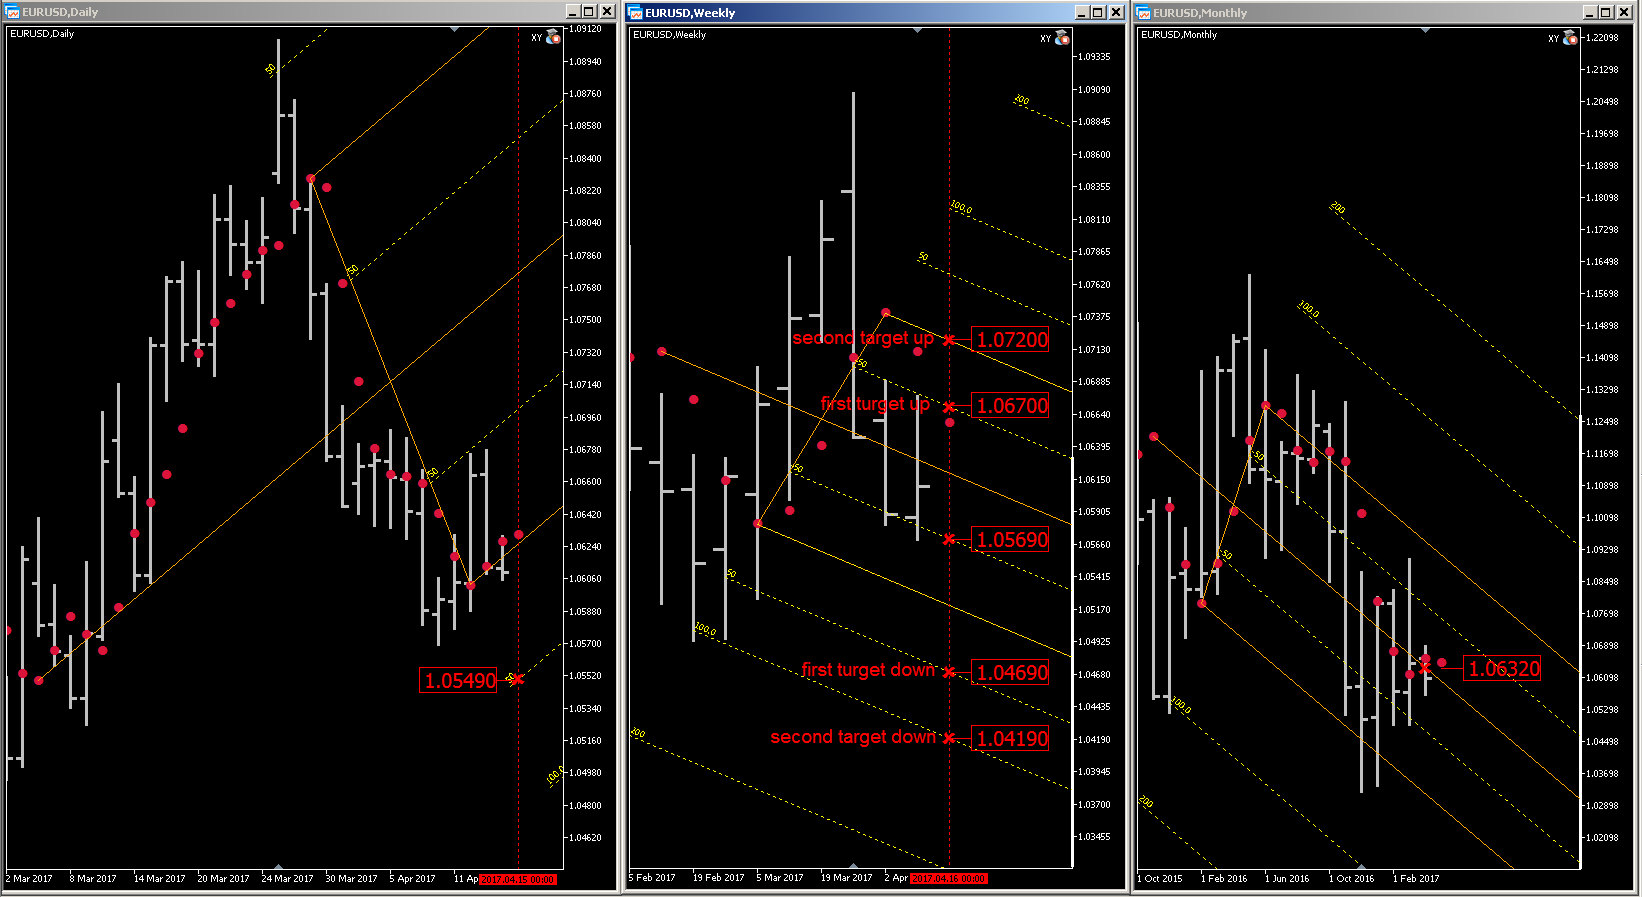
EURUSD has good trading opportunity next week 04.17 - 04.21 2017. Multi time frame research using my tools (XY adviser, MA and Andrews Pitchfork) on Monthly and Weekly charts has identified the key level 1.0632 (M), 1.0569 (W) and 1.0549 (D), where the price is highly likely to bounce up to the target up level 1.0670 (W) as first target and 1.0720 (W) as second target. Buying in the area 1.0569 - 1.0549 is a good idea. If the price breaks through the key level 1.0549 (D) down, the first target is 1.0469 (W) and second target is 1.0419 (W).
Multitimeframe navigation and research tool (XY expert advisor) is a convenient tool that allows analyzing the trading instruments on different time frames and fast switching between them. Easy to use. It has no adjustable parameters. Charts with an XY Expert Advisor can be either the same symbol (instrument) or different (from version 2.0). When a symbol is changed on one of the charts with the XY expert advisor , cascade change of symbols occurs on other charts with the XY

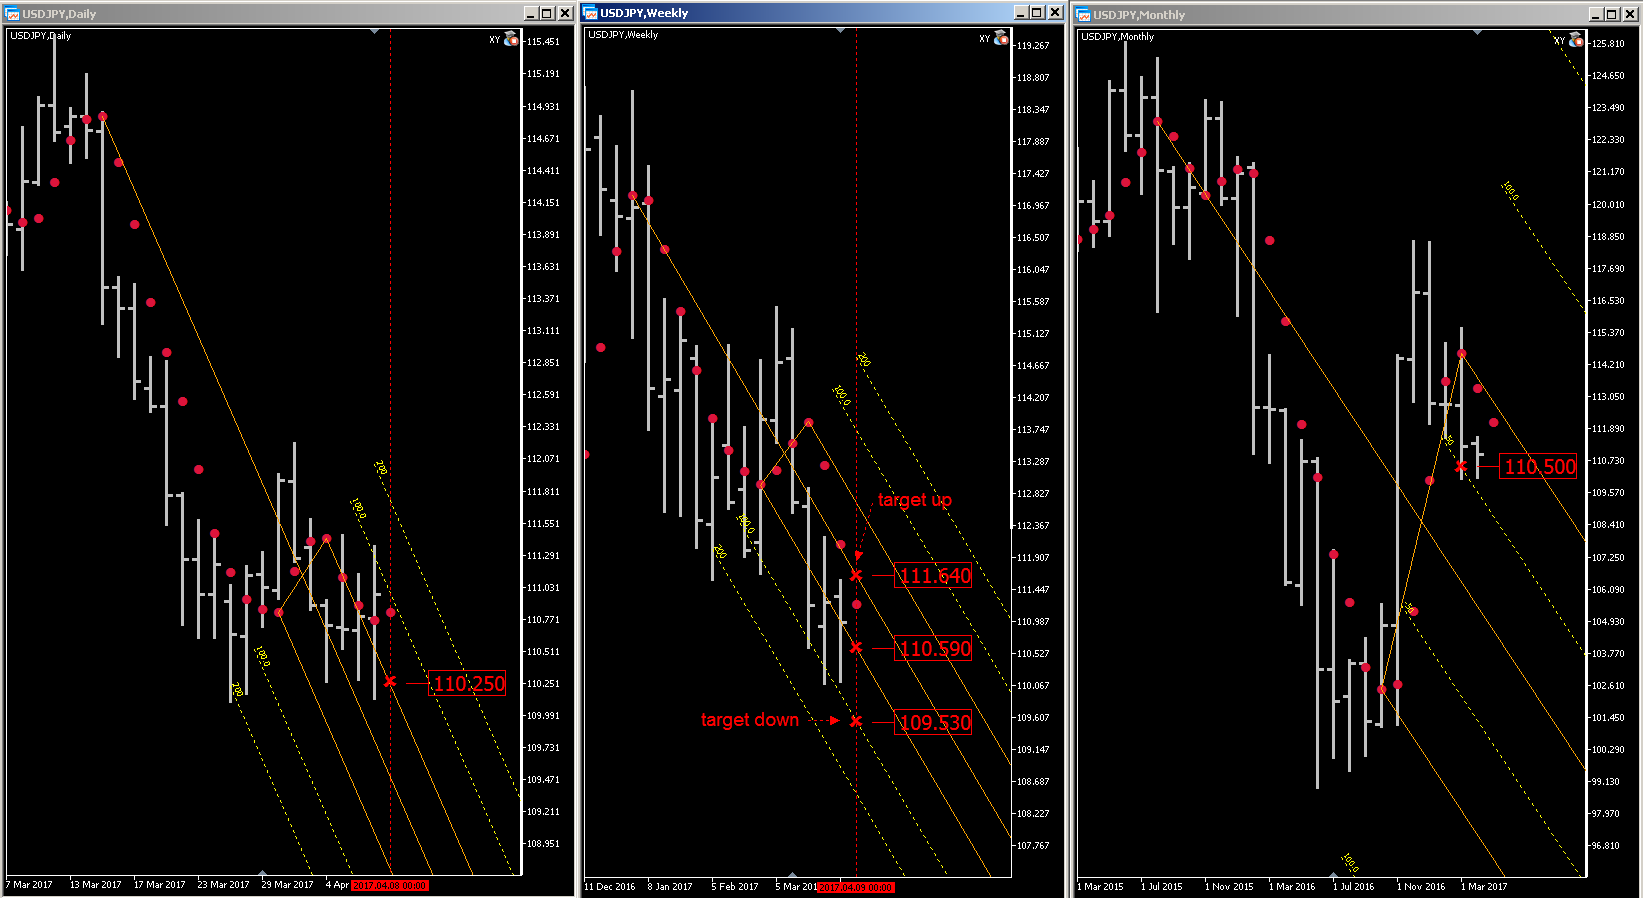
USDJPY trading opportunity 04.10 - 04.14 2017
USDJPY has good trading opportunity next week 04.10 - 04.14 2017. Multi time frame research using my tools (XY adviser, MA and Andrews Pitchfork) on Monthly and Weekly charts has identified the key level 110,50 (M), 110,59 (W) and 110,25 (D), where the price is highly likely to bounce up to the target up level 111,64 (W). Buying in the area 110,59 - 110,25 is a good idea. If the price breaks through the key level 110,25 (D) down, the target is 109,53 (W).
