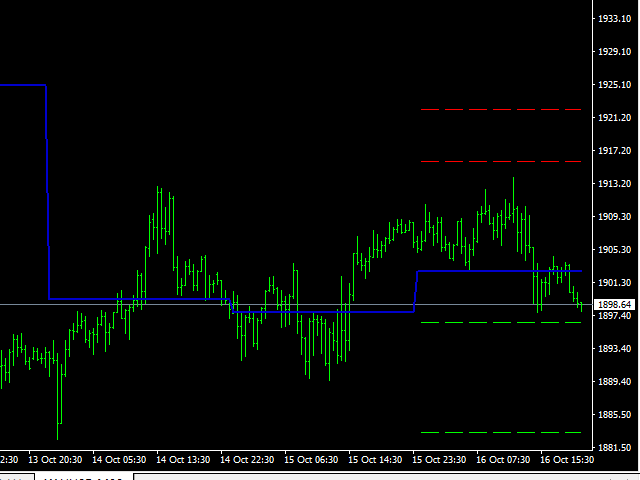
Pivot trading:
1.pp pivot
2. r1 r2 r3, s1 s2 s3
Necessary for traders: tools and indicators
Cooperation QQ:556024"
Cooperation wechat:556024"
Cooperation email:556024@qq.com"
Professional EA indicator writing.
Pivot points have been a trading strategy for a long time, originally used by floor traders. Using this method, you can understand where the market is going in a day through a few simple calculations.
The pivot point in the pivot point method is the turning point of the market direction during the day. A series of points can be obtained by simply calculating the high, low and closing price of the previous day. These points may form key support and resistance lines. The pivot point, support and resistance levels are collectively referred to as the pivot level.
The market you see has an opening price, a high price, a low price, and a closing price every day (some markets open 24 hours, such as the foreign exchange market, which usually uses 5pm EST as the opening and closing time). This information contains all the data you use the pivot method.
The pivot point method is so popular because it can be predicted, not delayed. You can use the data from the previous day to calculate the possible turning point on your trading day (current trading day)
Because there are many traders who trade according to the pivot method, you will find that the market is responsive in these key positions. This gives you a trading opportunity.
Pivot Point is an intraday trading method. It is very simple and practical. It is a very "simple" resistance support system. It is a method invented by a master of futures about 10 years ago. It has been widely used in stocks, futures, government bonds, and indexes. On high-volume commodities. The classic Pivot Point is a 7-point system, which is composed of 7 prices. The currently widely used 13-point system is actually the same, but it adds 6 more prices and is used for large-volume commodities.


Great indicator! Works really well