Backtest Robustness Checker
- Indicators
-
Kazuma Uezono
 MQL5 / MQL4 / Pine Script v6 developer and active trader.
Seller on the MQL5 Market (indicators for MT4/MT5).
Services:
- TradingView Pine Script to MT5/MT4 conversion (bar-by-bar matching, with tester report)
- MT4 to MT5 migration - Version: 1.1
- Activations: 5
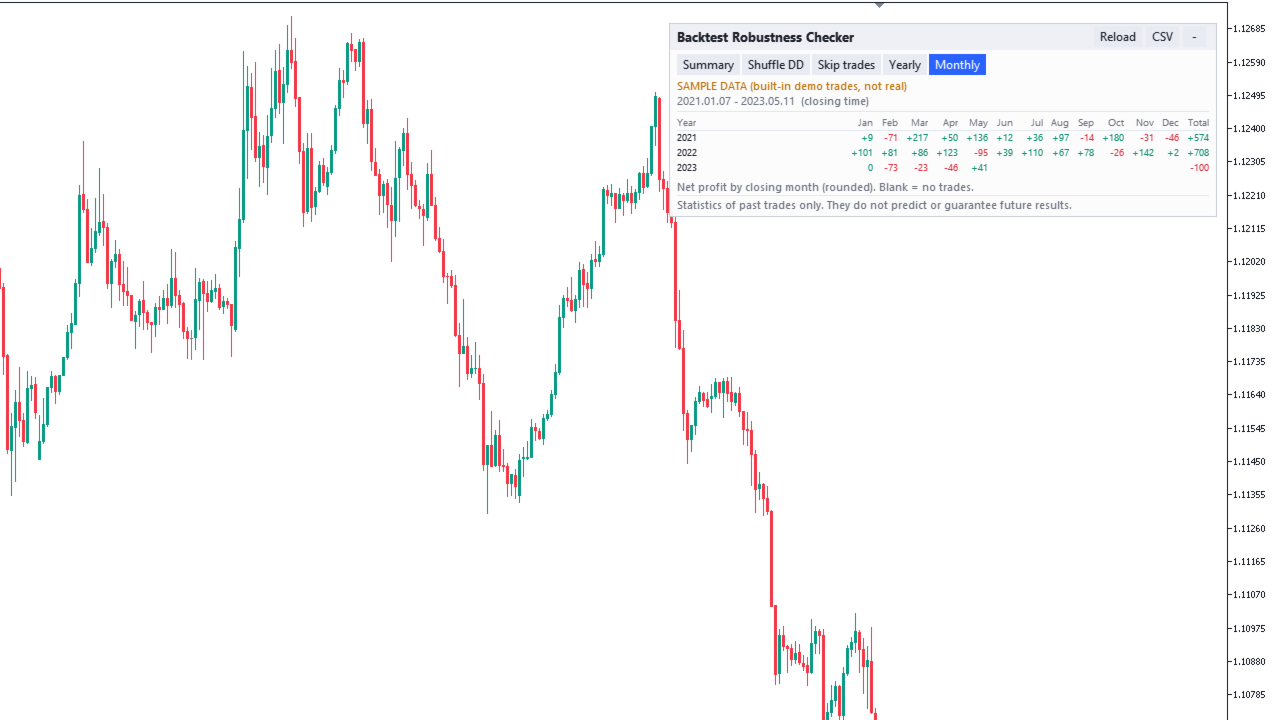
Backtest Robustness Checker is an indicator for MetaTrader 5 that reads a list of your closed trades and shows how the statistics change when the same trades come in a different order, when some trades are missing, or when the largest wins are taken out. The trades can come from your account history, from a Strategy Tester or account report saved as HTML, or from a simple CSV file. The results are shown in a panel on the chart and can be saved as CSV.
It shows statistics of past trades only. It does not predict or guarantee future results, it does not tell you whether a strategy or an EA is good, profitable or "robust", and it gives no pass or fail verdict. A Monte Carlo value such as "95th percentile of max drawdown" describes shuffled copies of your past trades; it is not the probability of a future drawdown. How you use the numbers is your decision.
It is read-only: it never places, modifies or closes orders and gives no buy or sell signals. In the Strategy Tester (and in the automatic check of the Market) there are no trades of your own, so it shows built-in SAMPLE DATA, marked in orange as "not real".
Features
- Three data sources: account history (filter by magic numbers, symbols and closing date), a file in MQL5\Files (an MT5 report saved as HTML, or a CSV), or the built-in sample of 400 demo trades.
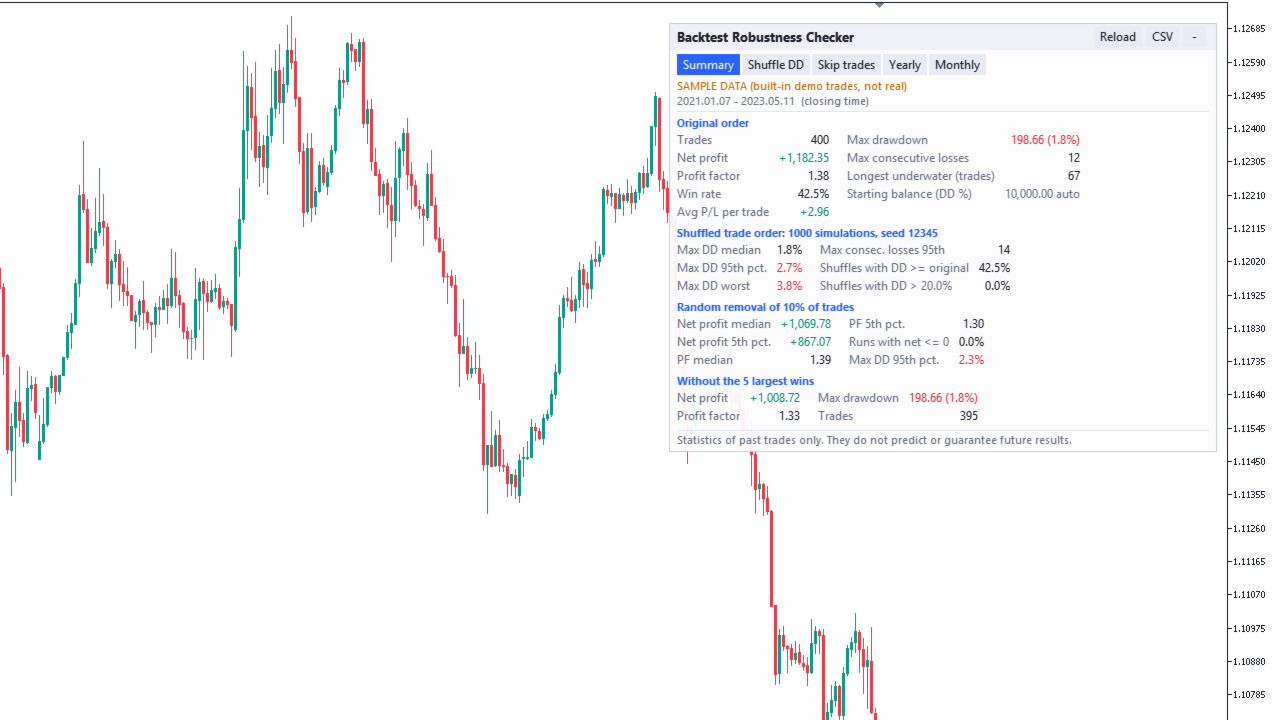
- Original order: trades, net profit, profit factor, win rate, average P/L per trade, max drawdown (amount and %), max consecutive losses, longest underwater period (in trades).
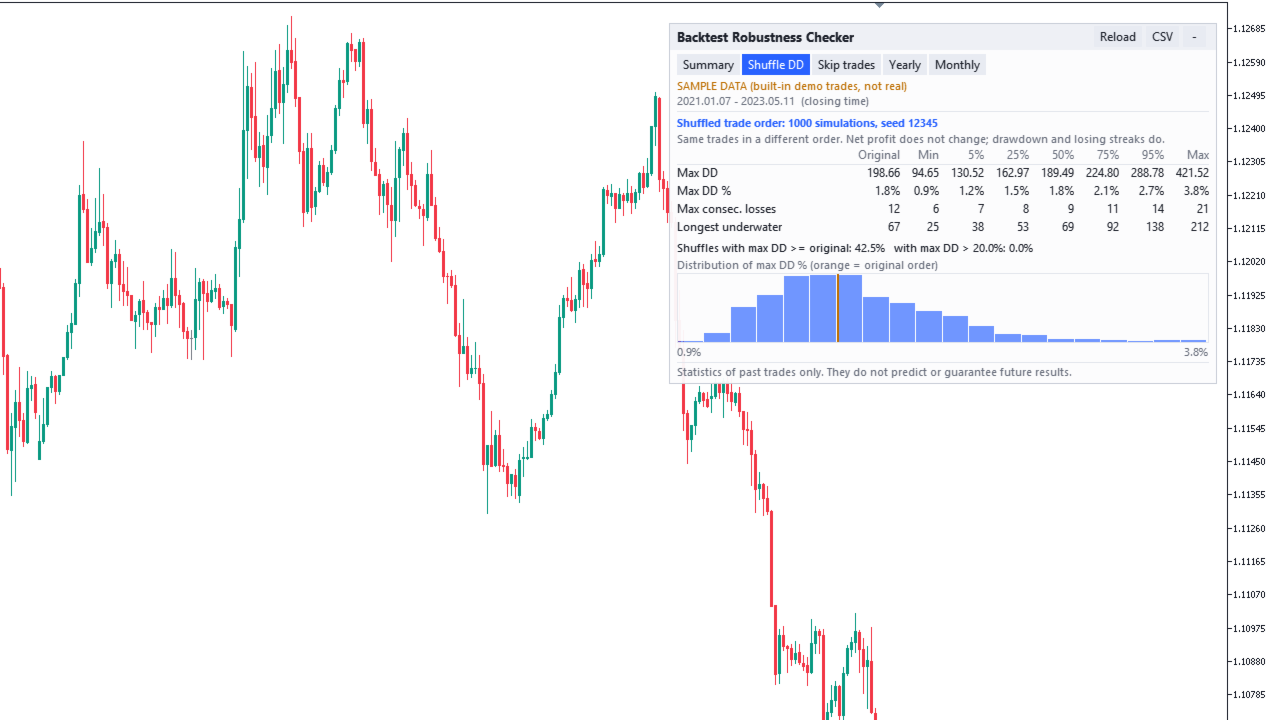
- Shuffled trade order (Monte Carlo): the same trades in random order, repeated (default 1,000 times). Min, 5%, 25%, 50%, 75%, 95% and max of max drawdown, max drawdown %, max consecutive losses and longest underwater; the share of shuffles with a drawdown at least as large as the original; the share above a drawdown % you set; a histogram.
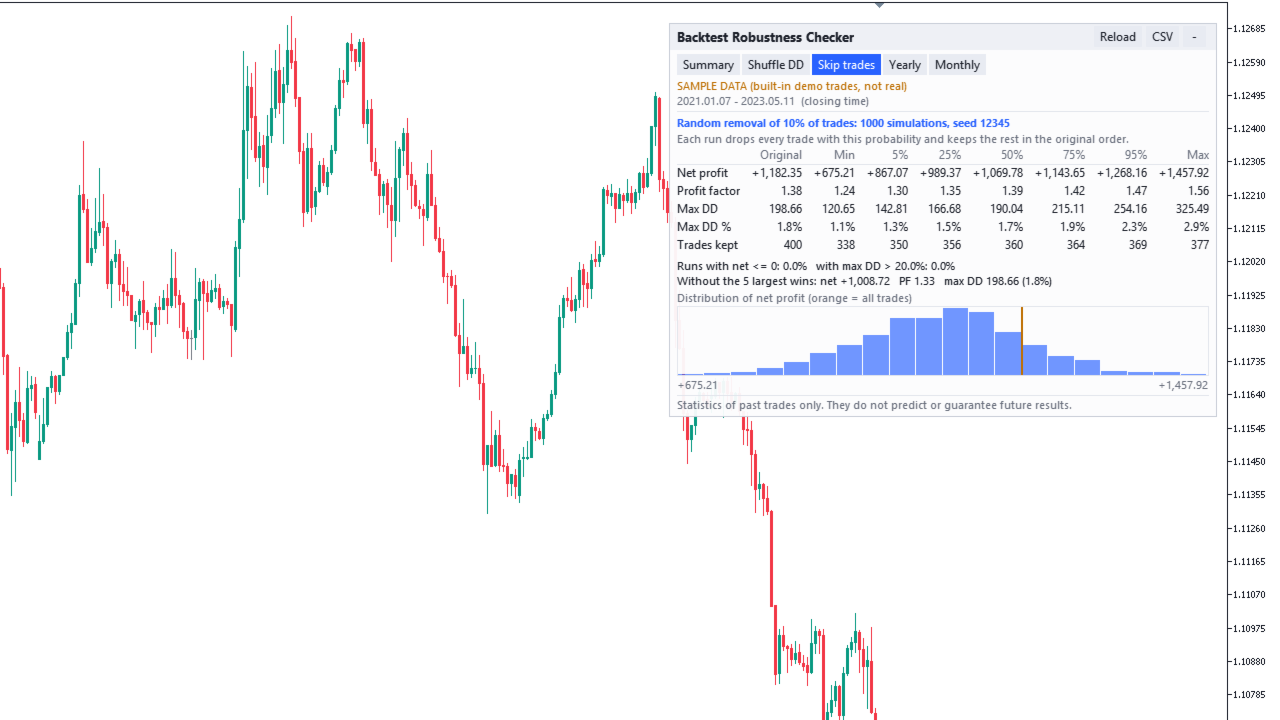
- Random trade removal: each run drops every trade with the probability you set (default 10%) and keeps the rest in the original order. Percentiles of net profit, profit factor, max drawdown and trades kept, the share of runs with net profit <= 0, and a histogram.
- Remove the largest wins: net profit, profit factor and max drawdown without the K largest winning trades (default 5).
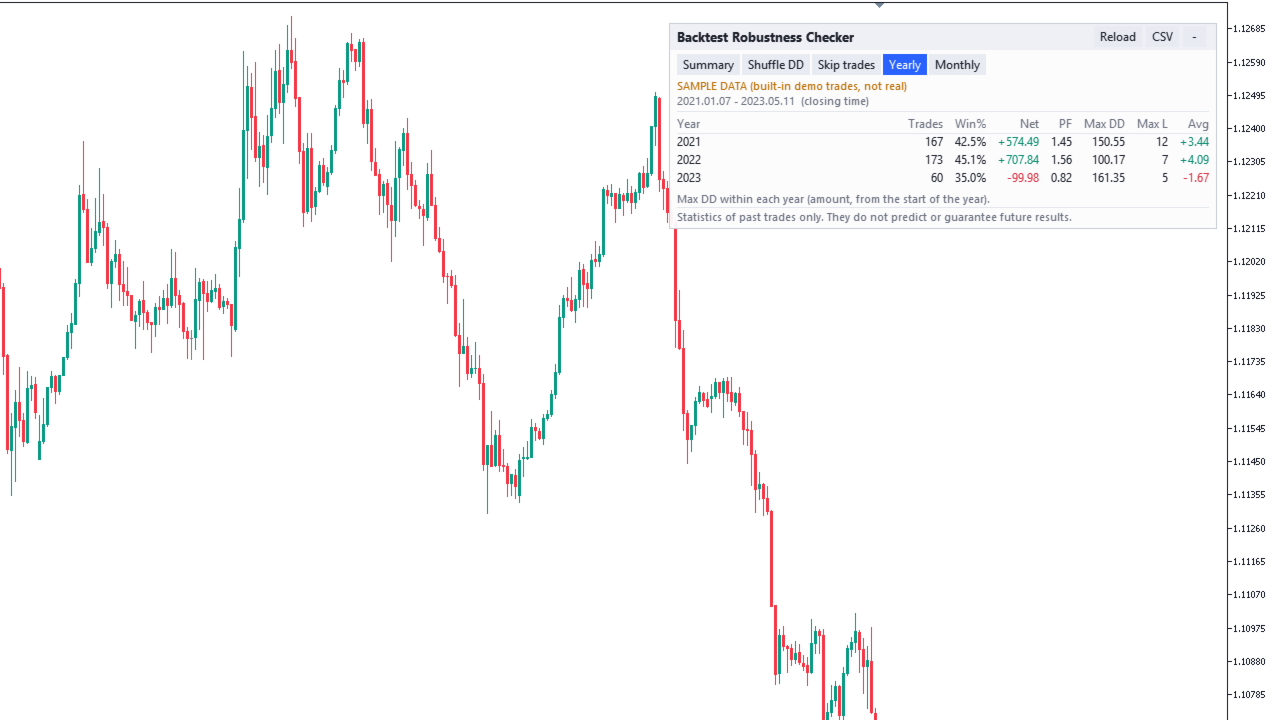
- Yearly table (trades, win %, net, PF, max DD within the year, max losing streak, average) and monthly table of net profit, by closing time. Long tables are split into pages.
- CSV export (button): settings, all statistics, percentiles, yearly and monthly tables, the trade list and, as an option, one row per simulation. Saved in MQL5\Files.
- Fixed random seed: the same data, settings and seed always give the same result.
- Panel in English or Japanese (automatic from the terminal language), light or dark colors from the chart background, any corner, three sizes, collapsible. Several copies on one chart are stacked.
Main Inputs
- Trades to analyze: data source; account: magic numbers, symbols, closed from / until, include commission, fees and swap; file: name in MQL5\Files, read from the common Files folder; starting balance for DD % (0 = automatic).
- Simulation: number of simulations (10-100000, default 1000), random seed (default 12345), share of trades removed (1-90 %, default 10), number of largest wins removed (0-1000, default 5), count simulations with max DD above this % (default 20, 0 = off).
- Panel: page shown first, rows per page, language, corner, offsets, size, colors, start collapsed, CSV button, CSV with one row per simulation, recalculate when new trades close.
- 27 inputs in 4 groups.
How It Is Calculated
- Profit of a trade = profit + commission and fees + swap (for account history, costs can be excluded). A trade is a win or a loss when it is more than half of the smallest currency unit away from zero (files and sample: 0.005), otherwise it is break-even. Profit factor = gross profit / gross loss.
- Balance curve = starting balance + cumulative P/L of the trades in closing order. Max drawdown = the largest fall from a previous high; max drawdown % = that fall divided by the balance at the high. Open positions and floating P/L are not included.
- Starting balance (automatic): account history = the account balance just before the first selected trade closed; HTML = the balance rows before the first trade; sample = 10,000. Deposits and withdrawals after the first trade are not added to the curve, so the DD % denominator does not include them. The input "Starting balance for DD %" overrides the automatic value.
- Account history: one trade = one position (partial closes belong to the same trade, a Close By of two positions is one trade, a netting reversal is split).
- HTML report: one trade = one closing deal (out, in/out, out by) in the Deals table. Each partial close counts as a separate trade, so the number of trades, win rate and PF can differ slightly from the account history of the same trades. A report has no position IDs, so each closing deal is matched to open volume by a rule (same symbol, opposite side; the oldest open deal with exactly the same remaining volume, otherwise first in, first out). With hedged positions of different volumes this matching is an estimate, and so is the share of opening commission and swap given to each trade. The totals are exact.
- CSV: one line per trade, "time,profit" (comma, semicolon or tab; time as YYYY.MM.DD HH:MM or YYYY.MM.DD HH:MM:SS, "-" or "/" also accepted), or a single profit column (then no yearly or monthly tables). Decimal point "." only, no thousands separators. Lines are used in the order of the file. A first line that cannot be read is treated as a header; other unreadable lines are counted as skipped rows; lines starting with # are ignored. A CSV has no balance: set the starting balance in the inputs to see DD %.
- If the starting balance is unknown, the panel shows "unknown" and no DD % values are calculated. Amounts are still shown.
- Shuffle: Fisher-Yates from the original order each time. Removal: one random number per trade. Random numbers: splitmix64 from the seed (removal uses seed + 1). Percentiles: linear interpolation.
- Work limit: simulations x trades is kept at or below 100 million per simulation type. Above that, the number of simulations is reduced automatically (at least 10) and the panel says so. For example, 50,000 trades are run with 2,000 simulations. Large runs are calculated in steps with a progress line, so the chart does not freeze.
Notes and Limits
- Statistics of past trades only. They are not a forecast, a guarantee, a pass / fail test of a strategy, a trading signal or advice.
- The shuffle and the removal treat every trade as a fixed amount that does not depend on the other trades. For systems where trades depend on each other or on the balance (for example grid, martingale, averaging, or lot size that grows with the balance), the simulated results can be far from what such a system could actually do.
- A backtest result depends on the test settings (period, symbol, spread, commission, tick model). This tool only reads the result you give it and does not check how the test was made.
- .xlsx (Open XML / Excel) reports cannot be read. Save the report as HTML, or use CSV. Files larger than 64 MB are not read, and at most 2,000,000 trades are used.
- Only files inside MQL5\Files (or the common Files folder) can be read. The file name must not contain ".." or ":".
- MT5's default report names contain the account number (for example ReportTester-12345678.html). The panel and the exported CSV show the file name, so rename the file before you take screenshots or share the CSV.
- Yearly and monthly tables use the closing time as written in the data (server time for MT5 reports and history).
- In the Strategy Tester the source "Account history" has no trades of your own, so SAMPLE DATA is shown, and the CSV button is hidden. Use it on a normal chart for your own data.
Compatibility and Support
- MetaTrader 5 only. Hedging and netting accounts, any symbol and timeframe (the chart symbol does not matter).
- No DLLs, no internet access. It writes a file only when you press the CSV button.
- Support through MQL5 messages, reply within 3 business days: installation, settings, loading files and bug reports. We cannot judge whether your strategy or EA is good, read your results as advice, give market views or make trade decisions for you.
- No result of your trading is promised or implied.