Multi Timeframe Signal Workshop MT4
- Indicators
-
George Ciprian Mandache
 Mostly writing code that does stuff...
User guides are on my blog. For questions or bugs, write in the product's Comments tab or send me a message. - Version: 1.0
- Activations: 5
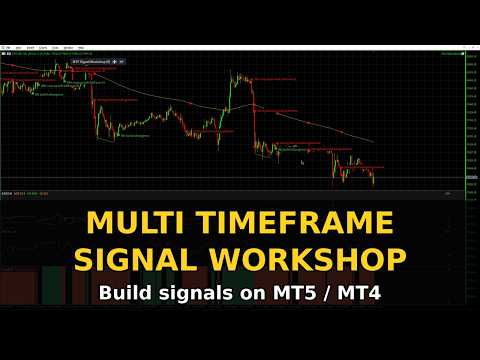
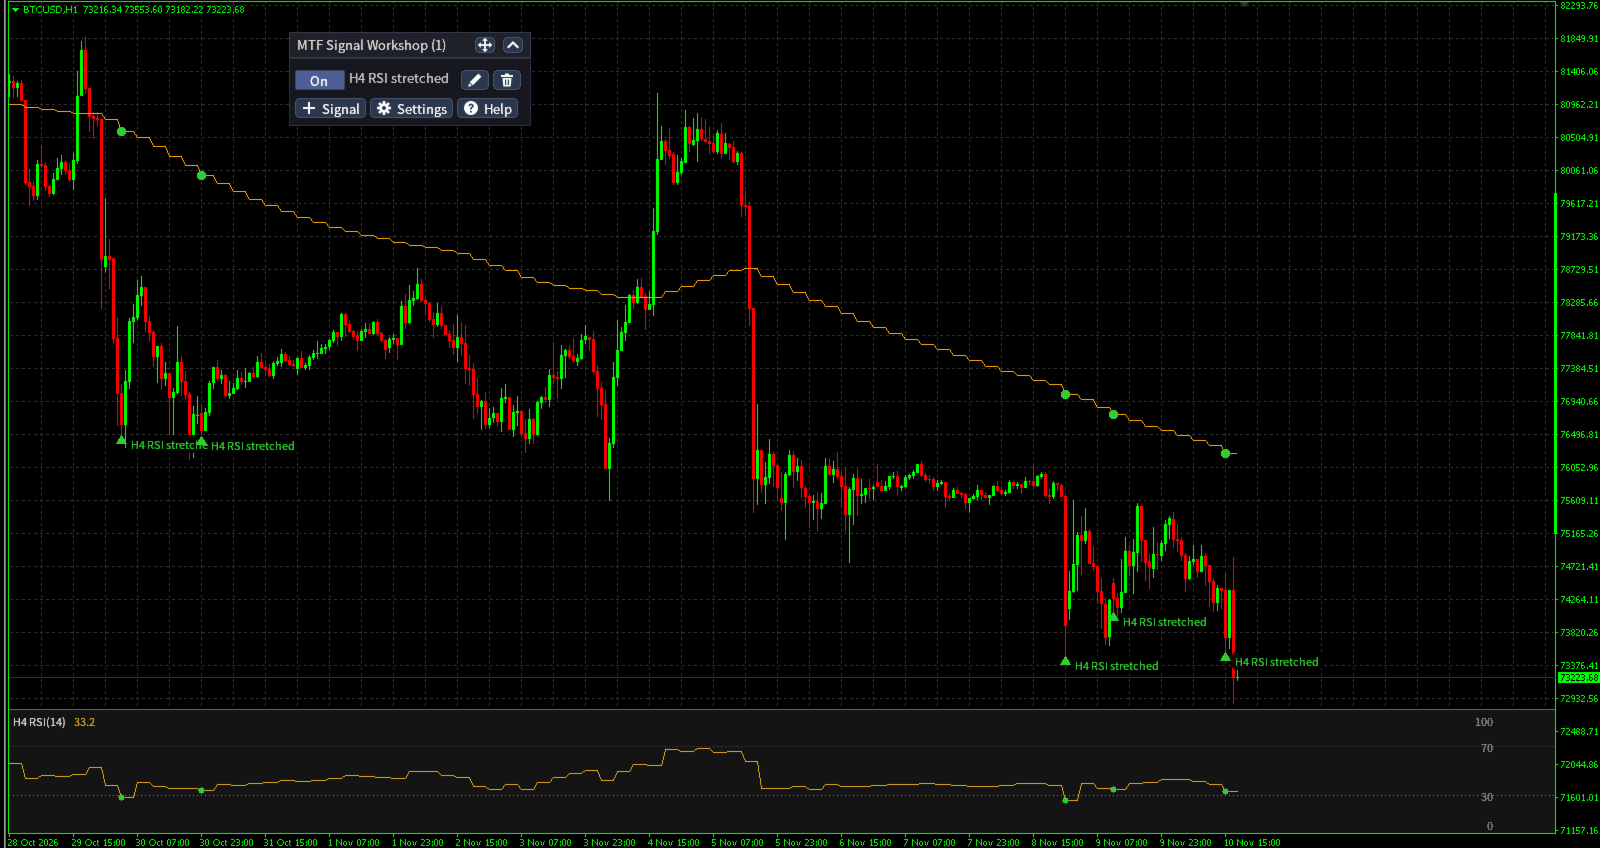
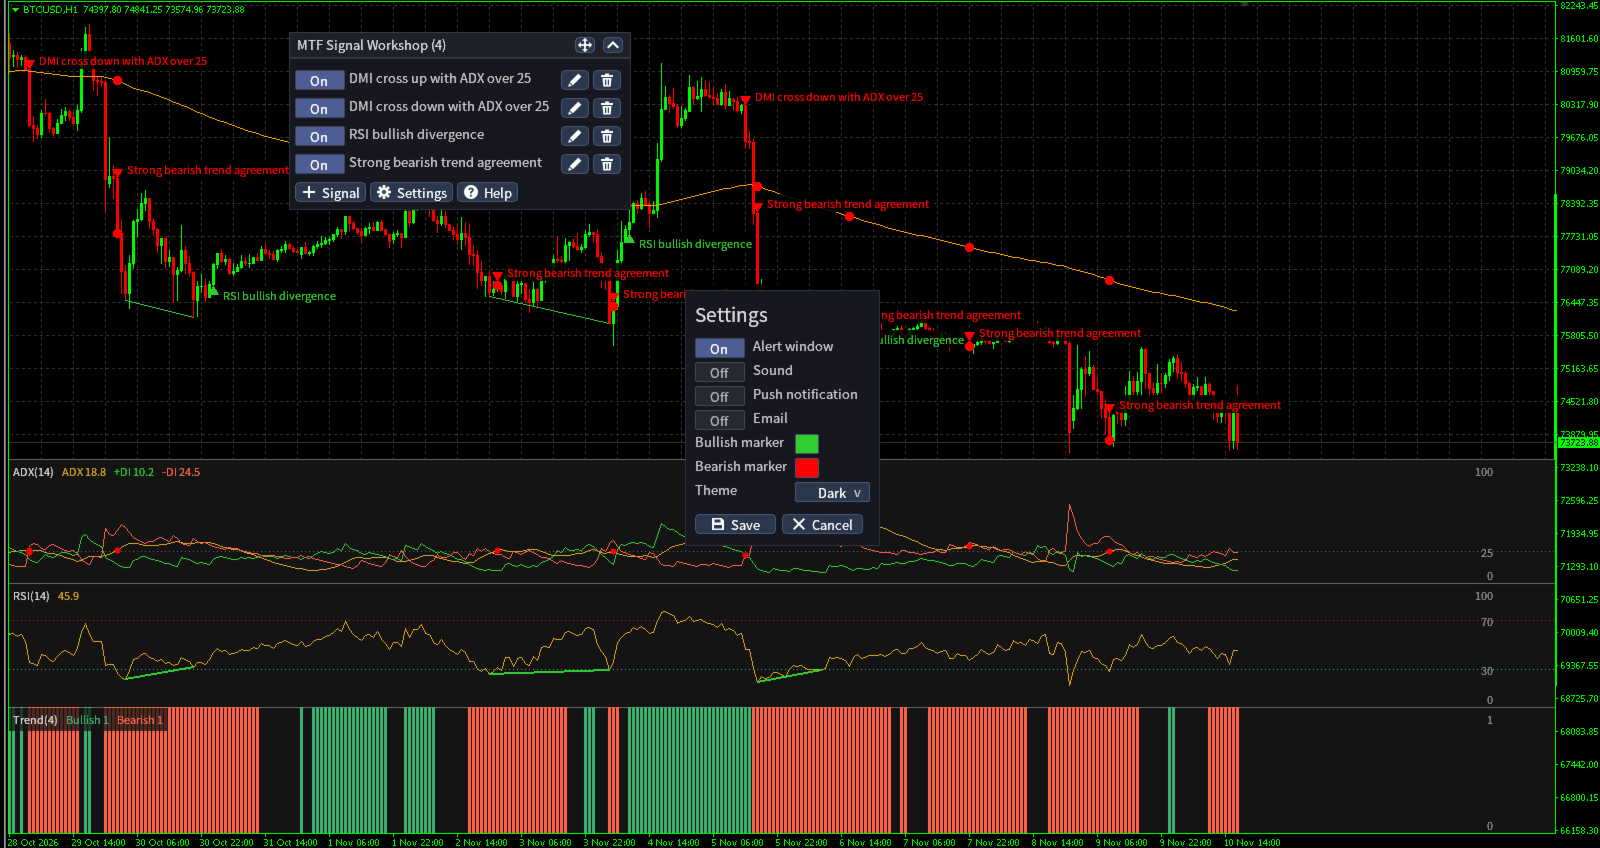
Multi Timeframe Signal Workshop is an indicator for MetaTrader 4 that watches signals you build from indicators on any timeframe and marks every bar where one fires. A signal such as "H4 RSI oversold while price is above the daily EMA 200" is built by clicks, with no code, and each firing is drawn on the chart with the zones, lines and indicator values it read. It comes with 36 ready-made signals and alerts you when a new firing appears.
Launch price: 49 USD for the first 10 copies, then 79 USD.
What it does
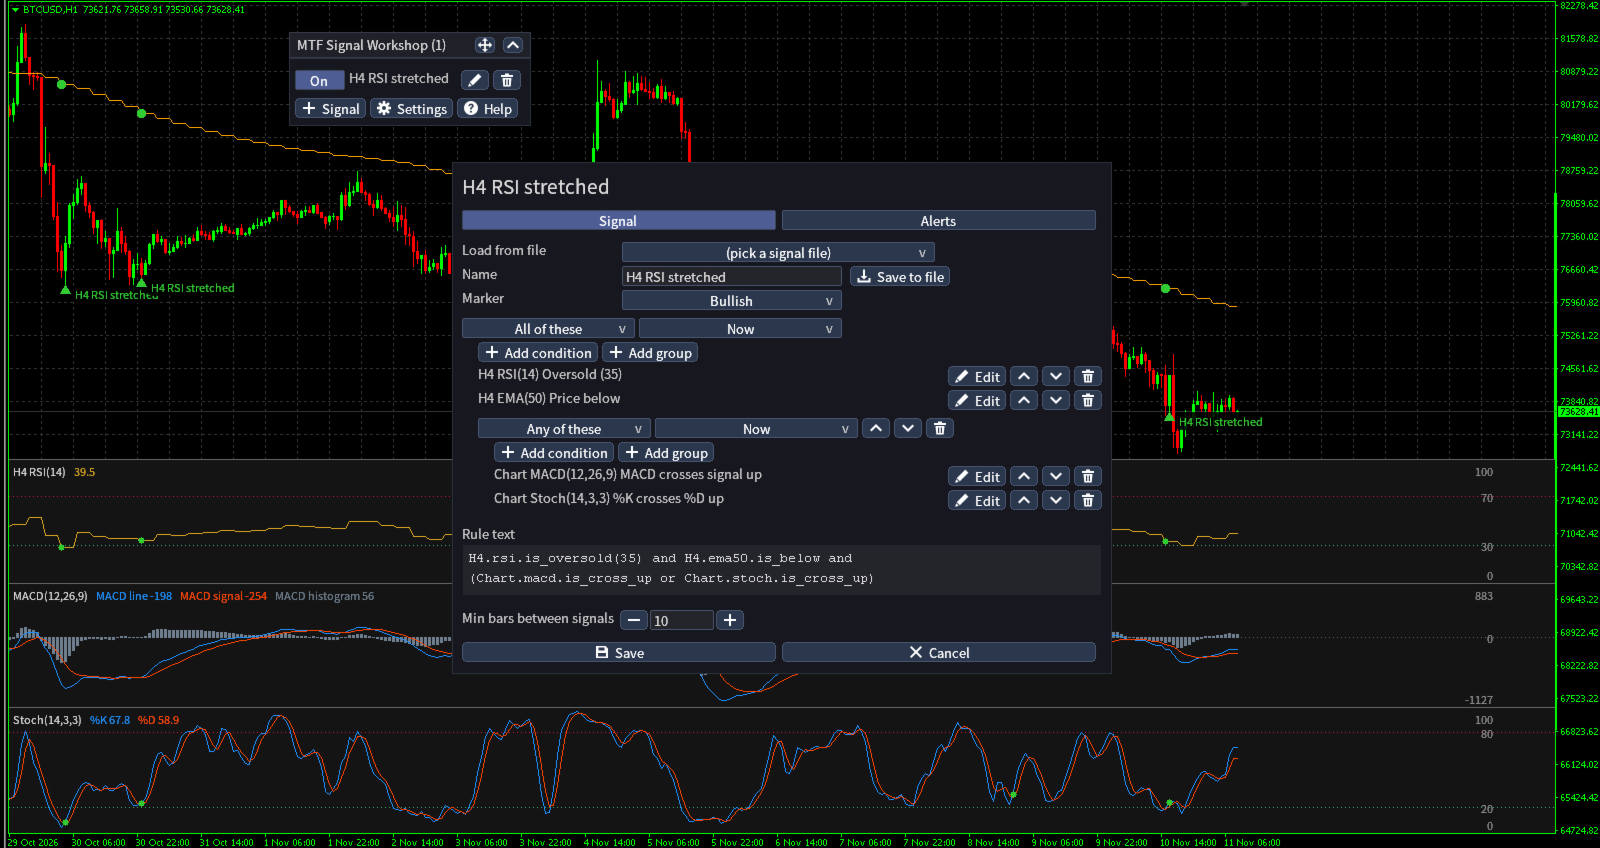
- Signals by clicks. Pick a timeframe, an indicator with its own settings (an RSI's period, the Bollinger Bands' deviations) and what to test (oversold, a cross, a divergence, price inside a zone, a line above another), and when it must have held. Conditions join in groups: all of these, any of these, or at least a number of them.
- Any timeframe in one signal. One condition can read H4, the next D1, another the chart's own timeframe.
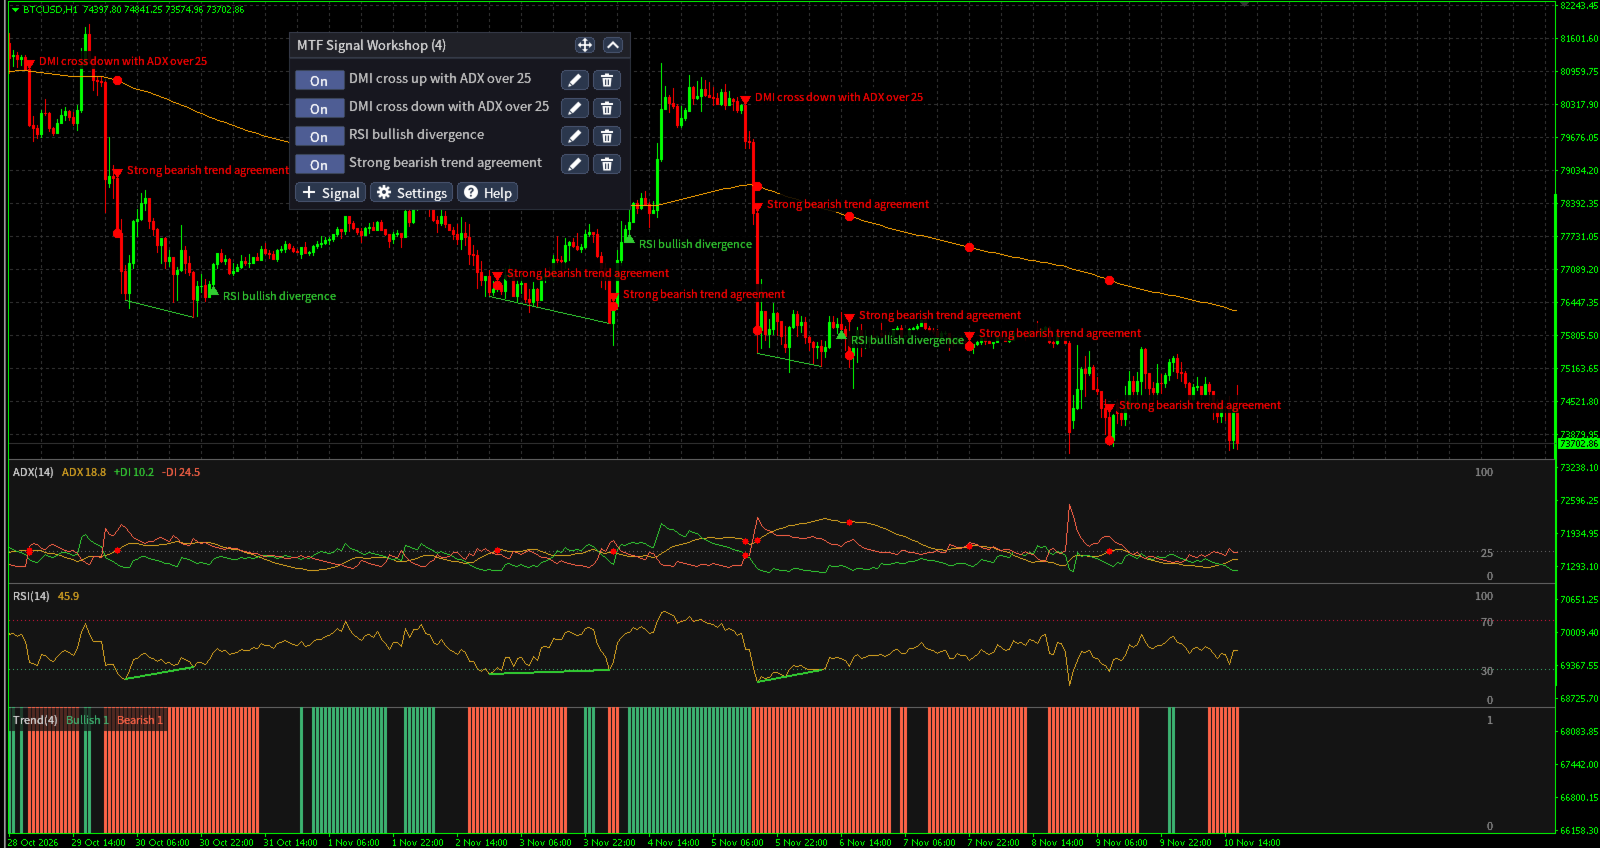
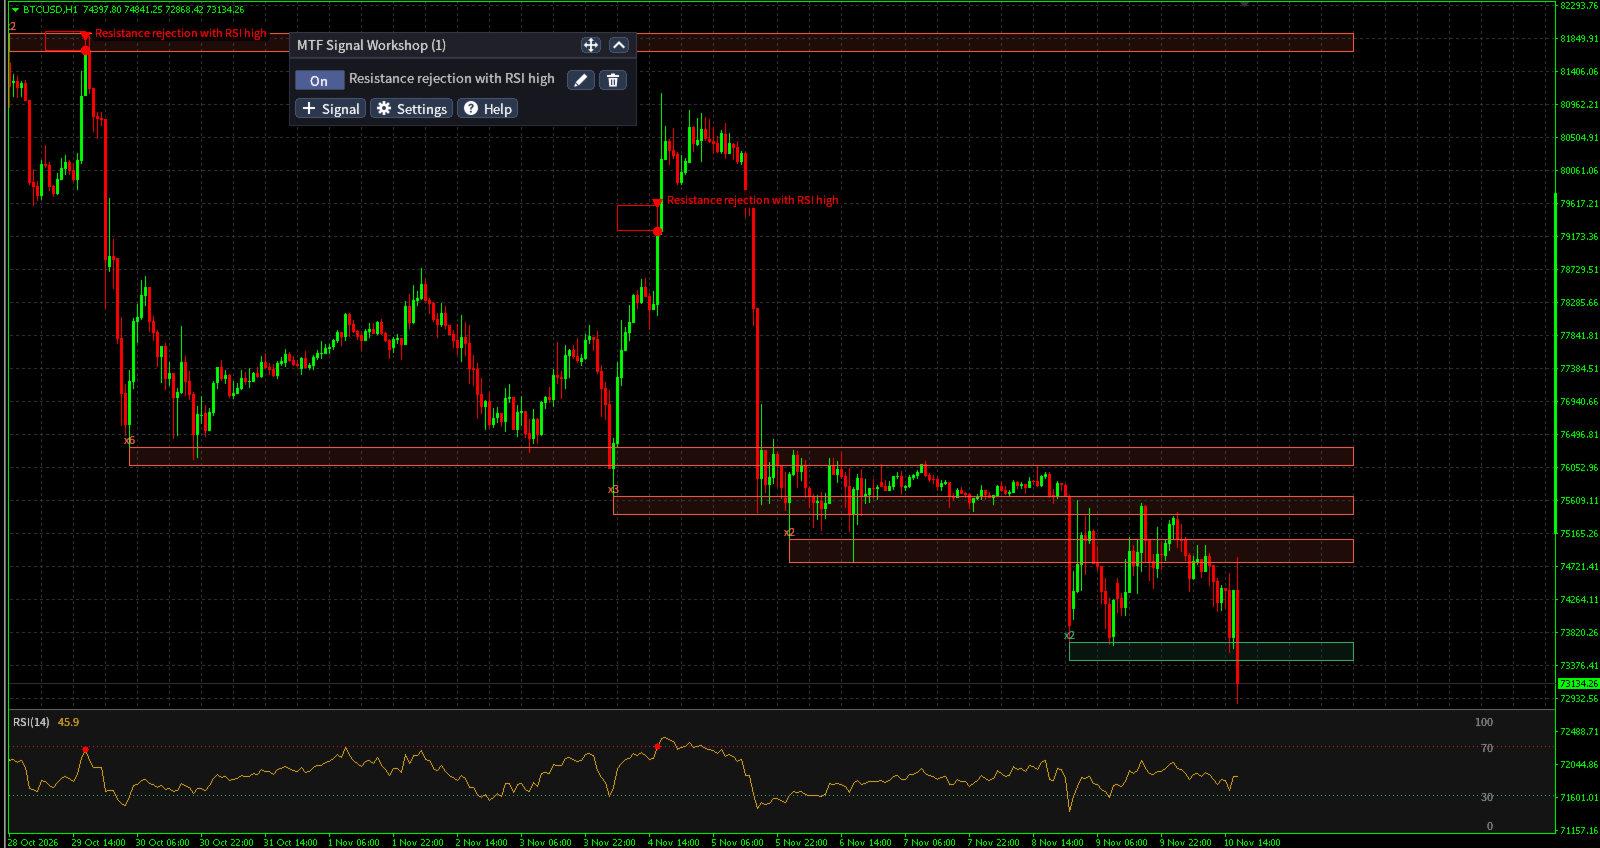
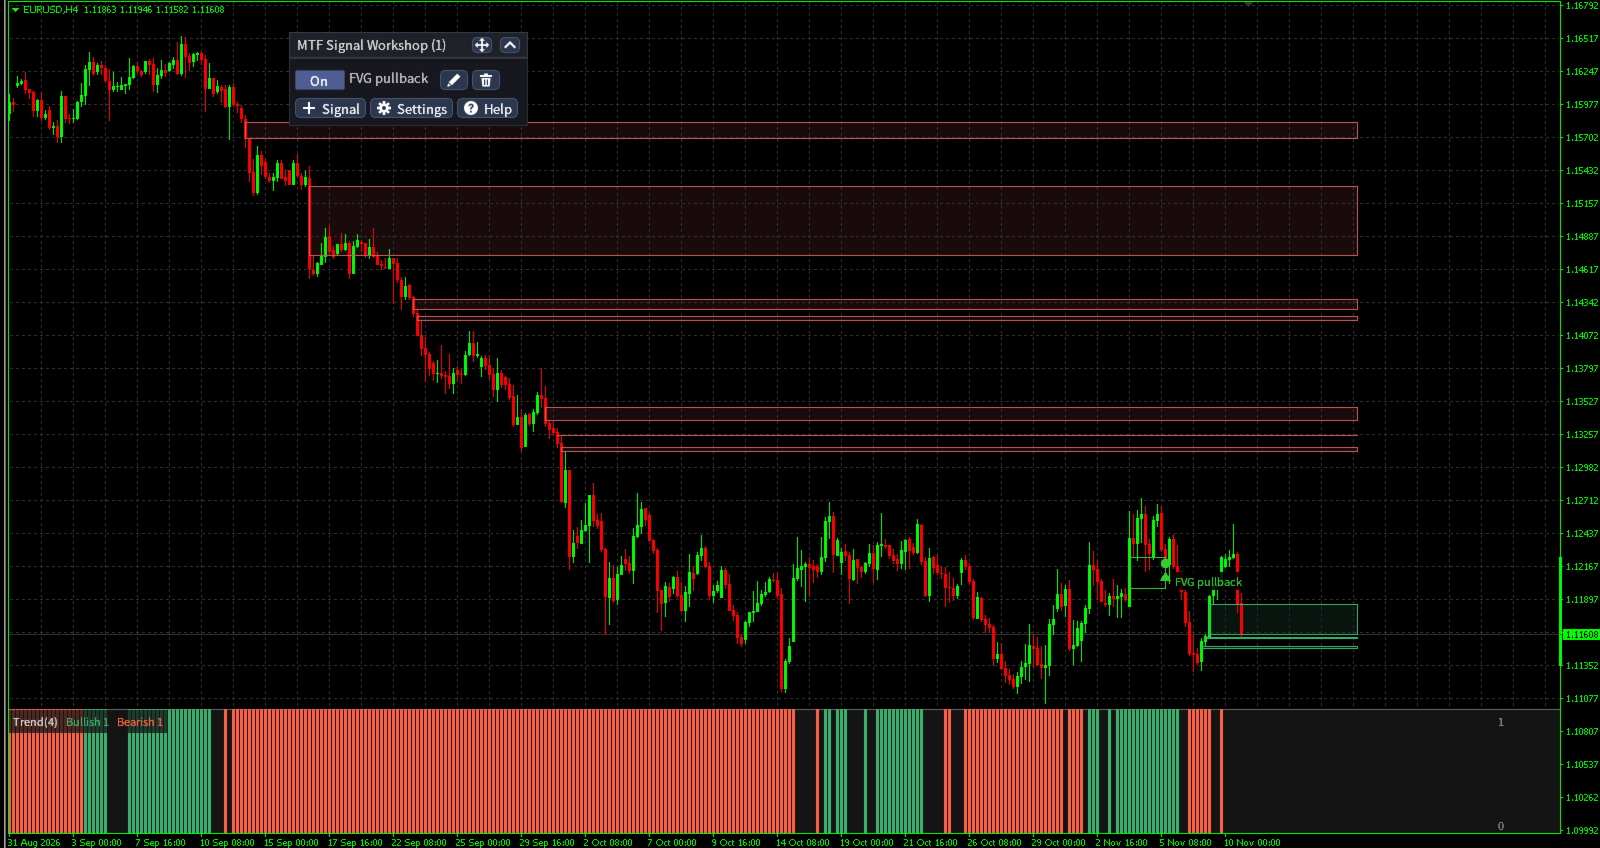
- Marked on the chart. Every firing gets an arrow with the signal's name beside it, and where names of nearby firings meet, the newer one is drawn on top. What held is drawn with it: a dot where lines crossed, a line between a divergence's pivots, the zone or level it read.
- Indicators drawn for you. The indicators a signal names are drawn over the candles or in docks under them. Nothing else needs to be installed. A Markers only setting leaves them out.
- Alerts. A new firing alerts through the Alert window, a sound, a push notification or an email, for every signal or each on its own settings.
- Signals as text files. Save to file writes a signal as a plain text file, and Load from file puts any signal file on a chart. Write or change one in Notepad or any text editor, copy it to another terminal or send it to someone. Charts reload a changed file within seconds.
- 36 ready-made signals on oscillators, bands, the trend vote, support and resistance, supply and demand, Fibonacci, order blocks, fair value gaps and market structure, most in bullish and bearish pairs.
Indicators a signal can use
- Price and moving averages: the close, SMA and EMA of any period.
- Bands and channels: Bollinger Bands with the squeeze, Keltner Channels and Donchian Channels.
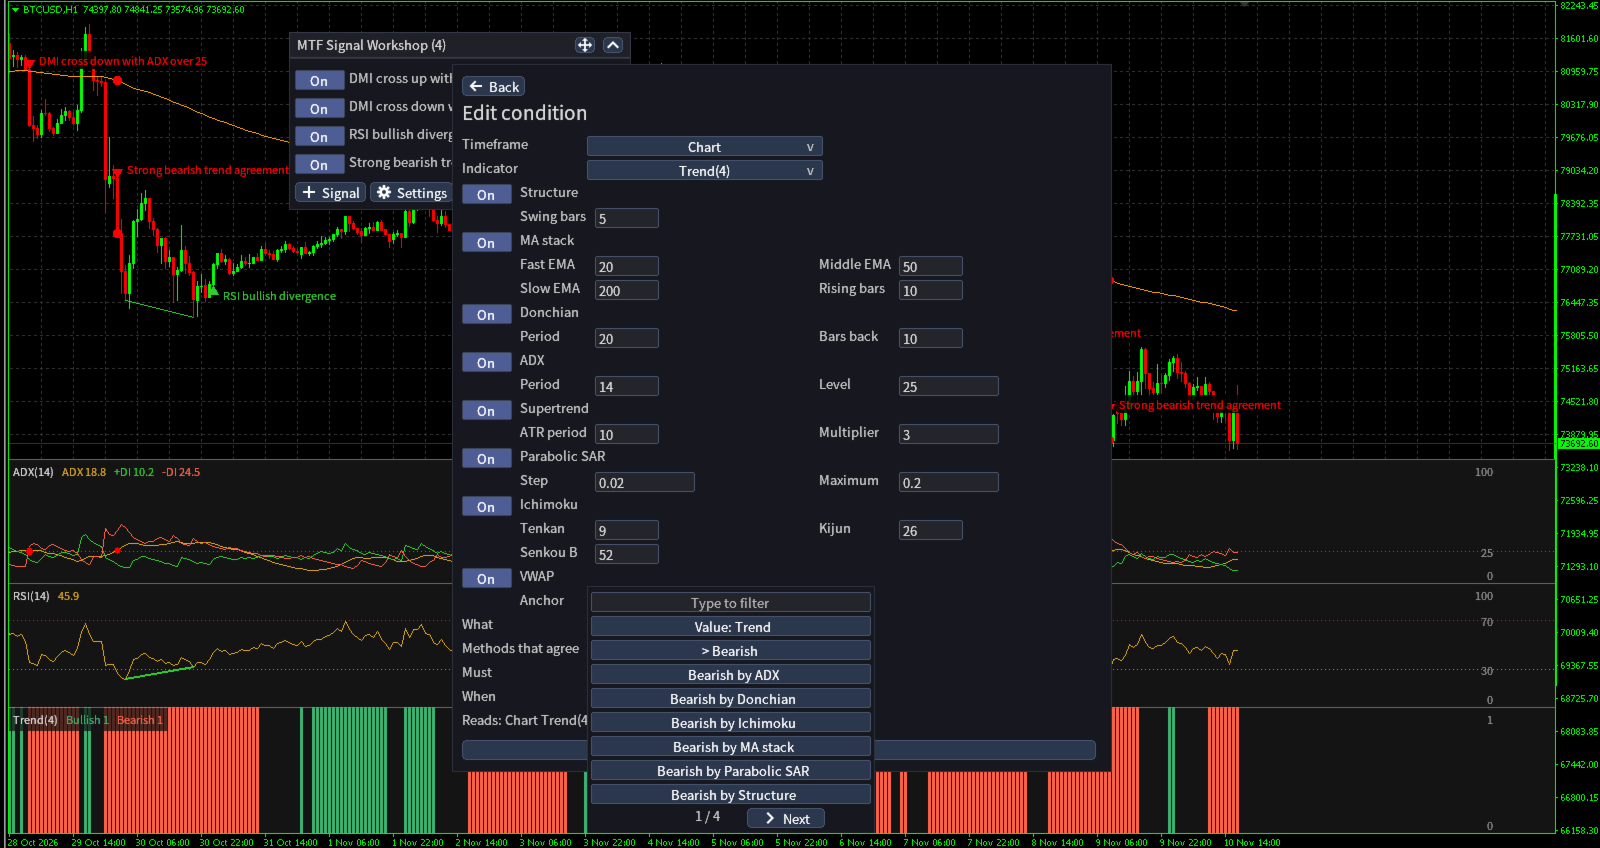
- Trend: Supertrend, Parabolic SAR, Ichimoku, ADX with +DI and -DI, and the Trend vote of eight methods (structure, MA stack, Donchian, ADX, Supertrend, Parabolic SAR, Ichimoku, VWAP), each method also on its own.
- Smart money concepts: Market structure (BOS and CHoCH), Order blocks (with the liquidity sweep, the displacement and its fair value gap) and FVG.
- Levels and zones: Swings (HH, LH, HL and LL), Fib (levels, the golden pocket, the optimal trade entry), S/R and Supply/Demand. Every zone reads as inside, touched, near or broken, and distances are in ATR, so a signal means the same on any symbol.
- Oscillators: RSI, Stochastic, quad stochastic, Stochastic RSI, MACD, CCI, Williams %R and MFI, with regular and hidden divergences.
- Volatility and volume: ATR and tick volume, each against its average, and OBV with its divergences.
The rule language
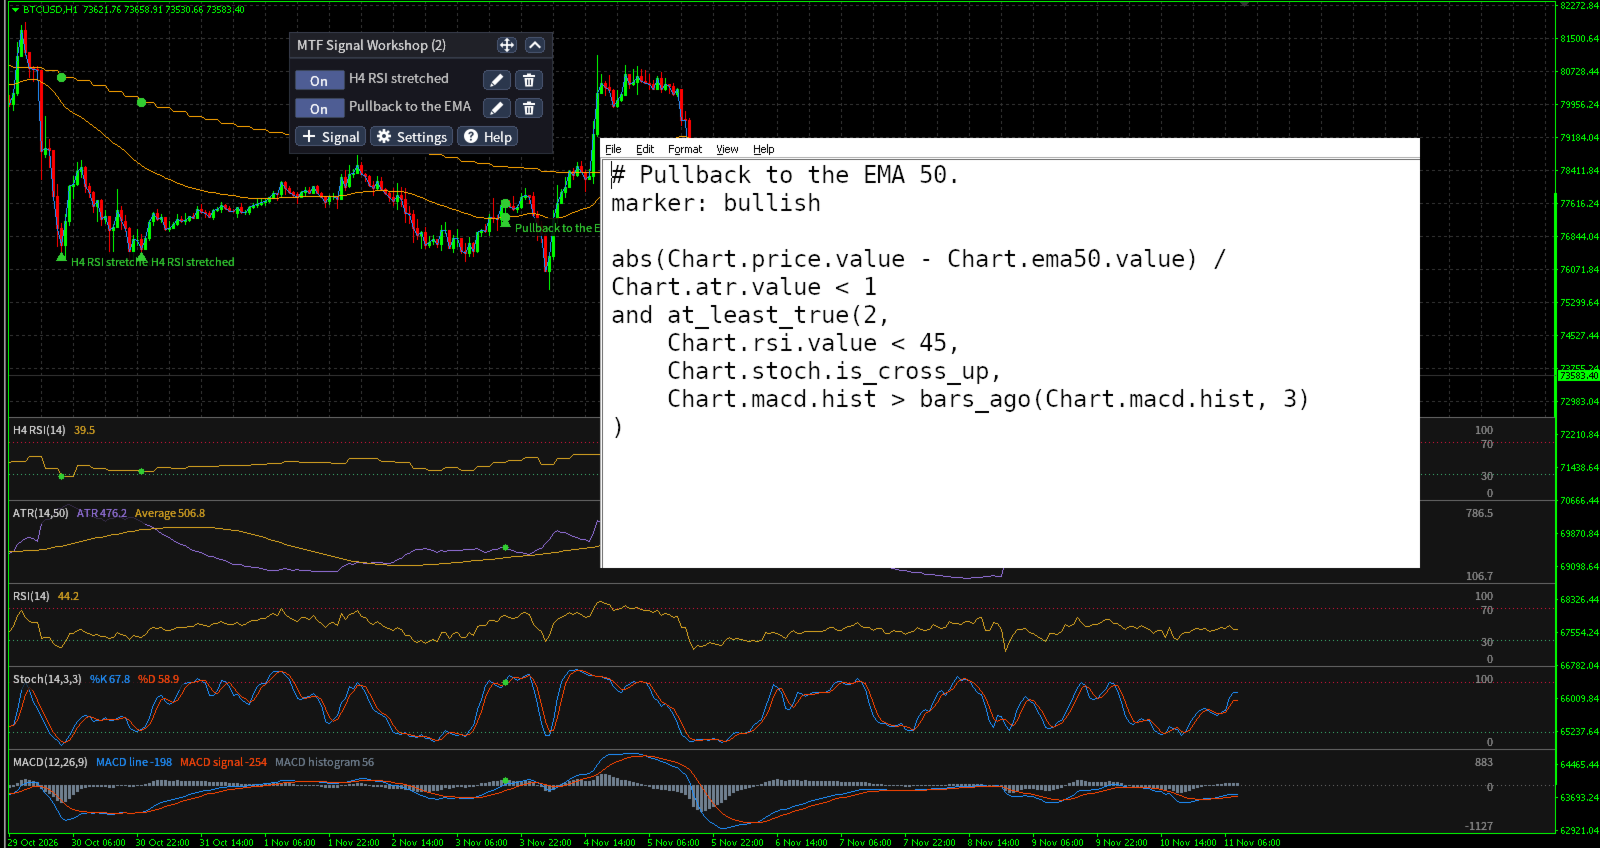
Every signal is a rule in one readable language. The cards write it for you and show it under them as Rule text; a signal file takes it as you type it, over as many lines as you like, with # comments and a marker: bullish or marker: bearish line.
- Names: timeframe, indicator and field, such as H4.rsi.value, D1.ema200.is_above or Chart.bb.upper. Chart follows the chart's own timeframe.
- Indicator settings: an indicator's own settings go in brackets after it, such as H4.rsi(21).is_oversold(30) or H4.bb(20, 2.5).upper. Left out, they are the defaults, so H4.rsi is RSI 14. The condition editor shows them under the indicator.
- Flags and their numbers: every flag starts with is_ and takes its numbers in brackets, such as H4.rsi.is_oversold(25) or D1.macd.is_bull_div(3, 40). Left out, they are the published defaults.
- Joining and math: and, or, not and brackets; comparisons with numbers or other lines; + - * / and abs, min, max, round, floor and ceil.
- Functions: within_bars(x, 5) for "in the last 5 bars", bars_ago(x, 7), at_least_true(2, a, b, c), in_range(x, 40, 60), cross_above(a, b) and cross_below(a, b).
Two examples:
- H4.rsi.is_oversold(35) and D1.ema200.is_above
- abs(H1.price.value - H1.ema50.value) / H1.atr.value < 0.5 and at_least_true(2, H1.rsi.value < 45, H1.stoch.is_cross_up, H1.macd.hist > 0)
A rule that does not compile shows the reason and is not saved. The rule language reference on my blog lists every indicator, field, flag and number with its definition and source.
Getting started
- Attach the indicator to a chart. In the terminal it is named MTF Signal Workshop.
- Click + Signal, then Load from file to pick a ready-made signal, or + Add condition to build your own. Save puts it on the chart; Save to file also keeps it as a file for every chart.
- On each row, On/Off pauses a signal, the pencil edits it and the bin removes it. Settings sets the alerts and marker colors.
When a signal fires
Every condition is evaluated on closed bars of its own timeframe. A signal fires on the bar where its rule turns true, at least a set number of bars after its last firing. A divergence is known only a few bars after its second pivot, so its arrow sits on the bar where it became known. Only a firing on the bar that just closed alerts, once; removing and adding the indicator again does not repeat it. Older firings in the bars searched are drawn without alerting.
Strategy Tester
In the Strategy Tester, Multi Timeframe Signal Workshop shows six of the ready-made signals: DMI crosses with ADX over 25, strong trend agreement and breaks of structure, bullish and bearish. To test your own, copy your chart's settings file and signal files to the terminal's shared Common\Files directory; the user guide shows how.
Notes and limits
- Signals, their length and the indicators they read have no limit. Drawing does: 32 lines over the candles and 32 indicators per chart. A signal whose indicators no longer fit draws only its markers and says so, and it still fires and alerts.
- MetaTrader 4 cannot fill areas, so the Ichimoku cloud and the Bollinger, Keltner and Donchian bands show their lines without a fill.
- Each symbol keeps its own list of signals, with each signal's On/Off, Min bars between signals and alerts, and it comes back after a restart. Removing the indicator deletes its markers, lines, docks and panel.
- It does not open or manage trades. MTF Indicator Suite, free on the Market, draws the same indicators without signals.
Support
Two posts on my blog cover it in full: the user guide, with a picture of every step, and the rule language and indicator reference.
- User guide: https://www.mql5.com/en/blogs/post/779985
- Rule language and indicator reference: https://www.mql5.com/en/blogs/post/779986
For questions or problems, write in the Comments tab of this page or send me a private message on MQL5.