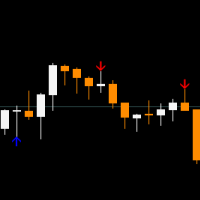
Gold Confluence XAUUSD
- Indicators
- Version: 1.2
- Updated: 1 August 2026
- Activations: 5

The indicator is designed exclusively for the XAUUSD trading pair, as all parameter settings and algorithm calculations are specifically optimized for the unique characteristics and high volatility of this instrument.
Calculation Core
- RSI
- MACD
- Momentum
Signal Confirmation Filters
- Trend Filter — signals take into account the price position relative to the Moving Average (MA).
- DXY Filter (U.S. Dollar Index) — represented by the yellow line on the histogram.
- Volume Filter — a signal is considered unconfirmed when the current volume is significantly below its average value.
- Trading Session Filter — London and New York sessions with customizable trading hours. It also includes the overlapping period when both the London and New York sessions are active simultaneously.
1. Information Display (Right Side)
- Volume indicator.
- DXY (U.S. Dollar Index) filter displayed on a scale from -100 to +100.
1.1 Volume Strength
The indicator also displays the percentage of buying or selling volume, together with the Volume Strength Identifier.
1.2 Neutral Volume
When trading volume reaches extremely low levels, it is classified as Neutral.
DXY Explanation
A positive value (for example, DXY: +56) indicates that the U.S. Dollar Index is trading above its Moving Average, meaning the U.S. dollar is currently strengthening. The closer the value is to +100, the stronger and more confident the upward movement.
A negative value (for example, DXY: -75) indicates that the index is trading below its Moving Average, meaning the U.S. dollar is weakening. A reading of -75 represents a strong bearish move and is already close to the lower extreme of the scale.
When DXY is negative (the U.S. dollar is weakening), gold prices tend to rise more frequently because XAUUSD is quoted in U.S. dollars. As the dollar loses value, more dollars are required to purchase the same amount of gold.
When DXY is positive (the U.S. dollar is strengthening), gold more commonly experiences a decline or a corrective move.
However, it is important to understand that this is not a strict mechanical relationship, but rather a statistical tendency that may temporarily break down, especially in the following situations:
- during major geopolitical or financial crises, when both the U.S. dollar and gold may rise simultaneously as safe-haven assets;
- on lower timeframes, where gold-specific news (such as inflation data or Federal Reserve decisions) can drive both assets independently;
- during periods of low market liquidity (for example, the Asian trading session).
For this reason, the DXY Filter serves as a confidence filter rather than a strict signal blocker. If the historical correlation temporarily weakens, the gold signal will still be displayed, but with a lower confidence level instead of being completely suppressed.
Histogram Interpretation
It is also important to understand the meaning of the green and red areas at the upper and lower extremes of the histogram.
The green and red colors do not simply represent the upper and lower ends of the scale. They indicate extreme zones that are confirmed by the direction of movement on the current bar.
The most important moments occur when:
- the histogram line moves out of the gray zone into the green zone, crossing the +120 level from below;
- or when it reverses downward from the red zone, crossing the −120 level from above.
These are the points where the Buy or Sell text label appears on the right side of the indicator window.
Oversold Reversal Pattern (Buy Pattern)The Oversold Reversal Pattern (Buy Pattern) is generated only when all of the following conditions are met simultaneously:
- On the previous bar, the RSI was in the oversold zone (RSI ≤ RSI_Oversold, default value 30).
- On the previous bar, the Composite Score was in the extreme oversold zone (≤ Oversold_Level, default −180), which is significantly deeper than the standard signal level of −120.
- On the current bar, the Composite Score has turned upward (current > previous).
- All standard confirmation filters are satisfied:
- volume is confirmed;
- the trend is bullish (if the Trend Filter is enabled);
- the current trading session is allowed;
- the spread is acceptable;
- MTF confirmation is valid.
The Overbought Reversal Pattern (Sell Pattern) follows the exact same logic, but in the overbought region at the upper end of the scale.
Pattern DisplayWithin the indicator's lower subwindow, the pattern is displayed as a circle, not as an arrow or a line.
- Orange circle — Overbought Reversal Pattern (Sell)
- DeepSkyBlue circle — Oversold Reversal Pattern (Buy)
The circle is plotted with an increased offset from the indicator line (Arrow_Gap × 1.6), making it visually distinct from standard level-crossing signals.
These patterns are not displayed on the main price chart.
Pattern ConfidenceThe pattern directly affects the final confidence value through the DXY Confidence Filter.
Whenever a pattern is triggered, the indicator recalculates GetDxyConfidence() specifically for that pattern.
The returned value (0–1) is multiplied by baseStrength, producing the final confidence percentage.
If both a standard signal and a reversal pattern occur on the same bar, the reversal pattern takes priority, since it is evaluated after the standard signal in the code. As a result, the displayed confidence percentage always reflects the pattern's confidence calculation.
Important Reliability NoteThe reversal pattern evaluates the previous completed bar (RSIRaw[i+1], prev) relative to the current bar.
Since bar i = 0 is still forming during real-time calculation, any signal or reversal pattern generated on the most recent candle may repaint until that candle closes.
For example, a Buy Pattern displayed on the current bar may disappear if price action changes before the candle closes.
This behavior is normal for indicators of this type and is not a bug.
It is important to keep this in mind when making real-time trading decisions. On historical charts, reversal patterns will appear perfectly accurate because all candles are already closed. However, in live market conditions, the most recent pattern should be considered less reliable than it may appear in backtesting.