LiquiditySweepHunter MT4

OVERVIEW

Liquidity Sweep Hunter  identifies liquidity highs and lows across three different lookback periods and keeps them active until they are mitigated. This creates a persistent view of where resting liquidity has formed instead of only showing the latest swing points.

The indicator also displays a heatmap that highlights the relative strength of active liquidity levels and generates reversal signals after price sweeps multiple visible liquidity bands before reclaiming them. Optional trade drawings project a stop loss, reward target, and intermediate target levels directly on the chart.

🟠 CONCEPTS

  • Liquidity Level — A price extreme detected from fast, medium, and slow lookback windows. Matching levels are merged so nearby highs or lows are treated as the same liquidity area.
  • Liquidity Heatmap — A visual strength map where colour represents the relative strength of each active liquidity level compared to the other visible levels.
  • Multi-Level Liquidity Sweep — A reversal condition where price sweeps at least two visible liquidity bands and then closes back beyond the reclaim level within a limited number of bars. An optional strength filter can require the swept levels to exceed a minimum average strength.

🟠 FEATURES

  • Liquidity Heatmap — Displays active liquidity levels using a colour gradient that reflects their relative strength.
  • Multi-Level Sweep Signals — Plots bullish and bearish reversal labels after confirmed liquidity sweep and reclaim events.
  • Trade Projection Boxes — Draws entry, stop loss, reward zone, and target milestone levels after each signal.
  • Trade Progress Display — Fills the target area as price reaches successive target levels and marks completed trades with a check mark.


🟠 HOW TO USE

  • Watch the heatmap to identify where stronger liquidity has accumulated around current price.
  • Wait for a bullish or bearish sweep signal after price clears multiple liquidity bands and reclaims the area.
  • Use the optional trade projection as a visual reference for the calculated stop loss, reward target, and target milestones.
  • Increase the lookback values to focus on broader liquidity zones or decrease them to detect more local levels.
  • Adjust the sweep strength filter if you want signals only when stronger liquidity zones are involved.


🟠 CONCLUSION

Liquidity Sweep Hunter combines persistent liquidity mapping, a relative strength heatmap, and multi-level liquidity sweep detection in a single indicator. It also provides optional trade projections that remain on the chart after each signal. Together these features help traders monitor where liquidity has formed, when it has been swept, and where price has reclaimed the area.

Recommended products
Color Macd Tf
Syarif Nur Arief
5 (1)
MACD is well known indicator that still can be use for prediction where price will go next few minutes, hours or even weekly  With colored bar of Macd, your eyes can easily catch when color is changed based what market price movement to find any early trend on market. here is the parameter of the indicator: TF_MACD , default is 1 Hour , this mean you can see clearly MACD of 1 Hour TimeFrame on Lower TimeFrame. InpPrice , default is Price Close , this is original MACD parameter from Metaquotes st
FREE
QualifiedEngulfing
Ashkan Hazegh Nikrou
QualifiedEngulfing Is Free Version Of ProEngulfing Indicator  ProEngulfing Is Paid Version Of This Indicator  Download It Here . What is Different Between free and paid version of ProEngulfing ?  Free version has limitation of One Signal Per Day Join Koala Trading Solution Channel in mql5 community to find out the latest news about all koala products, join link is below : https://www.mql5.com/en/channels/koalatradingsolution Introducing QualifiedEngulfing   – Your Professional Engulf Pattern In
FREE
FFx Momentum
Eric Venturi-Bloxs
4 (1)
The purpose of this new version of the MT4 standard indicator provided in your platform is to display in a sub-window multiple timeframes of the same indicator. See the example shown in the picture below. But the display isn’t like a simple MTF indicator. This is the real display of the indicator on its timeframe. Here's the options available in the FFx indicator: Select the timeframes to be displayed (M1 to Monthly) Define the width (number of bars) for each timeframe box Alert pop up/sound/ema
FREE
FFx Fractals
Eric Venturi-Bloxs
4.5 (2)
The purpose of this new version of the MT4 standard indicator provided in your platform is to display in a sub-window multiple timeframes of the same indicator. See the example shown in the picture below. But the display isn’t like a simple MTF indicator. This is the real display of the indicator on its timeframe. Here's the options available in the FFx indicator: Select the timeframes to be displayed (M1 to Monthly) Define the width (number of bars) for each timeframe box Alert pop up/sound/ema
FREE
NQX Key Reversal Signal MT4
Marcel De Oliveira Farias
NQX Key Reversal Signal MT4 is a signal indicator for MetaTrader 4: key reversal signals. Proprietary NQX logic that detects a key reversal at a fresh extreme. It works in any market condition. It draws the suggested entry, a short stop and long targets (3:1, 5:1, 10:1, up to 20:1 on swing); you decide. What it draws on the chart - An arrow on the closed signal candle (it never repaints a closed signal). - The suggested entry, a short stop and a long suggested target (default 8 x the risk), plus
FFx ParabolicSAR
Eric Venturi-Bloxs
4.67 (3)
The purpose of this new version of the MT4 standard indicator provided in your platform is to display in a sub-window multiple timeframes of the same indicator. See the example shown in the picture below. But the display isn’t like a simple MTF indicator. This is the real display of the indicator on its timeframe. Here's the options available in the FFx indicator: Select the timeframes to be displayed (M1 to Monthly) Define the width (number of bars) for each timeframe box Alert pop up/sound/ema
FREE
Discover the power of precision and efficiency in your trading with the " Super Auto Fibonacci " MT4 indicator. This cutting-edge tool is meticulously designed to enhance your technical analysis, providing you with invaluable insights to make informed trading decisions. Key Features: Automated Fibonacci Analysis: Say goodbye to the hassle of manual Fibonacci retracement and extension drawing. "Super Auto Fibonacci" instantly identifies and plots Fibonacci levels on your MT4 chart, saving you tim
FREE
Perfect for one minutes high trading and scalping. This indicator is very effective for trading on one minutes, in the hour. A combination of moving averages and STOCHASTICS calculation to produce a very convincing signal every hour. Blue colour signals a buy opportunity. Follow the X signs for possible buy points. The Blue average line serves as possible trend direction and support. Red colour signals a sell opportunity. Follow the X signs for possible sell points. The Red average line serves a
FREE
Stochastic Monitor
Jeffrey Lloyd Lauzon
MTF Stochastic Matrix (Free Advanced Momentum Crossover Dashboard) The Multi-Timeframe Stochastic Matrix is an institutional-grade technical scanner designed to evaluate momentum cycles, %K/%D line crossovers, and extreme overbought/oversold boundaries across 4 distinct execution timeframes simultaneously[cite: 14, 15]. By monitoring the M15, H1, H4, and D1 intervals concurrently[cite: 14, 15], this utility completely eliminates multi-chart cluttering and gives traders an instant executive matr
FREE
The Follow The Labels Indicator is a multi-functional MT4 indicator designed to give traders a comprehensive visual overview of market conditions across multiple dimensions. It combines trend analysis, previous day levels, stochastic momentum, and rejection signals in one easy-to-read interface. Key Features: Multi-Timeframe MA200 Trend Filter (H1→M15) Displays the alignment of the MA200 (LWMA) across three timeframes: H1, M30, M15. Shows an overall trend label: Bullish, Bearish, or Mixed. Optio
FREE
YOU CAN NOW DOWNLOAD FREE VERSIONS OF OUR PAID INDICATORS . IT'S OUR WAY OF GIVING BACK TO THE COMMUNITY ! >>>    GO HERE TO DOWNLOAD This system is an Heiken Ashi system based on RSI calculations . The system is a free open source script originally published on TradingView by JayRogers . We have taken the liberty of converting the pine script to Mq4 indicator . We have also added a new feature which enables to filter signals and reduces noise on the arrow signals. Background HEIKEN ASHI Th
FREE
Quantum Falcon Signal Free is a smart visual trading indicator for MetaTrader 4 designed for Forex and Gold traders. The indicator combines: • Trend analysis • RSI momentum confirmation • MACD momentum filtering • ATR volatility filtering • Higher timeframe confirmation • Smart exit signal detection Main Features: • Smart Buy and Sell signals • Exit Buy / Exit Sell alerts • Real-time dashboard on chart • Professional candle arrows • Multi-timeframe trend confirmation • ATR market volatility filt
FREE
Multi TF MA Levels
Luke Anthony Caras
Multi-TF MA Levels plots a single moving average across multiple timeframes directly on your chart, giving you instant context at every level of the market. No switching charts. No mental maths. Just clean, flat lines showing exactly where the MA sits on M15, M30, H1, H4 and D1 — all updated on confirmed bar close so there is no repainting. Features Plots the local timeframe MA plus up to 5 higher timeframe MAs simultaneously HTF lines only update on confirmed bar close — no repainting Higher ti
FREE
Toby Strategy Indicator
Ahmd Sbhy Mhmd Ahmd ʿYshh
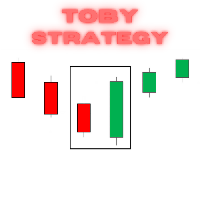
The indicator rely on The Toby strategy >> The mother candle which is bigger in range than the previous six candles. A vertical line shows the last Toby Candle with the targets shown up and down. The strategy is about the closing price out of the range of the toby candle to reach the 3 targets..The most probable to be hit is target1 so ensure reserving your profits and managing your stop lose.
FREE
FFx RSI
Eric Venturi-Bloxs
4 (1)
The purpose of this new version of the MT4 standard indicator provided in your platform is to display in a sub-window multiple timeframes of the same indicator. See the example shown in the picture below. But the display isn’t like a simple MTF indicator. This is the real display of the indicator on its timeframe. Here's the options available in the FFx indicator: Select the timeframes to be displayed (M1 to Monthly) Define the width (number of bars) for each timeframe box Alert pop up/sound/ema
FREE
CCI Trend Monitor
Jeffrey Lloyd Lauzon
MTF Commodity Channel Index (CCI) Matrix (Free Advanced Trend Scanner Dashboard) The Multi-Timeframe Commodity Channel Index (CCI) Matrix is an institutional-grade technical scanner designed to evaluate cyclical trend momentum and structural threshold breakouts across 4 distinct execution timeframes simultaneously[cite: 18, 19]. By monitoring the M15, H1, H4, and D1 intervals concurrently[cite: 18, 19], this utility completely eliminates multi-chart cluttering and gives traders an instant execu
FREE
This indicator alerts you when/before new 1 or 5 minute bar candle formed. In other words,this indicator alerts you every 1/5 minutes. This indicator is especially useful for traders who trade when new bars formed. *This indicator don't work propery in strategy tester.Use this in live trading to check functionality. There is more powerful Pro version .In Pro version,you can choose more timeframe and so on. Input Parameters Alert_Or_Sound =Sound ----- Choose alert or sound or both to notify y
FREE
Trendline indicator
David Muriithi
2 (1)
Are you tired of drawing trendlines every time you're analyzing charts? Or perhaps you would like more consistency in your technical analysis. Then this is for you. This indicator will draw trend lines automatically when dropped on a chart. How it works Works similar to standard deviation channel found on mt4 and mt5. It has 2 parameters: 1. Starting Bar 2. Number of bars for calculation The   starting bar   is the bar which drawing of the trend lines will begin, while the   number of bars for c
FREE
Candle Countdown — Accurate Time to Close for MT4 Candle Countdown is a simple and precise tool that shows the remaining time until the current candle closes directly on the chart. When your entry depends on the candle close, even a few seconds matter. This indicator helps you see the exact time and make decisions without rushing or guessing. An indicator for precise control over candle closing time. The indicator displays: time remaining until candle close current server time spread Stop Level
FREE
Rainbow MT4
Jamal El Alama
Rainbow MT4 is a technical indicator based on Moving average with period 34 and very easy to use. When price crosses above MA and MA changes color to green, it’s a signal to buy. When price crosses below MA and MA changes color to red, it’s a signal to sell. The Expert advisor ( Rainbow EA MT4) based on Rainbow MT4 indicator, as you can see in the short video below is now available here .
FREE
FFx MACD
Eric Venturi-Bloxs
4.2 (5)
The purpose of this new version of the MT4 standard indicator provided in your platform is to display in a sub-window multiple timeframes of the same indicator. See the example shown in the picture below. But the display isn’t like a simple MTF indicator. This is the real display of the indicator on its timeframe. Here's the options available in the FFx indicator: Select the timeframes to be displayed (M1 to Monthly) Define the width (number of bars) for each timeframe box Alert pop up/sound/ema
FREE
Tipu Heikin Ashi Panel
Kaleem Haider
4.56 (18)
Tipu Heikin-Ashi Panel is the modified version of the original Heiken Ashi indicator published by MetaQuotes here . A professional version of this indicator is available here . Features An easy to use Panel that shows the Heiken Ashi trend of selected timeframe. Customizable Buy/Sell alerts, push alerts, email alerts, or visual on-screen alerts. Customizable Panel. The panel can be moved to any place on the chart or minimized to allow more space. Heikin means "the average", and Ashi means "foot
FREE
It estimates the most likely short-term price movement based on advanced mathematical calculations. Features Estimation of the immediate price movement on the chart's timeframe; Calculation of the real market trend; Calculation of the most important support and resistance levels; Light on system resources: lines and panel are only updated when a value changes; Self-adjusting: works on any symbol and any timeframe, with no parameters to tune; Works alongside other indicators, EAs and scripts on
FREE
Traditional MACD MT4
Daniel Lewis
4.59 (56)
MACD indicator in MetaTrader 4/5 looks different than MACD does in most other charting software. That is because the MetaTrader 4/5 version of MACD displays the MACD line as a histogram when it is traditionally displayed as a line. Additionally, the MetaTrader 4/5 version computes the Signal line using an SMA, while according to MACD definition it is supposed to be an EMA. The MetaTrader 4/5 version also does not compute a true MACD Histogram (the difference between the MACD/Signal lines). This
FREE
OrderBlock TS Roman
Vladislav Vlastovskii
4 (6)
Индикатор строит блоки заказов (БЗ) по торговой системе (ТС) Романа. Поиск блоков осуществляется одновременно на двух таймфремах: текущем и старшем (определяемым в настройках). Для оптимизации и игнорирования устаревших блоков в настройках задается ограничение количества дней в пределах которых осуществляется поиск блоков. Блоки строятся по правилам ТС состоящем из трех шагов: какую свечу вынесли (что?); какой свечой вынесли (чем?); правило отрисовки (как?).
FREE
======================================================== GOLD WAVE LEVELS (ELLIOTT-ALIGNED) - MQL5/MT4 MARKET DESCRIPTION (formatting: **bold** = Bold button; lines with • = bullet list; UPPERCASE = heading) ======================================================== OVERVIEW ------------------------------------------------------- **Gold Wave Levels** draws a tested wave backbone for gold and validates signals against **Elliott theory hard-rules**, with higher-timeframe context and per-timeframe
FREE
WAD Stoch
Yonny Pascal Ekwa Mezui
WAD Divergence + Stochastic Overview WAD Divergence + Stochastic is a technical indicator designed to assist traders in identifying potential market turning points. It combines price behavior with momentum confirmation to highlight areas where buying or selling pressure may be shifting. The indicator works directly on the chart and provides clear visual signals to support decision-making in fast-moving markets. How It Works The indicator analyzes the relationship between price movement and inte
FREE
TreendLines
Sajjad Karimi
5 (1)
''Trendlines'' is an Indicator, that every Trader need and shows Trendline and  Support and resistance levels in all  Timeframe's. Also In 1-hour, 4-hour and daily time frames and Current timeframes, support, and resistance levels are specified and trend lines are drawn so that the trader can see all levels on a chart.   In   Properties   it is possible to turn off unnecessary Lines.  In ' Tendency indicator '' , as full package of Predictions that every Trader need, there  is also the Predict
FREE
SuperTrend V
Muhammad Hassaan
*This is TradingView indicator converted to mql4* The SuperTrend V indicator is a popular technical analysis tool used to identify trends and potential trend reversals in financial markets. It is based on the concept of the SuperTrend indicator but incorporates additional features and variations. The SuperTrend V indicator uses a combination of price action and volatility to determine the trend direction and generate trading signals. Here are the key components and features of the indicator: Ca
FREE
Buyers of this product also purchase
Trend SniperX MT4
Sarvarbek Abduvoxobov
5 (5)
Trend Sniper X is a multi-timeframe trend-following indicator for MetaTrader 5 that helps traders identify trend direction and potential reversal points with clarity and precision. For MT5: https://www.mql5.com/en/market/product/181101 Price Information: The current price is promotional and is subject to change as upcoming updates and new features are released. Code2Profit Channel Master the Market with Multi-Timeframe Analysis! How to Maximize Your Win Rate with Trend Sniper X: Key Rules & Sess
Zoryk Gold mt4
Reda El Koutbane
5 (3)
discount ends soon original price 69 $ ZORYK — Advanced XAUUSD Signal System for MetaTrader 4 You know the feeling. You spend time analyzing gold. You wait for the entry. You finally open the trade, and price immediately moves against you. You close too early, move the Stop Loss, or hesitate for a few seconds. Then the market reaches the exact destination you originally expected without you. The direction was not always the problem. The real problem was uncertainty. You did not know exactl
M1 Sniper
Oleg Rodin
4.97 (30)
M1 SNIPER  is an easy to use trading indicator system. It is an arrow indicator which is designed for M1 time frame. The indicator can be used as a standalone system for scalping on M1 time frame and it can be used as a part of your existing trading system. Though this trading system was designed specifically for short-term trading, it still can be helpful for all traders. This trading system can be used with any forex pair and time frame, though lower time frames are recommended from M1 up to M
Tokyo mt4 Indicator
Vasiliy Strukov
5 (9)
Tokyo Indicator provides a clear visual overview of trend direction, potential trading signals, and market conditions. Its colour-coded, stepped trend line distinguishes bullish phases in blue from bearish phases in magenta. Matching directional arrows highlight potential buying and selling opportunities when the displayed trend changes. An integrated dashboard brings together the current signal, market bias, momentum, volatility, and signal quality in one convenient view. This allows traders t
PRO Renko System
Oleg Rodin
5 (31)
PRO Renko System is a highly accurate trading system specially designed for trading RENKO charts. The ARROWS and Trend Indicators DO NOT REPAINT! The system effectively neutralizes so called market noise giving you access to accurate reversal signals. The indicator is very easy to use and has only one parameter responsible for signal generation. You can easily adapt the tool to any trading instrument of your choice and the size of the renko bar. I am always ready to provide extra support to help
Currency Strength Wizard is a very powerful indicator that provides you with all-in-one solution for successful trading. The indicator calculates the power of this or that forex pair using the data of all currencies on multiple time frames. This data is represented in a form of easy to use currency index and currency power lines which you can use to see the power of this or that currency. All you need is attach the indicator to the chart you want to trade and the indicator will show you real str
Atomic Analyst
Issam Kassas
5 (14)
Atomic Analyst — MetaTrader 4 For product questions, setup guidance, or technical support, message me directly here on MQL5. The indicator turns complex market calculations into simple visual signals, color-coded candles, trend readings, stop-loss levels, and multiple take-profit zones that traders can understand quickly and use in real market conditions. Main Trading Uses: Scalping and intraday trading: Designed for fast decision-making, clear arrows, alerts, candle colors, and structured entry
Smart Trend Trading System is a chart indicator for MetaTrader 4 that brings trend information, entry and exit signals, and price levels into one workspace. It combines 10+ trading tools into one system, including trend detection, reversal zones, smart cloud, trailing stop logic, support and resistance, candle coloring, alerts, and multi-timeframe analysis. The system is designed to help you trade different market conditions: Trending markets: Identify the main trend, detect pullbacks, follow mo
Scalper Vault
Oleg Rodin
5 (40)
Scalper Vault is a powerful, fully-equipped trading system designed for traders who want to achieve consistency in intraday trading . This high-precision indicator serves as a complete, standalone trading system that delivers institutional-grade analysis for both Forex and Binary Options traders. PLEASE CONTACT ME AFTER PURCHASE TO GET MY TRADING TIPS PLUS A GREAT BONUS! By eliminating the guesswork and complex manual analysis, Scalper Vault allows you to focus purely on execution using easy t
Neuro Poseidon MT4
Daria Rezueva
4.74 (46)
Neuro Poseidon is a new indicator by Daria Rezueva. It combines precise trading signals with adaptive TP/SL levels - creating best possible trades as a result! Message me and get  Neuro Poseidon Assistant  as a gift to automize your trading process! What makes it stand out? 1. Proven profitability on all assets and timeframes 2. Only confirmed BUY and SELL signals present on the chart 3. Adaptive TP & SL levels generated by the software for each trade 4. Easy to understand - suitable for all
Gann Made Easy
Oleg Rodin
4.84 (173)
Gann Made Easy is a professional and easy to use Forex trading system which is based on the best principles of trading using the theory of W.D. Gann. The indicator provides accurate BUY and SELL signals including Stop Loss and Take Profit levels. You can trade even on the go using PUSH notifications. PLEASE CONTACT ME AFTER PURCHASE TO GET TRADING  INSTRUCTIONS   AND GREAT EXTRA INDICATORS  FOR FREE! Probably you already heard about the Gann trading methods before. Usually the Gann theory is a
Liquidity Scalper System: a liquidity-based trading system in indicator form. Most indicators only show an arrow, and the trader then has to decide where the stop goes, where the target is and whether the signal can be trusted at all. Liquidity Scalper System covers the full trade cycle: it finds liquidity pools, gives a signal when they are broken, immediately calculates Entry, Stop Loss and three targets, and shows statistics and out-of-sample test results on the panel. The system picks its o
SR Liquidity
Oleg Rodin
5 (2)
SR Liquidity is a trading indicator designed to reveal the hidden zones where market liquidity concentrates and price reacts most strongly. These special liquidity areas act as powerful support and resistance levels, giving you a clear map of where the market is most likely to reverse. Instead of drawing ordinary Support/Resistance lines, SR Liquidity analyzes real price behavior to detect the zones where buying and selling pressure accumulate. These are actually the pools of liquidity that driv
AW Prime Oscillator
AW Trading Software Limited
5 (1)
A combination of two oscillators. The first one displays the entry points, the second shows the current trend . The indicator can display oscillator signals by arrows in two modes, all fast oscillator signals or signals only in the direction of the current trend. It has a multi-timeframe panel and three types of signal notifications. Benefits: Suitable for day and scalping trading Trend filtering Simple and sensitive setup Multi-timeframe panel Suitable for integration into an advisor. Works on
CRT Candle Range Theory HTF MT4 - Ultimate CRT Indicator: Advanced ICT Concepts and Malaysian SnR Trading System Master the Market Maker's Footprints with the Most Advanced Candle Range Theory Indicator. Unlock the true power of Smart Money Concepts (SMC) and trade precisely like the institutions with the Ultimate CRT Indicator. Built exclusively for serious traders, this indicator automates the highly effective Candle Range Theory (CRT), a core pillar of ICT Concepts (Inner Circle Trader), and
Top Bottom Tracker is an indicator based on sophisticated algorithms that analyse the market trend and can detect the highs and lows of the trend / MT5 version . The price will progressively increase until it reaches 500$. Next price --> $99 Features No repainting This indicator does not change its values when new data arrives Trading pairs All forex pairs Timeframe     All timeframes Parameters ==== Indicator configuration ==== Configuration parameter // 40 (The higher the value, the
Cycles Predictor Indicator This indicator uses past market cycles to predict future price movements. The indicator scans through past data and considers  combinations  of cycles. When cycles  coincide  at the same future date/time then it is considered a valid future prediction. The predictions are drawn as vertical lines on the right side of the chart in the future. A prediction will often result in type of candle (ex. bull or bear) and/or a reversal point (ex. bottom or top) forming at this ex
Break and Retest Hunter MT4 is a powerful MetaTrader 5 indicator designed to automatically identify support and resistance levels, breakout structures, and potential retest opportunities in real time. Bonus Indicator: After purchasing Break and Retest Hunter , contact me to receive Trade Indicator Assistant EA completely free as a bonus utility. $65 for the next 10 copies . Next price is $120.  Combining adaptive market analysis, clear BUY/SELL signals, Fibonacci-based profit targets, and a pre
GoldRush Trend Arrow Signal V1.6 The GoldRush Trend Arrow Signal indicator V1.6 continues to provide precise, real-time trend analysis tailored for high-speed, short-term scalpers in XAU/USD , but it now has additional features and improved efficiency and reliability. Built specifically for the 1-minute time frame, this tool displays directional arrows for clear entry points, allowing scalpers to navigate volatile market conditions with confidence. The indicator consists of PRIMARY and SECONDARY
ForexTrendMT4
Andriy Sydoruk
5 (1)
ForexTrendMT4 Indicator: A Reliable Tool for Market Tracking The ForexTrendMT4 indicator offers reliable market trend tracking, filtering out sudden fluctuations and market noise. This tool helps identify trends and signals favorable entry points into the market using arrows. It is suitable for both scalping on shorter timeframes and long-term trading strategies. Based on the principles of technical analysis, ForexTrendMT4 takes into account the cyclical nature of the market. Key Features and A
CRT Multi-Timeframe Market Structure & Liquidity Sweep Indicator Non-Repainting | Multi-Asset | MT5 Version Available MT5 Version:   https://www.mql5.com/en/market/product/162075 Full User Guide — explains what each feature does and why:   https://www.mql5.com/en/blogs/post/767525 Quick Start User Guide  — explains how to configure and in what order:  https://www.mql5.com/en/blogs/post/767540 Indicator Overview CRT Ghost Candle HTF Fractal is a complete institutional-grade market structure too
Super Signal – Skyblade Edition Professional No-Repaint / No-Lag Trend Signal System with Exceptional Win Rate | For MT4 / MT5 It works best on lower timeframes, such as 1-minute, 5-minute, and 15-minute charts. Core Features: Super Signal – Skyblade Edition is a smart signal system designed specifically for trend trading. It applies a multi-layered confirmation mechanism to detect only strong, directional moves supported by real momentum. This system does not attempt to predict tops or bottoms
Trading Special –40% OFF Best Solution for any Newbie or Expert Trader! This Indicator is a unique, high quality and affordable trading tool because we have incorporated a number of proprietary features and a new formula. With only ONE chart you can read Currency Strength for 28 Forex pairs! Imagine how your trading will improve because you are able to pinpoint the exact trigger point of a new trend or scalping opportunity? User manual: click here Looking for the MT5 version? Click here: https:/
Volume Orderflow Profile
Suvashish Halder
5 (2)
Introducing Volume Orderflow Profile , a versatile tool designed to help traders visualize and understand the dynamics of buying and selling pressure within a specified lookback period. Perfect for those looking to gain deeper insights into volume-based market behavior! MT5 Version -  https://www.mql5.com/en/market/product/122657 The indicator gathers data on high and low prices, along with buy and sell volumes, over a user-defined period. It calculates the maximum and minimum prices during this
Smart Price Action Concepts — MetaTrader 4 For product questions, setup guidance, or technical support, message me directly here on MQL5. Smart Money Concepts SMC  Inner Circle Trading ICT  Price Action PA and Institutional Trading IT Real time market structure and swing structure highs and lows ( HH HL LL LH ) Real time internal and swing supply and demand order blocks Premium Equilibrium and Discount Zones Automatic Fibonacci Detection with 2 Options (current swing or previous swing ) Equal hi
True Direction Oscillator
Muhammad Elbermawi
4.85 (364)
Or (TDO)  which is an index that measures the price rate of change using the principle of " Pure Momentum ". When a security price advances from 10 to 15 then the price rate of change is 150% but when it declines back from 15 to 10 then the price rate of change is 33.3% only. That is why technical analysis indicators like "Price Rate of Change" (ROC) or "Momentum" give higher readings for ascending price movements than those given to descending ones. TDO fixes this problem to help traders at rea
Trend Lines PRO
Roman Podpora
5 (2)
TREND LINES PRO    helps understand where the market is truly changing direction. The indicator shows real trend reversals and points where major players re-enter. You see   BOS lines   Trend changes and key levels on higher timeframes — without complex settings or unnecessary noise. Signals don't repaint and remain on the chart after the bar closes. VERSION MT 5     -     Reveals its maximum potential when paired with the   RFI LEVELS PRO  indicator What the indicator shows: Real shifts   tren
Trading Special – 30% OFF Best Solution for any Newbie or Expert Trader! This dashboard software is working on 28 currency pairs plus one. It is based on 2 of our main indicators (Advanced Currency Strength 28 and Advanced Currency Impulse). It gives a great overview of the entire Forex market plus Gold or 1 indices. It shows Advanced Currency Strength values, currency speed of movement and signals for 28 Forex pairs in all (9) timeframes. Imagine how your trading will improve when you can watch
Advanced Supply Demand
Bernhard Schweigert
4.91 (302)
Trading Special – 30% OFF Best Solution for any Newbie or Expert Trader! This indicator is a unique, high quality and affordable trading tool because we have incorporated a number of proprietary features and a new formula. With this update, you will be able to show double timeframe zones. You will not only be able to show a higher TF but to show both, the chart TF, PLUS the higher TF: SHOWING NESTED ZONES. All Supply Demand traders will love it. :) Important Information Revealed Maximize the pot
KT Parabolic RSI MT4
KEENBASE SOFTWARE SOLUTIONS
KT Parabolic RSI overlays Parabolic SAR directly on the RSI line to highlight likely market turning points. Classic RSI overbought and oversold readings already hint at reversals, and the added PSAR filter removes much of the noise and sharpens those signals, giving you clearer trade setups. Big Square Signals: A Parabolic SAR flip on an RSI that sits in overbought or oversold territory. These mark high-probability market turns. Small Square Signals: A SAR flip inside the neutral RSI band. Treat
More from author
Volume Arrow Signal Product Description Volume Arrow Signal is a smart trading indicator designed to help traders identify potential buy and sell opportunities using price action, volume behavior, and directional arrow signals. The indicator places clear arrows directly on the chart, making it easy to spot possible market reversals, trend continuations, and entry opportunities without spending hours analyzing charts manually. Whether you are trading Gold (XAUUSD) , Forex pairs, Indices, or Crypt
LiquiditySweepHunter
Michael Oko Oboh
5 (2)
OVERVIEW Liquidity Sweep Hunter  identifies liquidity highs and lows across three different lookback periods and keeps them active until they are mitigated. This creates a persistent view of where resting liquidity has formed instead of only showing the latest swing points. The indicator also displays a heatmap that highlights the relative strength of active liquidity levels and generates reversal signals after price sweeps multiple visible liquidity bands before reclaiming them. Optional tr
FREE
DMSL Pro Ultra
Michael Oko Oboh
DMSL Pro Ultra is a professional MetaTrader 5 (MT5) trading indicator that helps traders understand market structure and identify high-probability trading zones. It automatically detects important support and resistance levels, highlights major swing highs and lows, and displays market structure changes in real time. The indicator is designed to reduce chart clutter while providing clear, actionable trading information. Key Features Automatic Support & Resistance Detection Identifies strong supp
FREE
VolumeMomentumIndex_SMRT — Professional MT5 Volume Profile & Momentum Indicator VolumeMomentumIndex_SMRT is a multi-functional MetaTrader 5 indicator designed to help traders analyze market volume, price momentum, key support and resistance zones, and potential trading opportunities. Combining volume profile analysis with breakout and rejection signal detection, the indicator provides a structured view of market activity to support informed trading decisions across multiple timeframes and financ
FREE
CRT H4 ARROW Strategy CRT H4 ARROW High-Probability Continuation & Reversal Trading Strategy The CRT H4 ARROW Strategy is a professional price action trading method designed to identify high-probability institutional entries using Candle Range Theory (CRT) on the 4-Hour (H4) timeframe. Rather than chasing the market, the strategy waits for price to reach a predefined CRT Entry Level , where institutional buying or selling pressure is likely to appear. This allows traders to enter with clearly
FREE
his indicator acts like two expert traders working together — one using RSI, the other using MACD. Instead of you looking at both separately and guessing, it combines their opinions into one clear signal: buy arrow or sell arrow . Once an arrow appears, it stays put. No disappearing tricks. What Makes It Different Most indicators give you raw lines and numbers. This one gives you a final verdict by requiring both RSI and MACD to agree before showing a signal. That’s the "combo" in the name. It a
Volume Arrow Scanner MT5 The Volume Arrow Scanner is a professional multi-timeframe trend and momentum indicator designed to identify high-probability buying and selling opportunities by analyzing market direction, momentum changes, and crossover events. It displays all trading signals directly on the price chart, allowing traders to quickly identify potential entries and exits without using a separate indicator window. Key Features Multi-Timeframe Trend Analysis The indicator can analyze price
FREE
SMC Order Block Scorer: Volume Confluence Order blocks that are ranked for you, so you can see which zones matter most. Most Smart Money Concepts indicators draw every order block the same way. You end up with a chart full of boxes and no way to tell which ones are worth your attention. This indicator draws the zones and also scores each one from 0 to 100 and gives it a grade (A+, A, B or C). The score comes from market structure and volume. The score is a rule-based confluence ranking. It is no
FREE
RSI SIGNAL Indicator RSI SIGNAL is a technical trading indicator designed to help traders identify high-probability Buy and Sell opportunities by combining RSI momentum analysis with price action and trend confirmation. Main Purpose The indicator analyzes the current market condition and produces clear BUY and SELL signals directly on the chart. Instead of relying on RSI alone, it can use multiple confirmations to reduce weak or misleading signals. Key Features BUY Signals — identifies b
FREE
Awesome SnR
Michael Oko Oboh
Awesome AO 4-Color AUTO REFRESH Indicator Advanced Momentum & Zero-Cross Visualization Tool for MT4 The Awesome AO 4-Color AUTO REFRESH indicator is a powerful upgraded version of the classic Awesome Oscillator designed for professional Forex traders who want cleaner momentum visualization, automatic chart marking, and better trade confirmation. Built by FXSignalSpot , this indicator transforms the standard AO into a more advanced trading assistant by adding: 4-color momentum histogram logic Aut
FREE
A Range Detector Indicator is a technical analysis tool designed to automatically identify when the market is not trending and is instead moving inside a sideways consolidation structure (range) . In professional trading systems, it is less about drawing boxes and more about classifying market state : trend vs range. To understand it properly, you need to see it as a market regime detector , not just a support/resistance tool. 1. What a “range” actually means (core concept) A market is consid
FREE
The Breakout and Structural Shift The indicator registers a true breakout when the price aggressively pushes past a previously established level and closes outside of it. To confirm a change to a Bullish structure: The price must break above the previous high . Once a candle closes above that peak, the old resistance is broken. The structure officially shifts because the market has just created a Higher High , signaling that buyers are firmly in control. To confirm a change to a Bearish structur
FREE
Currency Strength Meter Dashboard Indicator Overview The Currency Strength Meter Dashboard is a professional-grade MetaTrader 4 (MT4) indicator developed by fxsignalspot.com . It provides traders with a comprehensive, real-time view of currency strength across 8 major currencies (USD, EUR, GBP, CHF, CAD, AUD, JPY, NZD) and 28 currency pairs. The indicator features an interactive on-chart dashboard with multiple display modes, customizable color-coded strength zones, trend/range meters, trade bia
FREE
SMC Institutional Visualizer with Weekly Range Box - Detect Liquidity Sweeps, BOS, Order Blocks, FVGs & Weekly Key Levels Complete Smart Money Concepts (SMC) indicator for institutional trading visualization. Detects Liquidity Sweeps, Break of Structure (BOS), Order Blocks, and Fair Value Gaps (FVG). Now includes Weekly Range Box showing last closed weekly candle's high, low, and midline. Fully customizable colors and styles. Perfect for price action and supply/demand traders. Long Description
FREE
The Breakout and Structural Shift The indicator registers a true breakout when the price aggressively pushes past a previously established level and closes outside of it. To confirm a change to a Bullish structure: The price must break above the previous high . Once a candle closes above that peak, the old resistance is broken. The structure officially shifts because the market has just created a Higher High , signaling that buyers are firmly in control. To confirm a change to a Bearish structur
FREE
1. STRUCTURAL STRENGTH (0-9 Scale) The indicator analyzes each currency's position relative to its daily range across all 28 major pairs: Price position within the daily high/low range is converted to a 0-9 score using a statistical distribution model Base currency receives a score proportional to its strength Quote currency receives the inverse score (9 - base score) Final structural strength = average score across all pairs the currency participates in text STRONG currencies (score ≥ 6.0) → Po
FREE
FNCD (Fisher Normalized Cumulative Deviation) Indicator Overview The FNCD is a momentum oscillator that combines statistical normalization with the Fisher Transform to create a highly responsive yet smooth indicator. It measures how far price has deviated from its mean in terms of standard deviations, then applies the Fisher Transform to normalize the distribution. The result is a bounded oscillator with clear crossover signals, displayed as a two-color histogram against a signal line. How It Wo
FREE
Trend Mega Hilo
Michael Oko Oboh
Trend Mega Profit Hilo is a powerful non-repainting trend momentum indicator designed to help traders identify bullish and bearish market direction with improved clarity and stability. It combines advanced price normalization, logarithmic momentum calculation, and exponential smoothing to deliver clean trend histograms, smoothed signal lines, and early reversal indications. This indicator is built specifically for traders who want: Stable non-repainting signals Cleaner trend visualization Reduce
CloudScalper Gold
Michael Oko Oboh
CloudScalper Gold: High-Frequency Trend Breakout Specialist CloudScalper Gold is a premium Expert Advisor (EA) specifically engineered for the high-volatility environment of the Gold market ( XAUUSD ). It combines rapid entry logic with a "safety-first" defensive suite to capture momentum moves while aggressively protecting your capital. Key Advantages Precision Entry: Unlike "grid" or "martingale" bots that stay in the market too long, CloudScalper uses a Stop-Order Breakout strategy. It only e
In Simple Terms This indicator acts like two expert traders working together — one using RSI, the other using MACD. Instead of you looking at both separately and guessing, it combines their opinions into one clear signal: buy arrow or sell arrow . Once an arrow appears, it stays put. No disappearing tricks. What Makes It Different Most indicators give you raw lines and numbers. This one gives you a final verdict by requiring both RSI and MACD to agree before showing a signal. That’s the "combo"
This indicator is basically a zero-line momentum oscillator with built-in buy/sell crossover signals , designed to behave like a smoothed “pressure gauge” for price direction. What the indicator does It works in two layers: 1. Main Oscillator (Subwindow line) The yellow line (buffer 0) is a custom Fisher-style normalized momentum value . It is built from: Highest close over a period Lowest close over a period Mid price (Open + Close)/2 Recursive smoothing (previous values influence current
ENTRY AND EXIT ARROWS Indicator – Description The Entry and Exit Arrows indicator is a simple yet effective momentum-based tool designed to highlight potential buy and sell opportunities directly on the chart using visual arrows. It works by comparing two internal momentum measurements with different sensitivities. When both measurements align in the same direction, the indicator confirms a stronger directional bias and plots a signal. How It Works Buy Signal (Lime Arrow Below Candle): Appea
ForceWave
Michael Oko Oboh
Product Description ForceWave is an advanced momentum and trend-strength indicator designed to help traders identify market pressure, directional strength, and potential reversals with reduced repainting behavior. It analyzes price movement using a smoothed force-wave algorithm and displays bullish and bearish momentum directly in a separate indicator window for easier market interpretation. The indicator was developed with a focus on confirmed candle calculations, helping traders reduce false s
Visible Range High Low MT4 (Non-Repainting) Overview The Visible Range High Low indicator is designed to help traders instantly identify the most critical price levels on their chart. It dynamically scans a user-defined number of bars to detect the visible range's absolute high and low, marking these pivot points directly on the chart. Key Features: Non-Repainting Logic: Once a high or low is identified and plotted, it remains fixed, allowing for reliable back-testing and historical analysis. C
Binary Signal Arrow / Scalper Arrow Indicator This is a zero-lag momentum arrow indicator that plots buy/sell signals directly on the chart when momentum reaches exhaustion points. What it shows: Lime histogram = Bullish momentum Red histogram = Bearish momentum Up arrows (Blue/Yellow) = Buy signals (momentum strengthening or weakening at thresholds) Down arrows (Pink/Yellow) = Sell signals How it triggers: The indicator plots arrows when momentum changes character after sensitivity bars (defaul
SpeedMomentum
Michael Oko Oboh
Adaptive Tick Impulse Momentum Meter PRO Institutional Non-Repainting Momentum Engine for MT4 The Adaptive Tick Impulse Momentum Meter PRO is an advanced institutional-style momentum and speed detection indicator designed for traders who want to identify explosive market moves before they fully develop. Unlike traditional indicators that rely on lagging averages or simple candle analysis, this engine combines: Tick imbalance analysis Adaptive volatility intelligence Momentum acceleration Kalman
Breakout Arrows Mt4
Michael Oko Oboh
5 (1)
Trend Breakout Arrows Indicator The Trend Breakout Arrows Indicator is a momentum-based signal tool designed to identify potential bullish and bearish breakout opportunities. It displays clear arrow signals directly on the price chart, helping traders quickly recognize possible trend changes and continuation setups. Up Arrow (Buy Signal) A magenta up arrow appears below a candle when bullish momentum begins to strengthen. This signal indicates that buying pressure may be overtaking selling press
FVG CHANGE INDICATOR Product Description A reliable trend-following indicator that DOES NOT repaint - what you see is what you get! The FVG CHANGE INDICATOR is a professional trend detection system that helps you identify market direction with confidence. Unlike many indicators that change signals after the fact (repainting), this modified version locks in signals on closed bars only, giving you trustworthy entry points you can act on. How It Works The indicator analyzes price action using a uni
Volume Arrow Signal Product Description Volume Arrow Signal is a smart trading indicator designed to help traders identify potential buy and sell opportunities using price action, volume behavior, and directional arrow signals. The indicator places clear arrows directly on the chart, making it easy to spot possible market reversals, trend continuations, and entry opportunities without spending hours analyzing charts manually. Whether you are trading Gold (XAUUSD) , Forex pairs, Indices, or Crypt
Borders Arrow Signals MT4 The Ultimate Non-Repainting Smart Arrow Trading Indicator Borders Arrow Signals MT4 is a professional-grade MetaTrader 4 indicator designed for traders who demand precision, reliability, and high-probability trade entries. Built for the MT4 trading platform, it delivers intelligent Buy and Sell signals based on advanced market analysis while maintaining exceptional speed and efficiency. Unlike conventional arrow indicators that repaint historical signals and create fals
Filter:
No reviews
Reply to review