Watch the Market tutorial videos on YouTube
How to buy а trading robot or an indicator
Run your EA on
virtual hosting
virtual hosting
Test аn indicator/trading robot before buying
Want to earn in the Market?
How to present a product for a sell-through
Paid Technical Indicators for MetaTrader 4 - 86
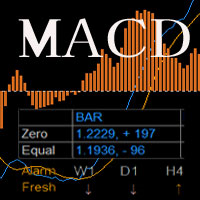
MACD with two lines and bar,
Predict the price, moniotr all period, play sound when it changed.
If there is any other need, contact me.
MACD = [stockPrices,12]EMA - [stockPrices,26]EMA signal = [MACD,9]EMA divergence = MACD – signal User Inputs Fast EMA Period - Fast moving average line, the default period is 12. Slow EMA Period- Slow moving average line, the default period is 26. Signal SMA Period - set signal period , the default period is 9.
Индикатор iVeles_MACD_Pro представляет симбиоз обычного индикатора MACD или разницу показаний между двух динамических МА, рассчитанных по текущим ценам инструмента. Сигнальная линия отсутствует, но ее заменяет более точные динамические облачные уровни.
Хорошо показывает разворотные моменты, позволяет точно определять дивергенции. Имеет цветовое сопровождение изменения показаний.
Параметры: period_Fast - период быстрой МА period_Slow - период медленной МА price_Bar - применяемая цена leve
Индикатор iVeles_RSI представляет собой обычный RSI, привязанный к нулевой отметке . В отличии от обычного RSI, наложены уровни сигнала в виде облака, что заметно расширяет области применения данного индикатора.
Очень хорошо показывает разворотные моменты, так же позволяет точно определять дивергенции.
Параметры: period - период RSI price - применяемая цена level - уровень облака
Индикатор iVeles_RVI представляет собой обычный RVI, с пересчитанными и приведенными значениями . В отличии от обычного RVI, наложены уровни сигнала в виде облака, что заметно расширяет области применения данного индикатора.
Очень хорошо показывает разворотные моменты и циклы тенденций, так же позволяет определять дивергенции.
Параметры: period - период RVI price - применяемая цена level - уровень облака
Индикатор iVeles_DeMarker представляет собой обычный DeMarker, с пересчитанными и приведенными к нулю значениями . В отличии от обычного DeMarker, наложены уровни сигнала в виде облака, что заметно расширяет области применения данного индикатора.
Очень хорошо показывает разворотные моменты и циклы тенденций, так же позволяет определять дивергенции.
Параметры: period - период DeMarker level - уровень облака
Индикатор iVeles_CCI представляет собой обычный CCI . В отличии от обычного CCI, наложены уровни сигнала в виде облака, что заметно расширяет области применения данного индикатора.
Очень хорошо показывает окончание трендов, разворотные моменты и циклы тенденций, так же позволяет определять дивергенции.
Параметры: period - период CCI price - применяемая цена level - уровень облака
Индикатор iVeles_Moment представляет собой обычный Momentum, с пересчитанными и приведенными к нулю значениями . В отличии от обычного Momentum, наложены уровни сигнала в виде облака, что заметно расширяет области применения данного индикатора.
Очень хорошо показывает разворотные моменты и циклы тенденций, может применяться как основной сигнал для входа в позицию.
Параметры: period - период Momentum price - применяемая цена level - уровень облака
The best indicator for Binary Options is now available at the MQLMarket, this version is already configured and optimized to operate with Binary Options, Forex and Cryptocurrencies. It is composed of a momentum algorithm that looks for better opportunities in the market, bringing you the best points to open your positions with low risk and high proportion of gain.
The MQL version can also be incorporated into the MT2 signal automator.
Product features Common signals (Oscillator) S
***SALE NOW ON***
We've all been there, searching for that profitable trade wading through 25 pairs but missing out because we didn't see it in time.
This is why I say trade simple trade effective and why I designed this scanner to keep watch on the markets that are trending and where a pullback could be able to happen.
Features:
Automatically looks at up to 28 pairs at the same time to save you from having to. Easily adjustable EMA settings to your own critera (Fast, Mid and slow sett
Perfected Stochastic HTF (Higher Time Frame) is perhaps the most advanced and reliable HTF indicator. Highly optimized in terms of execution, the indicator comes with standard settings of the Stoch indicator which is supplied with the MT4 platform. Place the indicator on the chart, any timeframe. You may select a higher time frame in indicator inputs. The same indicator can be used on a chart multiple times to draw Stoch from multiple timeframes or for different Stoch values. A must-have tool t
!! FLASH SALE !! Over 80% off !! For ONE week only. Now only $47 - normally $297! >>> Ends on 30 June 2023 - Don't miss it!
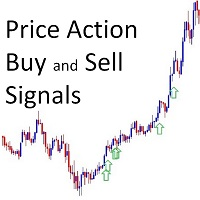
Buy and Sell Arrows On The Chart According To Price Action Sends Alerts On MT4 To Your Phone To You Email
Does NOT repaint. Works on any pair, any timeframe.
10 Activations allowed so you are free from limitations. MT5 Version here . For spreads from a tiny 0.1pip RAW/ECN Accounts, click here . Check out my Waka Esque EA signal here: >> High Risk
Индикатор iVeles_Trend_X_II - использует специализированный расчет текущих цен графика. Очень качественно и своевременно показывает смену направления, более того, отображаемая цена индикатора может быть использован в качестве уровня принятия решения. Работает качественно на любом ТФ и с любым инструментом. Параметры: period - период расчетов average - усреднение МА method - применяемый метод shift - сдвиг показаний
Индикатор iVeles_Perfect_Oscilator является опережающим и одним из самых лучших осциляторов на сегодняшний день, использует специализированный расчет текущих цен графика. Очень качественно и своевременно показывает смену направления, очень точный подход к уровням перекупленности и перепроданности, что позволяет своевременно принять решение по сделке. Работает качественно на любом ТФ и с любым инструментом. Параметры: period_Osc - период расчетов average_Osc - усреднение МА method_Osc - прим
AlgoKing Chandelier Exit Indicator (MT4)
The Chandelier Exit Indicator is a volatility based indicator that maximizes returns using the Average True Range (ATR) value and the highest high or lowest low of a period. Benefits Should be used as a trailing stop. Helps you exit a position when you have a respectable profit. Identifies a high probability of a trend reversal when the price moves against the prevailing trend by a distance equal to 3x the average volatility. Join the AlgoKing Lightning

DYJ ChameleonTrend works based on Trend Following and Counter Trend system. DYJ ChameleonTrend is a high probability indicator. This indicator uses a unique Mix indicator that combines sophisticated indicator with user discretion. This indicator is one most advanced Ma cross and variance algorithm. The indicator displays one colored directional arrows and trend scrolling balls, indicating the best entry and exit positions for traders. Input
InpPeriod = 50 -- Period InpPrice = PR

UR DivergenceSpotter UR DivergenceSpotter is the result of many years of experience and sometimes the easiest ways are the best. There is a good correlation between a few indicators, but when they mismatch - the price tries to "re-adjust" - and it's at that moment when we get a signal with UR DivergenceSpotter. Advantages of using UR Divergence Spotter: No parameters Doesn't repaint after the candle is created Signals when the signal is not valid anymore (meaning that you can hold your trade

UR VolumeTrend UR VolumeTrend is the clearest volume indicator showing the ongoing trend in terms of volume. Works perfectly with other indicators just like UR TrendExhaustion to signal local tops and bottoms. Limited to just 2 parameters - the higher values, the longer trends it will show. Gradient extremes show possible exhaustions of volume to catch a potential reversal. Two lines - The Volume trend and It's average. The best advantage: Easy and adjusted to all assets. There is a special

UR TrendExhaustion UR TrendExhaustion is the best solution for traders who don't want to deal with parameter values nor other set-ups - it is both easy and visually-understandable for everyone. Advantages of using UR TrendExhaustion: No parameters You have 3 lines that describe best what's going on on the chart: Trend Exhaustion Line , Whale Money Line and Retail Money Line . The interface showcases the exhaustion of either line on both extremes (red areas) The best advantage: Easy a
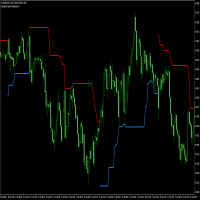
TP Trend Bars Indicator is a trend following technical indicator which is based on price action focusing on the swing highs and lows.
This indicator plots 2 types of lines. The first line is a dotted line, represnting the short-term trend. The second line is a solid line, representing the long term trend
Lines which are below the price action when on a bullish trend and above the price when the trend is bearish The solid line also changes color to indicate trend direction

Professional Support&Resistance Indicator. This indicator is primarily intended for professional use by brokers. There are countless options to choose from and it is one of the best tools in the stock market today. The indicator is optimized for use with EAs.
For programmers to retrieve output index value is for MQL4; (EXAMPLE)
bool buySNR=false,sellSNR=false;
char count=100;
char limit=1;
char dist=3;
for(short cnt=0;cnt<=count;cnt++)
{
double snr_middle=iCustom(NULL,TF_,"::Indica

极大的提升了交易感官,一目了然的走势展示,简洁高效。 极大的突出展示了行情的趋势脉络,跟随时间周期适应变化,替用户交易者研判了行情走势,简洁高效 同时我们还提供了主窗口和副窗口的展现,有需要可以联系我作者本人,感谢支持。 像传统的renko,又不是传统的renko,技术在发展,同样的砖图可以有不一样的绘制和计算展现。 希望可以帮到大家的交易,再次感谢。
极大的提升了交易感官,一目了然的走势展示,简洁高效。 极大的突出展示了行情的趋势脉络,跟随时间周期适应变化,替用户交易者研判了行情走势,简洁高效 同时我们还提供了主窗口和副窗口的展现,有需要可以联系我作者本人,感谢支持。 像传统的renko,又不是传统的renko,技术在发展,同样的砖图可以有不一样的绘制和计算展现。 希望可以帮到大家的交易,再次感谢。

Fractal Structures Breakout Trader !!SPECIAL PRICE FOR THE FIRST 10 COPIES!!
A next generation powerfull indicator which brings a new approach to fractal theory Indicator tries to scan and find the fractal breakouts. Momentum, price action and harmonic calculations are also used to complete the algo. Advantages: No Repaint Works on all chart timeframes. Works for every instrument including Currency Pairs, Gold, Oil, Commodities, Indices, Stocks and Cryptocurrencies. Easy to use. User and CPU f

Price pivot points H1 - an indicator that shows price pivot points on the H1 timeframe with an accuracy of up to 95%. 95 signals from 100 will accurately indicate the place of the price reversal in the opposite direction. The indicator does not redraw its values. Suitable for trading on any currency pair. It can be used for both intraday scalping and long-term trading. Price pivot points H1 shows signals as arrows. When the price reverses, the indicator will draw an arrow on the chart. If the p

This Indicator is a very Simple Method to make profit from the market! it has two arrow directions up and down. you can easily buy when you see up arrow and close it when you see down arrow. you can use it for Binary Options too! you also can use it with other indicators like Heiken Ashi and Ichimoku to make a complete System of Trading. it has just two Input Options: nBars: The Number of Candles you want to see the Signals for. ShowPanel: to display or not to display the Panel DoAlert: to Send

Indicator Support and Resistence plain in your chart seven lines; Red line=Resistence 3. Red line=Resistence 2. Red line=Resistence 1. Yellow line= Pivot. Green line= Support 1. Green line= Support 2. Green line= Support 3. adattable in all timeframe (minute 1, minute 5, minute 15, minute 30, Hour 1, Hour 4,Day 1,Week 1,Mounth 1); Buy under support and sell over the resistence;

This is another Arrow Indicator to show the instant direction of the Market. it's no repainting and no lagging. you can easily trade by it's direction or use it on your own System. the later is recommended! you can use it on Automatic Experts too. it's input parameters are consists of: nBars: Number of Bars to be checked EnableAlerts: to send Alert messages when get new Signal. EmailAlerts: to send you Email for new Signals you can simply use it on any Symbol or Time Frame after checking for it'

Magic Lines MT4 is an indicator which can be categorized as trend, levels and channels type. It draws a colored line which is colored in green and red depending where last close is. The value at the current open bar should not be taken into account. This part of the indicator can give us a sense whether it is trending up or down or its going sideways. Magic Lines indicator also draws blue top and bottom levels which can be taken into account for breakouts and false breakouts. A sideway zone shou

It could help to calculate Risk-Reward easily before placing a BUY-SELL position. TradeSizeCalculator is a Multi-Tasking Calculator. It will calculate the others when we define the value in one of the columns. Stoploss, risk percentage, risk-money, lot size, take-profit , reward-money, and reward-ratio. Depending on which value is changed. All values in the columns are editable. Also, we can get those calculation results by drag-drop the stop-loss/take-profit line. Parameter: The inputs below ar
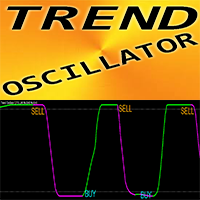
Trend Oscillator - is advanced custom indicator, efficient trading tool! Advanced new calculation method is used - 20 options for parameter "Price for calculation" Smoothest oscillator ever developed Green color for upward trends, Red color for downward trends Oversold values: below 5 ; O verbought values: over 95 There are plenty of opportunities to upgrade even standard strategies with this indicator // More great Expert Advisors and Indicators are available here: https://www.mql5.com/en/

CFF New Plan
CFF New Plan is the best trading indicator especially for scalping traders , It’s providing marvelous trading signals based on such and amazing algorithm.
--6 copies has been sold with price $60--
*** 6 Copies left for next price $613***
For Nasdaq trading, the most important principle is to know the trend of the fund.
This indicator with 6 green and red lights provides you with the daily path of this important indicator.
This indicator has been tested for 6 months and has a win rate of over 85%.
Be sure to contact me before purchasing to get the necessary instructions on how to use and set up this indicator.
You should use a broker that has dollar index, vix, and commodities. MT5 Version
You can contact us via Instagram,
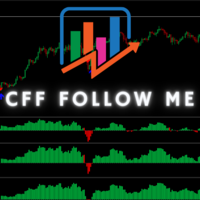
CFF Follow Me
*** 10 Copies left for next price $613***
* Entry signals without repainting or delays * Error-free opening of trades * Provides signals for any direction sell & Buy * Provides multiple timeframes on a single chart * Colored Histogram based on the market direction * Arrows entry signals
How does the CFF Follow Me Works?
Our CFF Follow Me trading system based on a very accurate "Trend-Following" Trading Strategy. Here's how to Start using ou
AI Signal is an indicator that is a ready to made scalping system that doesn't repaint
Instructions: Load indicator. Use arrows as entries in trends and stay out of sideways markets. Trade with the larger trend and trade only active volatile hours Buy blue arrow above yellow and exit at red arrow or at discretion. Sell red arrow below yellow and exit at blue arrow or at discretion.
Easy to follow and is based on trends. The indicator works on all time frames and assets. Use at your own
CFF Day Trader Machine
CFF Day Trader Machine is the best trading system you will ever find when you want to go right every time with the market so that you will never have to trade against the market again, It’s providing marvelous trading signals based on such and amazing algorithm.
*** 5 Copies left for next price $613 ***

Indicator help you recognize trend quickly ( recommended to use TF M30-Daily ) Parameters: Alert when have signal Push Notification to MT4 mobil2 Benefits Easy to use. input parameters is simple The ability to use as filter for any strategy. It work on stock, index, oil, gold, and on all time frames. It has the function of push-notifications, and sound alerts. Importance : Non Repainting Indicator

Diagnosis of major and minor pivot
Trend detection
with many signals
Can be used in all symbols
Can be used in all time frames
Settings:
Back Show: The number of candles it displays
If you need any adjustments, or have any questions or suggestions, message me
How to trade:
Blue: sell signal
Red: buy signal
Blue and red at the same time: no signal
Exit signal: Opposite signal

Forecasting the future by combining trend and average price
with many signals
Can be used in all symbols
Can be used in all time frames
Settings:
BackShow: The number of candles displayed
Osi: Main setting, the larger the number, the longer the trend
If you need more settings, or have any questions or suggestions, message me
How to trade:
Blue: sell signal
Red: buy signal
Blue and red at the same time: no signal

UR Highs&Lows UR Highs&Lows does an in-depth analysis of price movement and its volatility, and creates a channel within which the price is moving. That channel moves now as an oscillator and is overlayed with price's deviation to signal potential exhaustions and possible reversals. Advantages of using UR Highs&Lows : No parameters You have 3 lines that describe the price movement - White Line which is an average of the price, and Blue Lines which are its extremes The histogram is a visualiz
Binaripex is an indicator for binary options. The indicator shows with an arrow on the chart in which direction the price will go in the near future. According to our statistics, in 95% of cases, the price in the near future (from 1 to 5 minutes on small timeframes) will go above or below the arrow indication. This allows you to use this indicator with high efficiency for trading on binary options. Also, the indicator on the chart indicates near each transaction at what distance the price went
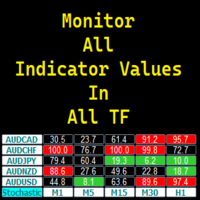
ALL in ONE Indicator Display Indicator values in all Timeframes Display Multiple Symbols/Pairs Fully customizable Click any value/box to open the chart of the corresponding symbol and timeframe Attach multiple instance of the program to display other indicator values Flexible Dashboard Positioning in chart You may request more indicators or additional feature for future updates!
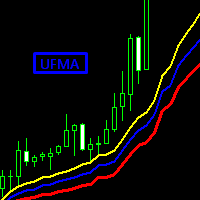
NEW FEATURE ! Now you can select the option of two MA to see the amazing MA cross of Two UFMA.
With the fast reaction of this MA you can avoid most of the false signals of a normal MA Cross.
New formula to calculate moving average, it quickly adapts to the price but maintains the analysis to determine if a change in trend is necessary.
Input Parameters:
Period: used to select the number of bars to use for calculations. Mode: Mode to use for the calculation of the moving average > SMA, EM
!! FLASH SALE !! Over 80% off !! For ONE week only. Now only $47 - normally $297! >>> Ends on 30 June 2023 - Don't miss it!
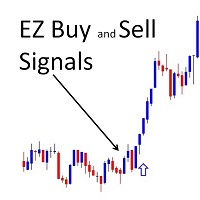
Buy and Sell Signals Directly Onto Your Charts. It couldn't be EZ-er! Aslo Gives Alerts – On Your MT4 To Your Phone To Your Email.
Does not repaint! This couldn't be EZ-er to use - just drag it onto your chart (any timeframe, any pair) set the time of day you want signals and where you want alerts, and wait for the signals. Spreads from 0.1pip RAW/ECN Acc
Reminder: After purchasing the unlimited version of this indicator send me the proof and I will add you to my private group so that you join the community and continue to learn more about this tool and grow together with other traders. You will also learn the strategy that will change your trading story! Dear Traders I am so glad to introduce my forex trading product called "Day Traders Master Board". This tool is designed for serious traders of any trading strategy. My goal is to help trader b

Golden section price action indicator - is a trend-scalping complete system with enter and exit points. Indicator is based on most powerfull price action japan patterns that are filtered by volume, volatility, market phase. Pattern is not a simple combinations of candles. Patterns must have "weight" to move market in right direction. "Weight" - is the summary of pattern's volume, the size of pattern candles according to last average volatility and ofcourse pattern must appear in correct market p

NOTE: NEXT PRICE WILL BE 550$ Dear Trader I hope you have been eagerly waiting and looking for a tool to improve your trading. I am so glad to introduce my other product to you called Trend Shooter Index. The main goal of this tool is to help traders shoot the trend (target the trend) from the bottom or from the top of the trend for maximum profitability. How is the Indicator designed
This tool is designed to show the following Red arrows pointing down for sell signals. Blue arrows pointing up
Fixation Trend indicator showing buy and sell areas. The indicator follows the price movement, works at the opening price. It also displays information about the trend following the breakout of the minimum and maximum. The indicator has very simple but effective graphics: above the opening price, an orange dot is displayed - a sell signal, below the opening price - blue, a buy signal. The indicator also accompanies the signals with a sound alert and a pop-up window notifying the signal on the op

The Mechanism Trend indicator is a hybrid indicator that shows the moments for entering the market with arrows. This indicator was created on the basis of the original indicators for searching for extreme points, the indicator is well suited for determining a reversal or a large sharp jerk to one side.
When the trend changes, the Mechanism Trend indicator uses color signaling: green - when changing from a downtrend to an uptrend, and red - vice versa, to a downtrend. You can use the indicator
Are you tired of the constant ups and downs? Do not become a victim of unstable market movements, it's time to get rid of it somehow! Already now you can use The Trend Setter solutions to balance the price movement analysis and get a clearer picture of the price action.
The Trend Setter is a trend indicator for the MetaTrader 4 trading platform. If you don't have your own trading strategy yet, you can use our ready-made trading strategy. The indicator will help in finding entry points when an

Polynomial Trend - A tool that allows you to determine the direction and strength of a trend. Unlike most indicators, Polynomial Trend finds longer-term trends and gives fewer false signals. This indicator allows you to find the most likely trend reversal points b allows you to identify the current market phase (uptrend, downtrend).
This indicator displays arrows of different colors depending on the current state of the market and thus signals the user about a change in trend. It is easy to u

Shift Trend is a forex trend arrow indicator for identifying potential entry points. Determining the market trend is an important task for traders. The Shift Trend indicator implements an advanced algorithm for visualizing the market trend. Shows the opening points of transactions for sale or purchase, and also indicates the direction of the trend on: short-term and long-term periods. Suitable for trading on low timeframes because it ignores sudden price spikes or corrections in price action by

What are "pivot points"? Pivot point analysis is often used in conjunction with the calculation of support and resistance levels, as is the case with trend line analysis. Pivot point analysis calculates the first support and resistance levels using the trading range width between the pivot point and the previous day's high or low price. The second support and resistance levels are calculated using the entire width between the previous day's high and low prices.
Looking for a quality pivot poi

A useful dashboard that shows the CCI values for multiple symbols and Time-frames.
It can be easily hidden/displayed with a simple click on the X top left of the dashboard.
You can input upper and lower CCI values and the colours can be set to show when above/below these values. The default values are 100 and 30-100 There are also input colours for when the CCI is positive or negative (but not exceeding the upper/lower levels
Symbols and time-frames are input separated by commas.
Sym
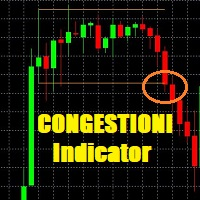
This indicator is very usefull to TRADE Trading Ranges and helps identify the following TREND. Every Trader knows that any market stay 80% of the time in trading ranges and only 20% of the time in TREND; this indicator has been built to help traders trade trading ranges. Now instead of waiting for the next TREND, You can SWING TRADE on trading ranges with this simple yet very effective indicator.
TRADING with CONGESTIONI INDICATOR:
The CONGESTIONI Indicator identify a new trading range and a
Average directional index - improved indicator formula. This version of ADX much more accurately determines the price reversal points and the direction of the current trend. In addition, using this indicator, you can determine the strength of the trend. When the green line crosses the red line from the bottom up, this means that the trend is turning up or a temporary pullback is forming. When the red line crosses the green line from top to bottom, it means that the trend is turning down or a te
Divergence is one best ways to trade the financial market as it is a leading indicator of price action that detect high probability reversal and continuation setups. The AlgoKing Divergence Detector is an RSI and Stochastics Indicator with Divergence Detection. Features Hidden Divergence for trend continuation. Standard or Normal Divergence for trend reversal. Screen Alerts. MetaQuotes Notifications. Email Notifications. RSI Indicator built in. Stochastics Indicator built in. Types of Divergen
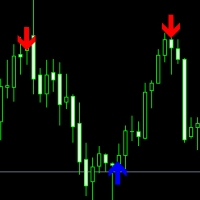
Price reversal Pro - points where the price will reverse with a 95% probability. This information will help every trader to effectively open trades. The indicator on the chart draws arrows in which place and in which direction the price will reverse. You need to wait for the indicator to draw an arrow and open an order in the indicated direction. This is the simplest trading strategy. The indicator does not redraw its arrows and shows price reversals for medium and long distances. This means th

Introduction to Chart Pattern MT Chart Pattern MT is a chart pattern scanner to detect the triangle pattern, falling wedge pattern, rising wedge pattern, channel pattern and so on. Chart Pattern MT uses highly sophisticated chart pattern detection algorithm. However, we have designed it in the easy to use with intuitive user interface. Chart Pattern MT will show all the patterns in your chart in the most efficient format for your trading. You do not have to do tedious manual pattern detection an
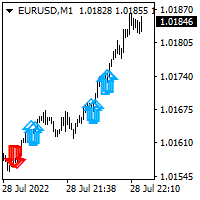
This indicator helps you to build position and profit when market turns in your favor. You will build your full position by trading many small position. Once blue arrow appear on the chart, you could add long position. Once red arrow appear on the chart, you could add short position. I personally spread my full size position in to 5-10 small position. I use small target of 2-5 pips on eurusd pair.

This indicator is designed for those people who want to trade and make money on any instrument and time frame. It gives a very good point to enter the market, to trade is very simple, arrows will show when to open a deal, set and trade without thinking about anything, stop-loss and take profit, set everything depends on your trading style, who is scalping and who keeps the deal for a few days.

https://c.mql5.com/31/761/best-trend-indicator-logo-200x200-8493.png The indicator uses a solid line of red and green to reflect the myriad changes in market prices. The green line indicates a period of rising market prices and the red line indicates a period of falling market prices. Solid line color change indicates that the market has changed and the market is likely to reverse! It is recommended that you use this indicator on your daily K-chart. This indicator is not suitable for you to do
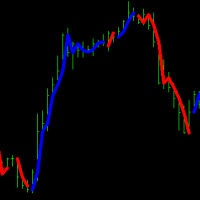
Trend indicator to determine the direction of the trend. The indicator scans the market looking for sharp price reversals and shows the trader where a bearish or bullish trend begins. When the market moves sideways, the indicator stops drawing signal lines. Thanks to this indicator, each trader is able to quickly determine the direction of the market and open the right orders in the direction of price movement. You can also analyze the market on different timeframes, confirming the signals of a

Night Ghost - Arrow indicator for binary options.
This is a reliable assistant to you in the future!
- No redrawing on the chart -Works great on EUR/USD currency pairs! -Indicator accuracy up to 90% (Especially at night)
-No long setup required (Perfectly set up for Binary Options)
- Not late signals
- The appearance of a signal on the current candle
-Perfect for M1 period (No More!)
- Eye-friendly candle color (Red and Blue)
-Installed Alert
Working with it:
- Blue arrow

Forex Gump Trend is a universal indicator for highly effective determination of the trend direction. If you identify the trend correctly, this is 95% of trading success, because you will be able to open trades in the direction of the price movement and benefit from it. The Forex Gump Trend indicator helps traders with a high degree of efficiency to determine the current trend direction, as well as trend reversal points. The direction of the trend is shown by colored lines on the chart, and the
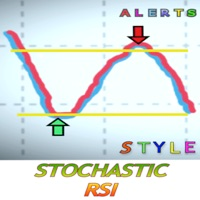
What is Stochastic RSI? The Stochastic RSI (StochRSI) is an indicator used in technical analysis that ranges between zero and one (or zero and 100 on some charting platforms) and is created by applying the Stochastic oscillator formula to a set of relative strength index (RSI) values rather than to standard price data. This version includes alerts to do not miss really good opportunities. You set the parameter when you want to receive a signal buy order or signal sell order. In order to receive
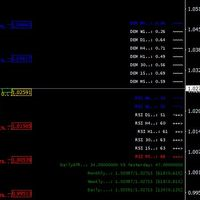
I decided to add parallel function with DeMarker to free version of my indicator with RSI MTF. it is good for scalping or for weekly trading and looks as universal fx-toy. In menu you can turn on daily percentage gain info, it is good for crypto as for me, weekly and monthly gains also included as informers. Short ATR helps to determine when price was stopped and entry for pulse pump/dump. The filter of numbers of RSI can be tuned for overbought/oversold values with colors you needed. Examp

Currently switched to the 4 hour chart - but use other time frames for confirmation. :-) I change my main time frame based on the market movement at the time. The Hurricane Forex Indicator is a multi time frame indicator that includes such things as Trade Notifications, Trade Calculator, Momentum Indicator, risk reward and much more. We have a free Trade room for our users as well. Please check out the video for full details of how this indicator works as it has over 15 years worth of developme

BSA indicator is a ZigZag based indicator. This indicator is used to find the reversal level of the price. You can use the existing risk ratio and calculation timeframe in the entries by optimizing them according to your usage preference. In lower time frames, the indicator can repaint. For healthier results, you can detect the least repainting by observing for a while according to the graphic you will apply.
Simple Dark Holder Tool
Arrow indicator for Forex and binary options
Already tuned for the best signals
Multicurrency and multitimeframe
Works on all currency pairs as well as raw materials, etc.
Works on the author's strategy and combines 3 indicators that show good results
Does not draw or redraw
The signal appears clearly at the opening of the candle
blue up
Red down
Alert is also built into it for your convenience.
Test and watch a video on how it works

Weddell Pro is a good trading tool that is suitable for both a beginner and an experienced trader.
It can be used both separately and combined with other strategies and indicators
Configured for currency pairs was tested several times on cryptocurrency but did not show a high result
Currency pairs USD/EUR AUD/CAD GBP/USD Showed itself very well here
The percentage of correct transactions is above 68%, which does not make it perfect and bad
Doesn't draw or disappear
The red arrow sho

Welcome to Upside Down !
Upside Down is a powerful indicator that gives the perfect trading opportunities and a clear indication of the market. Upside Down has been created to be as simple as possible. Arrows are calculated based on ASC Trend and customs indicators . Signals appear without delay at the end of a candle, if it has tested the level. The signals do not overdraw.
THE BENEFIT:
Easily to enter in buy position/sell position Intuitive directional arrows by co
The MetaTrader Market offers a convenient and secure venue to buy applications for the MetaTrader platform. Download free demo versions of Expert Advisors and indicators right from your terminal for testing in the Strategy Tester.
Test applications in different modes to monitor the performance and make a payment for the product you want using the MQL5.community Payment System.
You are missing trading opportunities:
- Free trading apps
- Over 8,000 signals for copying
- Economic news for exploring financial markets
Registration
Log in
If you do not have an account, please register
Allow the use of cookies to log in to the MQL5.com website.
Please enable the necessary setting in your browser, otherwise you will not be able to log in.