Watch how to order a trading robot
Read the Rules before you post an order or execute it
How to Order a Trading Robot in MQL5 and MQL4
See a sample Requirements Specification to order a robot
New orders in the category:
30+ USD
30+ USD
200 - 300 USD
Specification
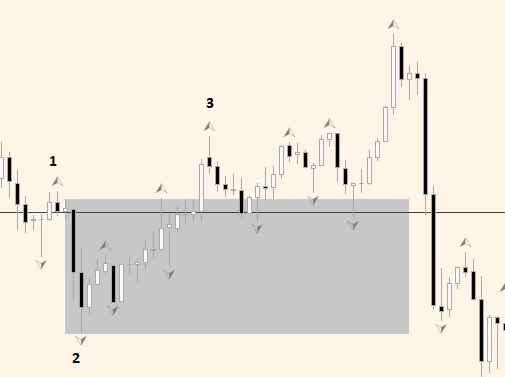
Need rectangle zone drawn of height : between top of candle 1 and bottom candle 2.
As long as candle 3 open is higher than top of candle 1 wick.
Vice-versa also needed for opposite signal
see attached chart
Responded
1
Rating
Projects
9
44%
Arbitration
0
Overdue
0
Free
2
Rating
Projects
111
26%
Arbitration
17
6%
/
71%
Overdue
15
14%
Free
Published: 9 codes
3
Rating
Projects
0
0%
Arbitration
0
Overdue
0
Free
4
Rating
Projects
317
24%
Arbitration
23
35%
/
13%
Overdue
23
7%
Free
Published: 3 codes
5
Rating
Projects
34
26%
Arbitration
7
14%
/
43%
Overdue
7
21%
Free
6
Rating
Projects
4
0%
Arbitration
1
100%
/
0%
Overdue
0
Free
7
Rating
Projects
146
34%
Arbitration
13
8%
/
62%
Overdue
26
18%
Free
Published: 6 codes
8
Rating
Projects
0
0%
Arbitration
0
Overdue
0
Free
Similar orders
EA Crafter
500+ USD
Act as a professional Quantitative Developer and Risk Manager. I want to build a systematic trading strategy rulebook that prioritizes capital preservation and statistical edge over raw performance. Please generate a structured trading strategy using the following framework: 1. ASSET CLASS & TIMEFRAME: - Asset: [e.g., Apple (AAPL), Bitcoin (BTC), or EUR/USD] - Timeframe: [e.g., 5-minute, 1-hour, Daily] 2. CORE
Driven Multiple Choice
30+ USD
Part 1: Project setup Input settings (risk, stop loss, take profit, EMA periods) Indicator initialization Trade management framework Part 2: Trading logic EMA crossover detection Buy/Sell entry rules One-trade-per-symbol check Part 3: Risk management Automatic lot size calculation Stop-loss and take-profit placement Trade execution and error handling Part 4: Final touches On-screen information Optimization
Professional AI Automation Trading Bot for Forex & Crypto
500 - 1500 USD
Title Professional AI Automation Trading Bot for Forex & Crypto Solution Language Python (preferred) or MQL5 depending on integration requirements. Categories Expert Advisor (EA) for MetaTrader 5 Automated trading strategies AI/ML-based signal generation Risk management automation Required Skills Strong knowledge of MQL5/Python Experience with MetaTrader API integration Machine learning model deployment
Project information
Budget
30 - 40 USD
Deadline
from 1 to 2 day(s)